Interpretation of Financial Statements - Ratio Analysis
1/48
There's no tags or description
Looks like no tags are added yet.
Name | Mastery | Learn | Test | Matching | Spaced |
|---|
No study sessions yet.
49 Terms
Why is interpretation of financial statements important?
In-depth understanding
Comparison
In-depth understanding
Interpretation is the commentary on the results of the ratios calculated
eg what do they mean, how is the company performing against benchmarks
Comparison
Ratios help to build up a picture of the position and performance of a company
Used for comparison and therefore must be used in context as if you calculate a ratio in isolation it won’t tell you a great deal about the financial health or performance of a company
Types of ratio
Profitability
Efficiency
Liquidity
Gearing
Profitability ratios
ROCE
GP Margin
OP Margin
ROCE
Return On Capital Employed
fundamental measure of business performance
what does it show?
expresses relationship between operating profit and average long-term capital invested in the business
ROCE Equation
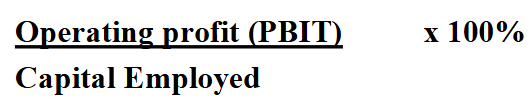
what is capital employed?
retained profit, reserves, share capital, share premium, non-current liabilities
Interpretation of ROCE
inputs & outputs
effectiveness of funds
shareholders
interest rate
inputs & outputs
compares inputs (capital invested) with outputs (operating profit)
effectiveness of funds
assesses the effectiveness with which funds have been deployed during the accounting period
high = attractive
shareholders
could the business/shareholders be getting a better return by investing its funds elsewhere
interest rate
ideally ROCE should be higher than the rate of interest in banks
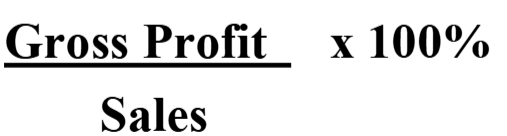
GP Margin
Gross Profit Margin
relates gross profit to the same period’s sales revenue
what is it?
a measure of profitability in buying & selling products before other expenses
GP Margin Equation
interpretation
retained profit
profit level
liquidity
direct costs
retained profit
looks at how much of sales revenue is retained as gross profit
profit level
represents what a company made after paying off its COGS
liquidity
a high GP Margin means the company is more liquid and therefore can spend more on overheads
direct costs
if a company’s direct costs such as raw materials increase, the GP Margin will fall unless selling prices are increased
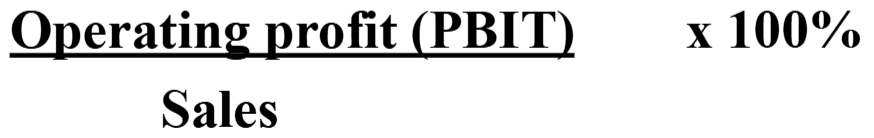
OP Margin
Operating Profit Margin
relates the operating profit for the period to the sales revenue generated
what does it show?
the margins earned on sales as well as the firm’s ability to control its operating costs
OP Margin Equation
interpretation
retained
indications
variations
retained
shows how much of the sales revenue is retained as operating profit
indications
the higher the OP Margin is the better
less than 5% means the company is in a very competitive sector or is doing badly
if the GP Margin is stable but the OP Margin is falling it indicates to examine operating costs
Efficiency ratios
NCA Turnover
TR Period
Inventory Holding Period
TP Period
NTC
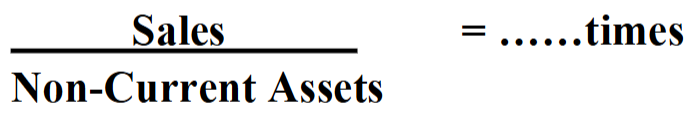
NCA Turnover
Non-Current Asset Turnover
measure of how effectively the firm is using its long-term asset base to generate sales
NCA Turnover Equation
shows the amount of sales revenue generated per £ of non-current assets
interpretation
productivity level
indications
profitability level
measure of the level of activity & productivity of a company
highlights the company’s ability to generate sales revenue from its asset base
indications
if the assets aren’t producing sales then it is a drain on the company’s resources & efficiency
yet this may be distorted by the failure to replace assets