Aggregate Demand and Supply Concepts
1/23
There's no tags or description
Looks like no tags are added yet.
Name | Mastery | Learn | Test | Matching | Spaced |
|---|
No study sessions yet.
24 Terms
Nominal GDP
Total monetary value of all goods produced.
P
Average prices index of goods and services.
Q
Real GDP, adjusted for inflation.
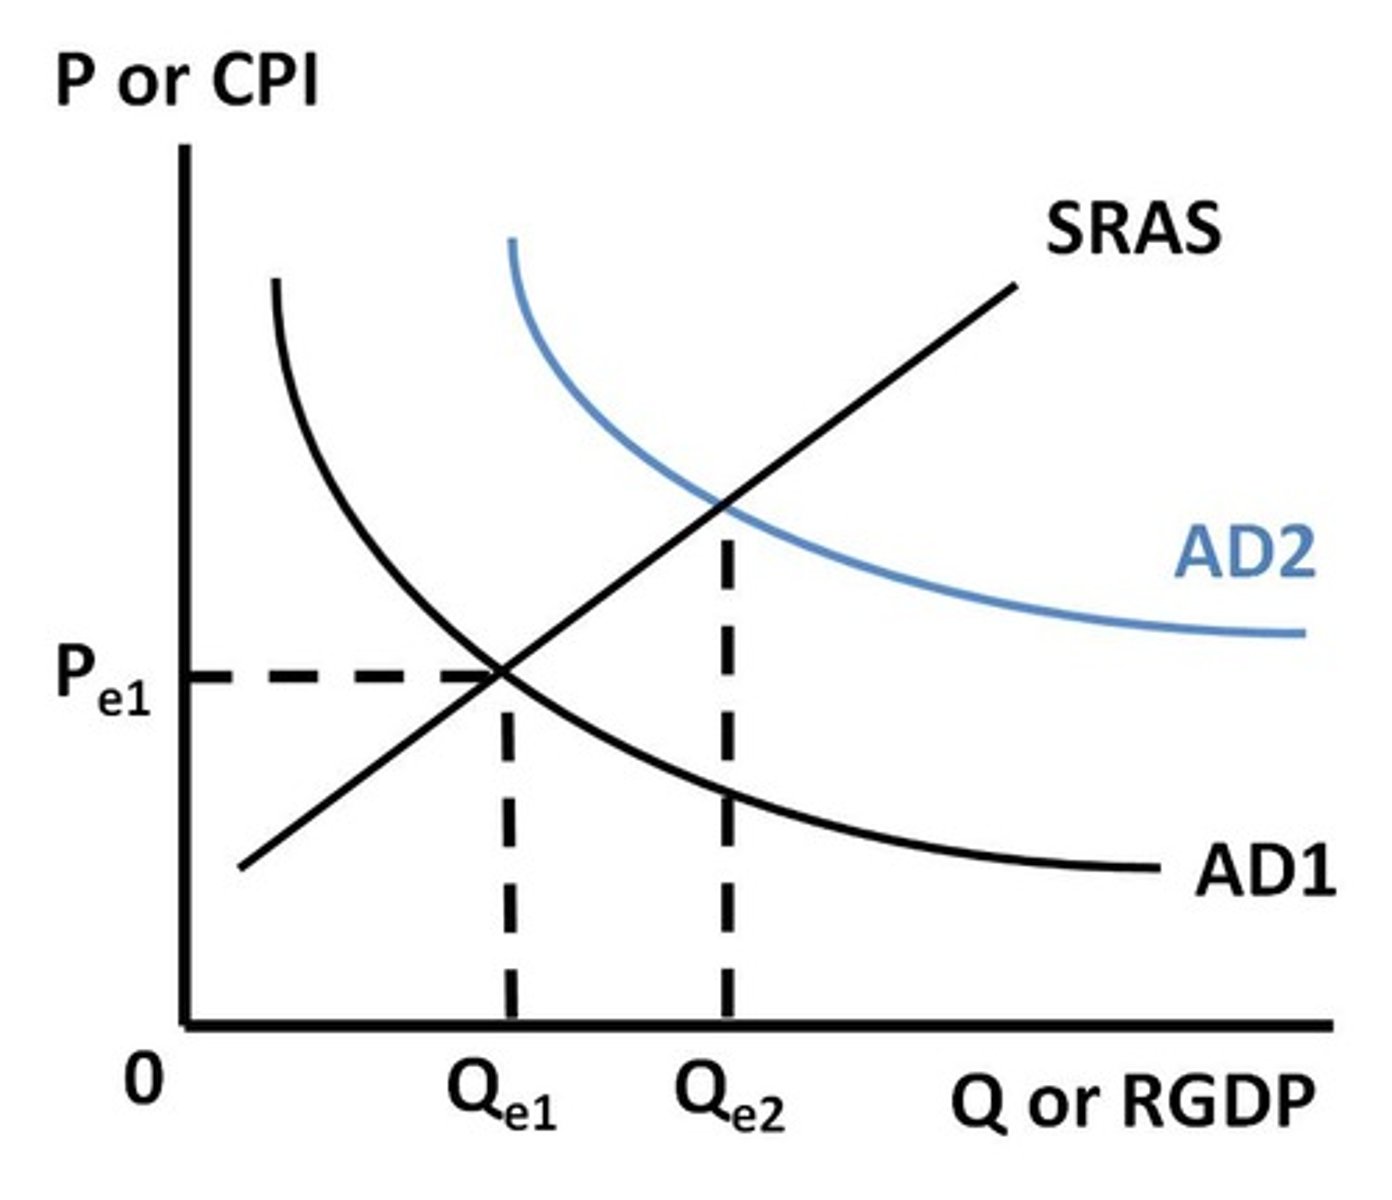
Aggregate Demand (AD)
Curve showing real GDP quantities at price levels.
Total Expenditures (TE)
Sum of consumption, investment, government, and net exports.
Consumption Spending
Household expenditures on goods and services.
Investment Spending
Business expenditures on capital goods.
Government Purchases
Government spending on goods and services.
Net Exports
Exports minus imports in trade balance.
Shift in Aggregate Demand
Changes in consumption, investment, government, or net exports.
Real Balance Effect
Impact of price changes on purchasing power.
International Trade Effect
Influence of price levels on exports and imports.
Used Goods Effect
Impact of used goods on aggregate demand.
Aggregate Supply (AS)
Curve showing RGDP offered at various price levels.
Unit Labor Cost
Total labor cost divided by output quantity.
Wage Changes
Adjustments in wages affecting aggregate supply.
Factor Productivity
Output per input unit affecting supply.
Supply Shocks
Unexpected events affecting supply levels.
Inflation Tax
Reduction in currency value due to inflation.
Horizontal Aggregate Supply Curve
Indicates constant price level with increased output.
Kinked Aggregate Supply Curve
Shows price rigidity in response to demand changes.
Three Aggregate Supply Curves
Horizontal, kinked, and three-stage models.
Great Depression Unemployment
Peak unemployment rate of 25% during 1930s.
Price Level Index (CPI)
Measures average price changes over time.