HL IB Math U5
1/24
There's no tags or description
Looks like no tags are added yet.
Name | Mastery | Learn | Test | Matching | Spaced | Call with Kai |
|---|
No study sessions yet.
25 Terms
Discrete Data
Certain number of values possible, countable
Continuous Data
Take on any value, usually measured
how can Reliability be compromised
missing data, small sample size, error in handing data
target population
population from which you want to take a sample.
celery sticks grown in a US state
sampling frame
list of the items or people (within the target population) from which you can take your sample.
list of celery sticks
sampling unit
single member (such as an item or person) from the sampling frame that is chosen to be sampled.
one celery stick
sampling variable
the variable under investigation. This is the characteristic that you want to measure from each sampling unit.
length of celery stick
sampling values
the possible values which the sampling variable can take.
measured length of celery stick
Simple random sampling (SRS)
Each member of the population has an equal chance of being selected. A sample is chosen by drawing names from a hat, or assigning numbers to the population and using a random number generator.
Example: To conduct a simple random sample to find the mean length of time spent doing homework, you might put the names of every student in the school into a hat and draw out the names of 100 students to form a sample.
Systematic sampling
Here, you list the members of the population and select a sample according to a random starting point and a fixed interval.
Example: If you wanted to create a systematic sample of 100 students at a school with an enrolled population of 1000, you would choose every tenth person from the list of all students.
Stratified sampling
This involves dividing the population into non-overlapping smaller groups known as strata. The strata are formed based on members' shared characteristics. You then choose a random sample from each strata, and put them together to form your sample.
Example: In a high school of 1000 students, you could choose 25 students from each of the four year groups to form a sample of 100 students.
Quota sampling
This is like stratified sampling, but involves taking a sample size from each strata in proportion to the size of the population. *NOT RANDOM
Example: In a high school of 1000 students where 60% are female and 40% are male, your sample should also have 60% female and 40% male.
Convenience Sampling
most accessible, online survey etc.
Mean
average
mode
most frequent
median
middle value
How to find low outliers
LOW OUTLIERS < Q1 - 1.5(IQR)
How to find high outliers
HIGH OUTLIERS < Q3 + 1.5(IQR)
IQR FORMULAS
Q3 - Q1 = IQR
CSOS
Center(mean,median,mode), spread(range, min,max), outliers, shape
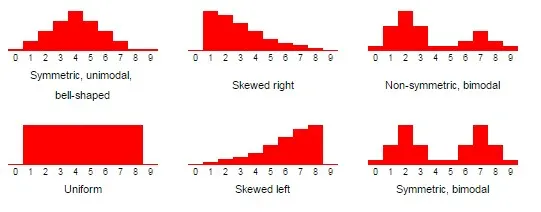
Type of shapes of graphs