(L9) IMED2004 - Linkage and Recombination II
 Call Kai
 Learn
Learn Practice Test
 Spaced Repetition
 Match
Match Flashcards
 Knowt Play
1/81

There's no tags or description
Looks like no tags are added yet.
Name | Mastery | Learn | Test | Matching | Spaced | Call with Kai | Chat |
|---|
No analytics yet
Send a link to your students to track their progress
82 Terms
What are the nine learning outcomes for Linkage and Recombination II?
1. Define what it means for two genes to be linked with reference to the probability of recombination occurring between them.
2. Explain how gamete and progeny genotype proportions differ when two loci are linked versus unlinked.
3. Define recombination frequency, RF (θ), and explain what RF = 0.5 and RF = 0 mean.
4. Distinguish cis and trans gene configuration and identify recombinant and non-recombinant gametes from each.
5. Define linkage mapping as it relates to disease genes.
6. Define genetic markers and explain how co-segregation with disease is used for linkage mapping.
7. Explain why limited meioses/recombination events and poor map resolution limit linkage mapping.
8. Explain broadly what a specific LOD score, Z, indicates about the relationship between two loci.
9. Explain how genetic heterogeneity and incomplete penetrance can confound linkage studies.
What does it mean for genes to be linked?
Linked genes are genes that tend to be inherited together because they are located close together on the same chromosome.
Why:
- Recombination is less likely to occur between loci that are physically close.
- Therefore, their parental allele combinations are more likely to remain together.
How does linkage differ for genes on different chromosomes, far apart on the same chromosome, and close together on the same chromosome?
Different chromosomes:
- Assort independently.
.
Far apart on the same chromosome:
- Often behave as if unlinked because crossing over commonly separates them.
.
Close together on the same chromosome:
- Less likely to be separated by recombination.
- More likely to be inherited together.
- More tightly linked.
Why is genetic linkage important?
Linkage affects which alleles are inherited together.
It can also be exploited to identify genes responsible for Mendelian diseases by tracking co-inheritance of:
- A disease allele
with
- Nearby polymorphic genetic markers that do not themselves cause the disease.
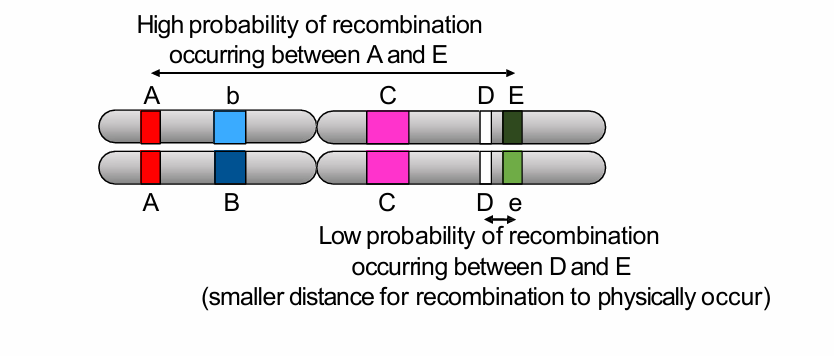
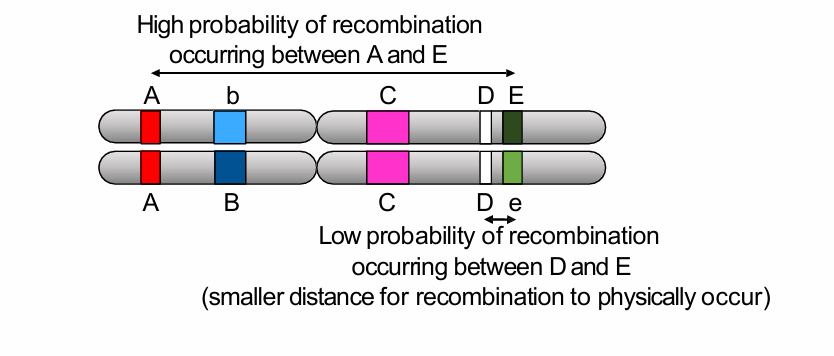
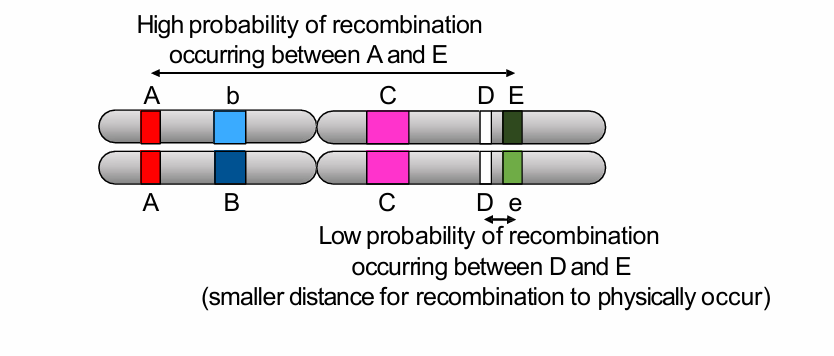
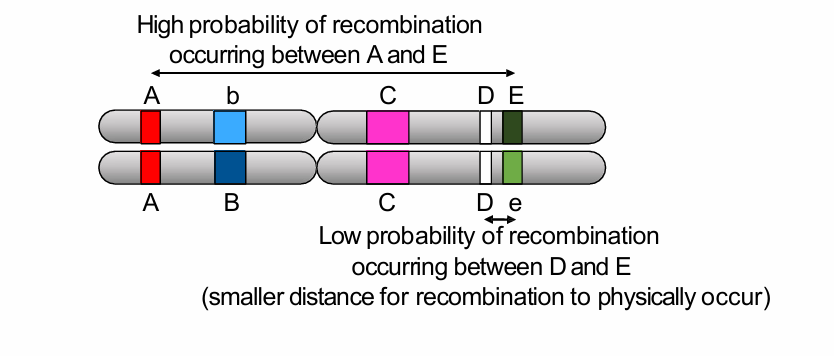
How does physical distance between two loci affect recombination probability?
The relationship is a gradient rather than all-or-none.
Farther apart:
- Higher probability of a crossover occurring between them.
- Lower degree of linkage.
.
Closer together:
- Lower probability of crossover.
- Higher degree of linkage.
.
Example shown:
- A and E are far apart → high recombination probability.
- D and E are close → low recombination probability.
What is a testcross for detecting linkage between two genes?
A testcross crosses:
- A double heterozygote, e.g. AB/ab
with
- A homozygous recessive parent, ab/ab
.
The offspring reveal which gametes were produced by the double heterozygote.
This allows recombinant and non-recombinant progeny to be counted.
Why is the homozygous recessive parent useful in a linkage testcross?
The homozygous recessive parent produces only one gamete type:
- ab
Therefore:
- Each offspring genotype directly reflects the gamete produced by the double heterozygote.
- Recombinant and parental gamete classes can be identified easily.
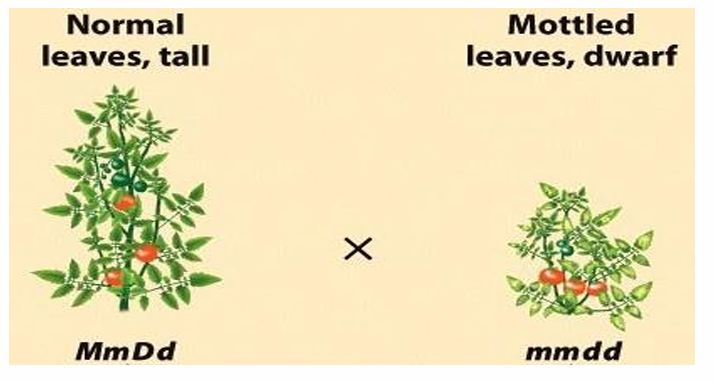
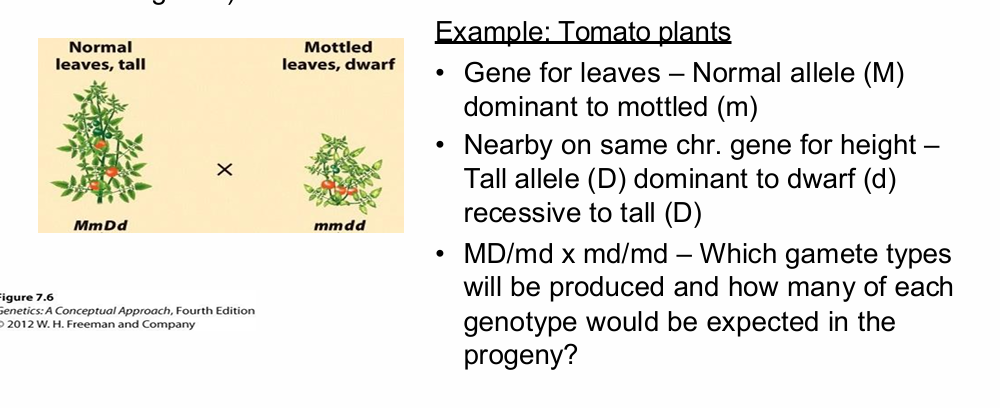
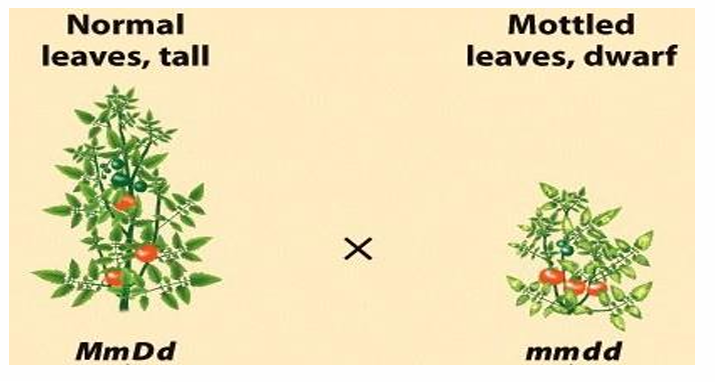
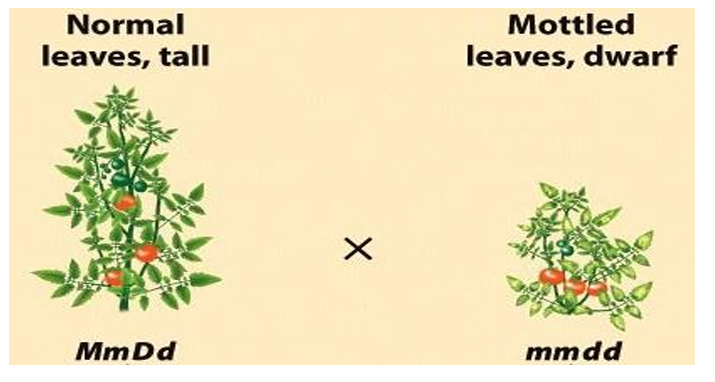
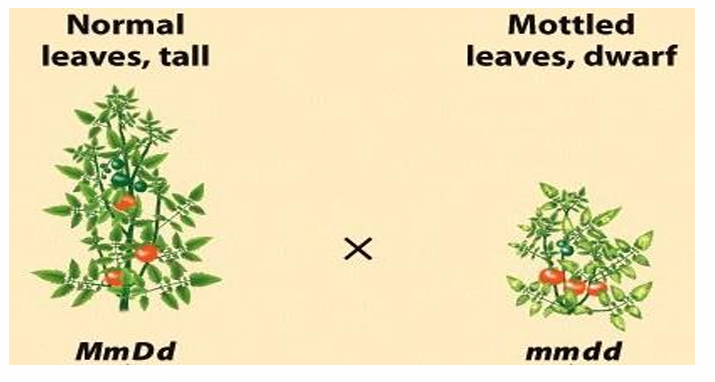
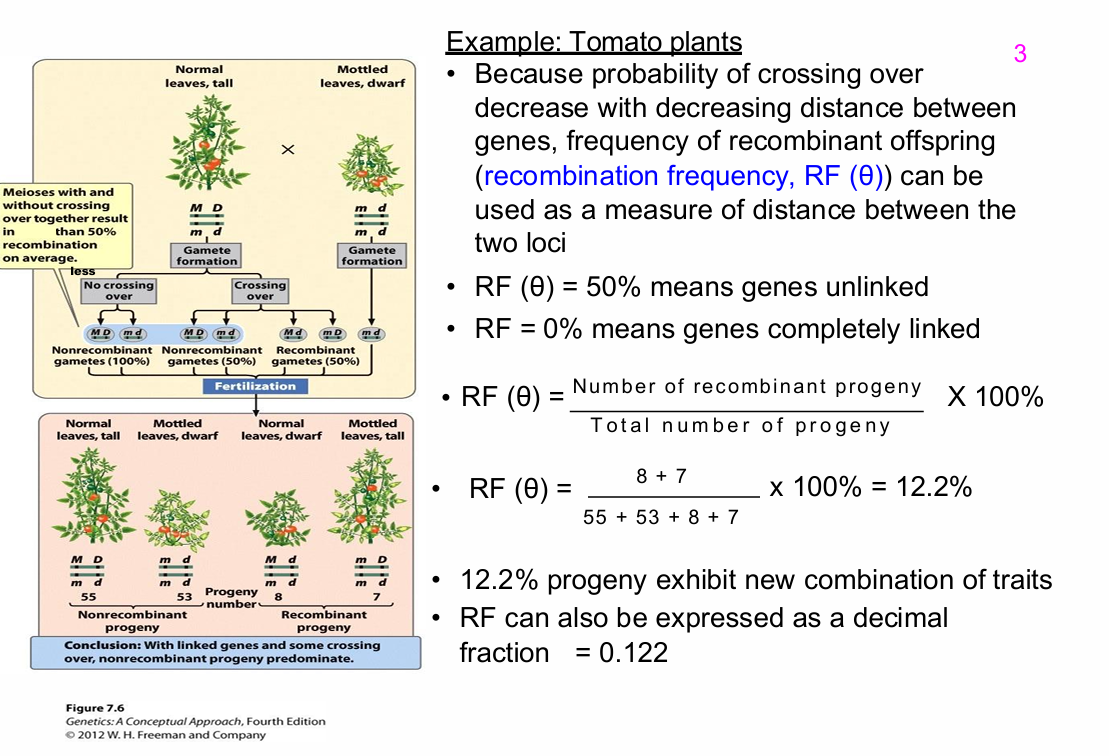
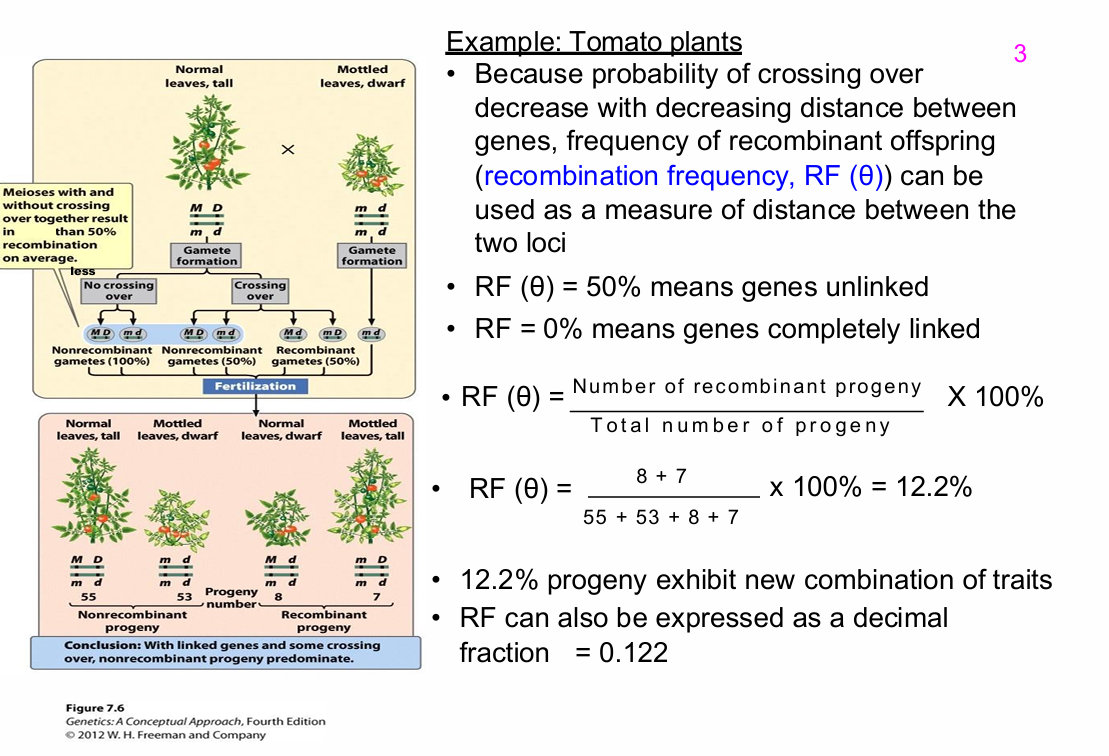
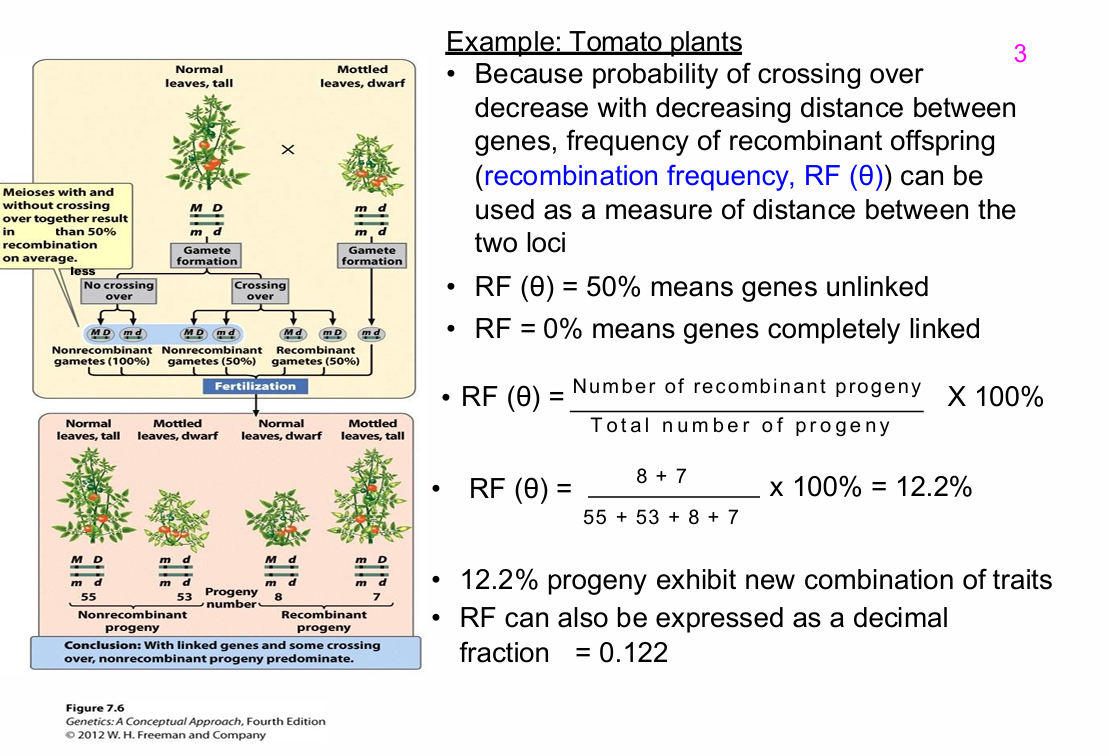
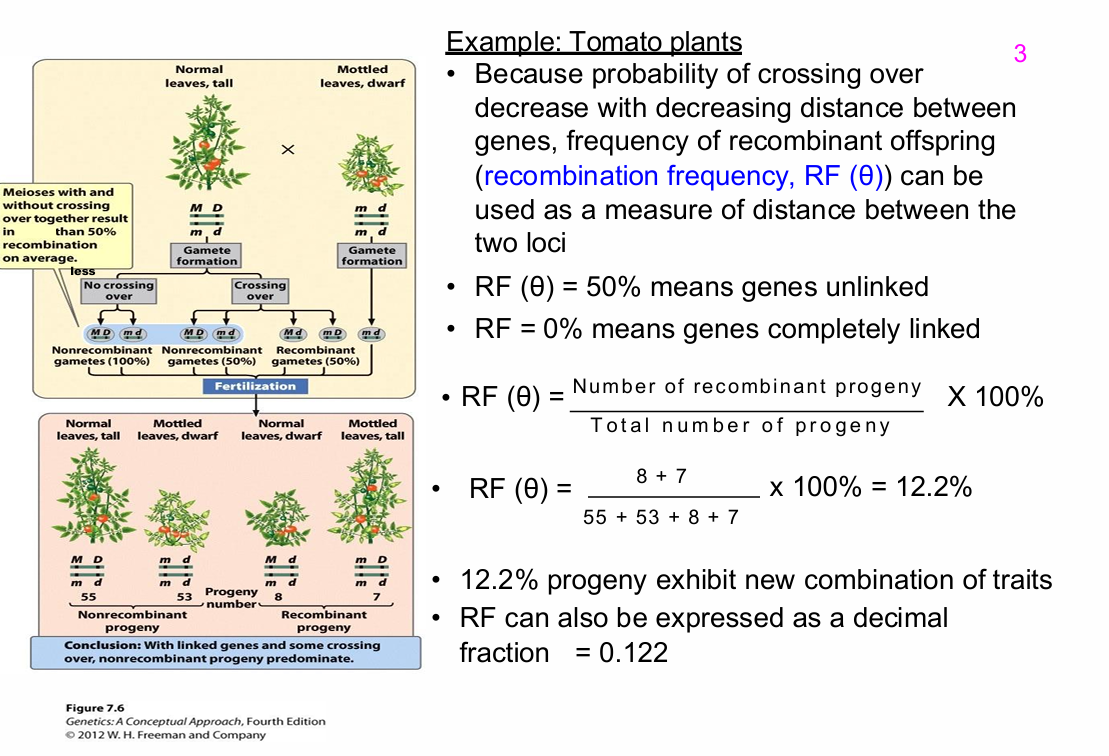
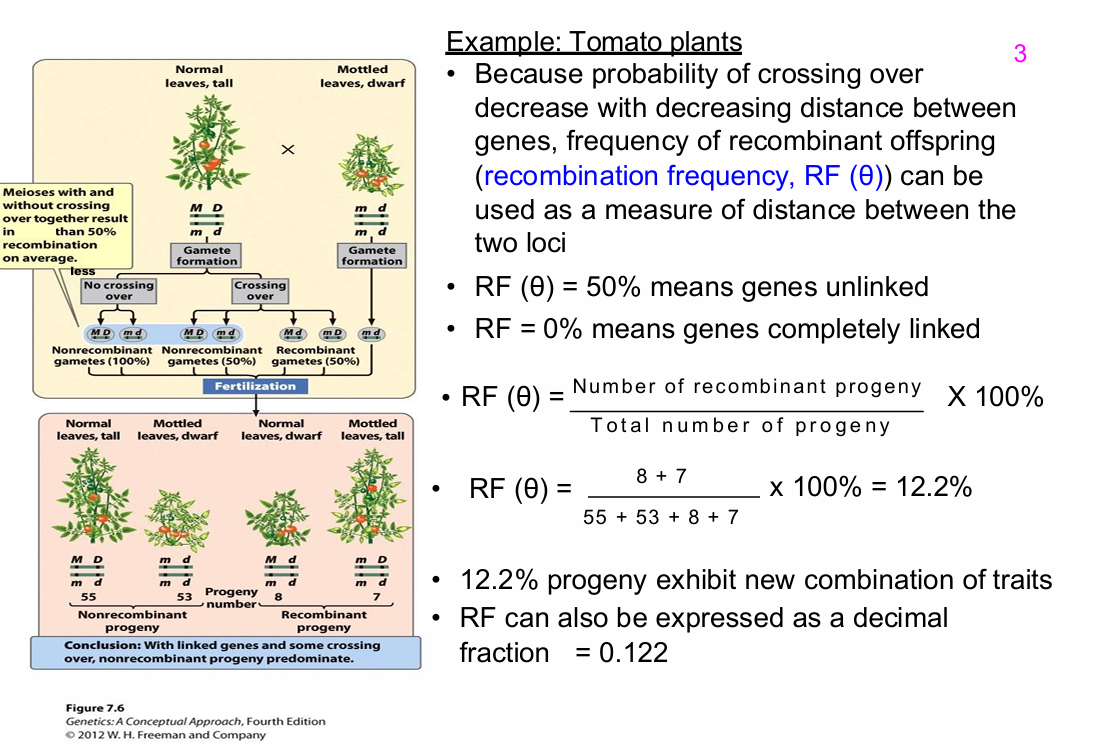
What tomato traits and alleles were used in the linkage testcross example?
Leaf phenotype:
- M = normal leaves, dominant
- m = mottled leaves, recessive
Height:
- D = tall, dominant
- d = dwarf, recessive
Cross:
MD/md × md/md
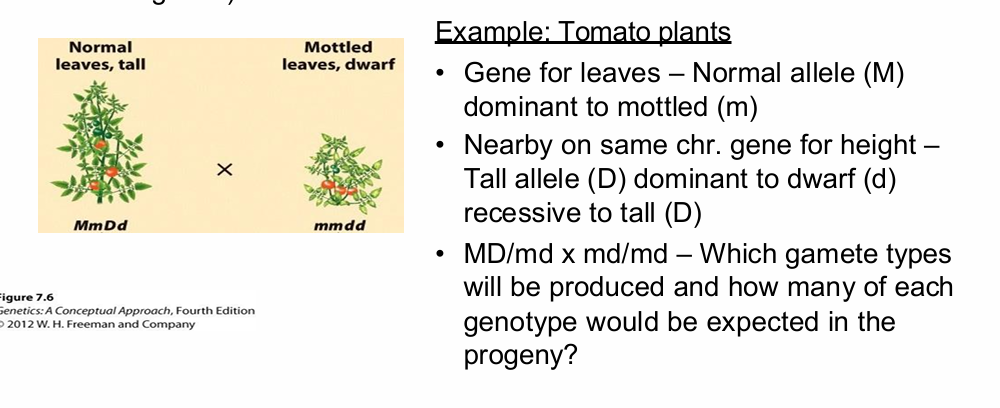
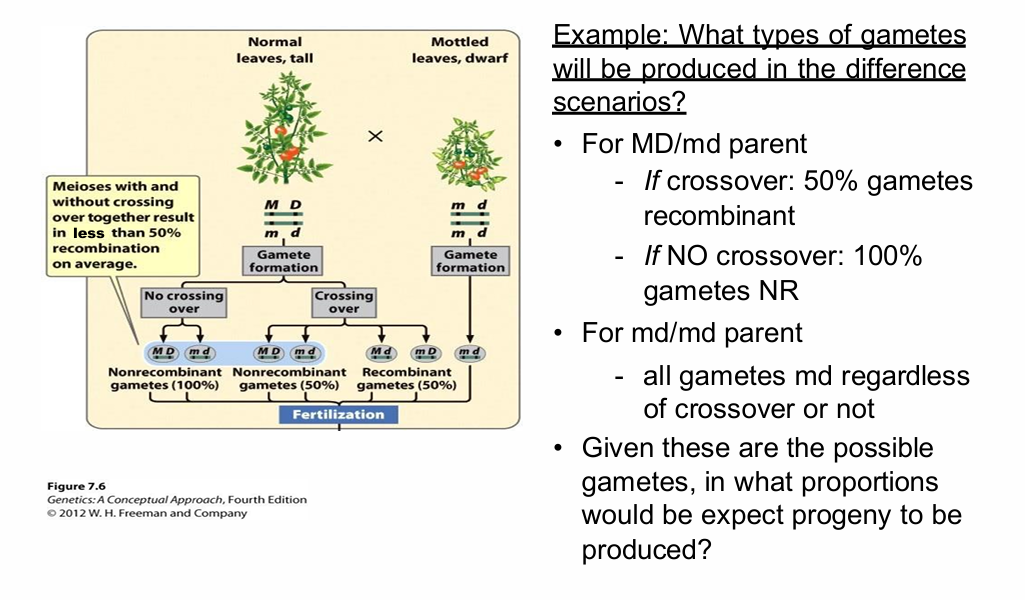
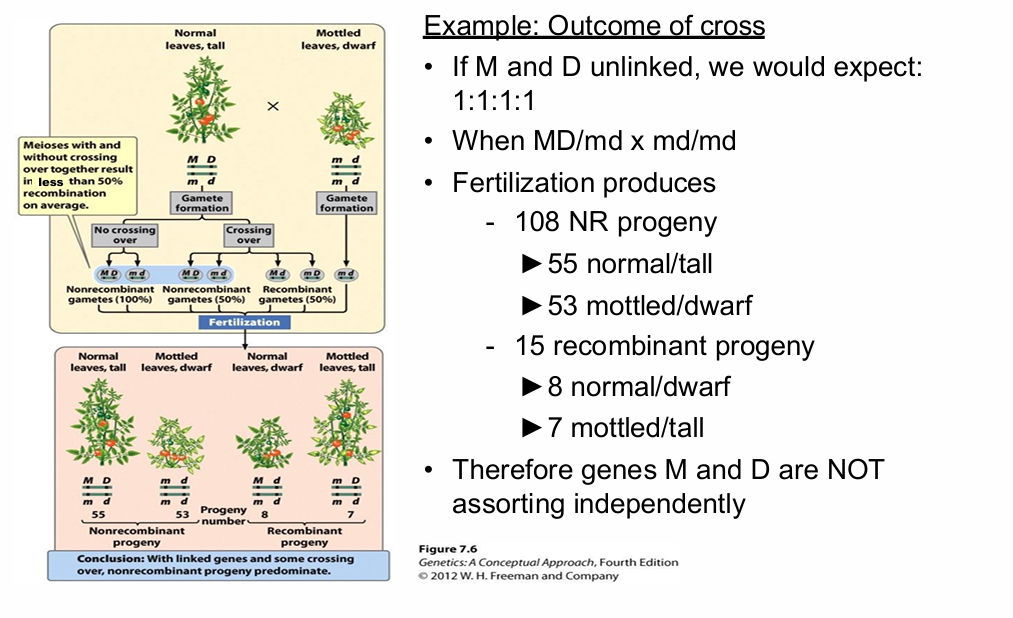
What gametes can the MD/md parent produce with and without crossing over?
If no crossover occurs between M and D:
- Only parental/non-recombinant gametes:
- MD
- md
.
If crossover occurs:
- Recombinant gametes can also be produced:
- Md
- mD
Because crossing over is reciprocal, the two recombinant classes are produced in equal numbers.
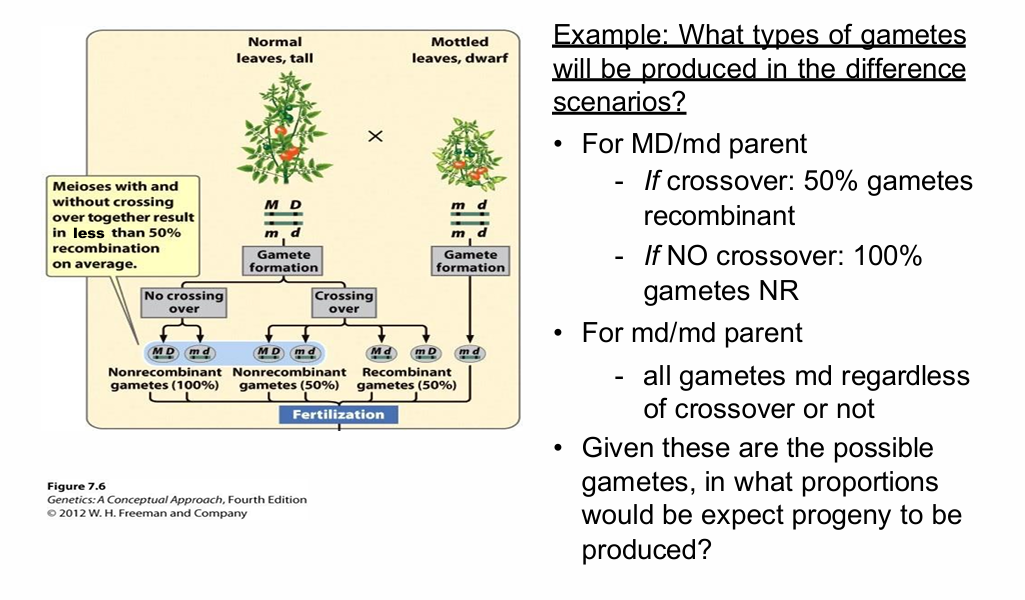
What gametes can the md/md parent produce in the tomato testcross?
Only:
- md
This is true regardless of whether crossing over occurs.
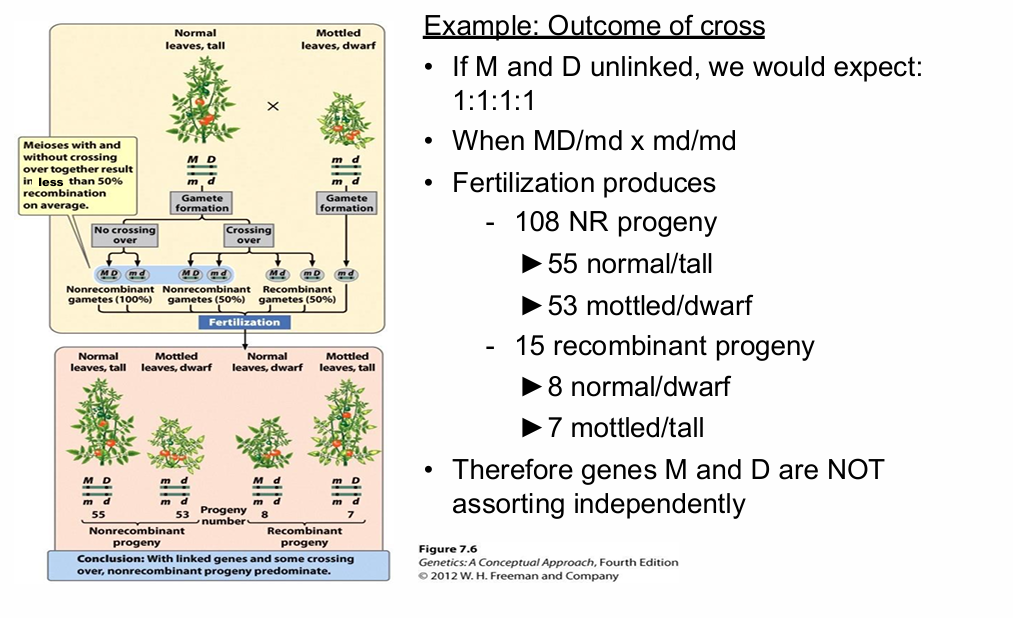
What progeny ratio would be expected if M and D were unlinked in the tomato testcross?
Expected ratio:
1 : 1 : 1 : 1
This reflects equal production of:
- MD
- md
- Md
- mD
gametes by the double heterozygote.
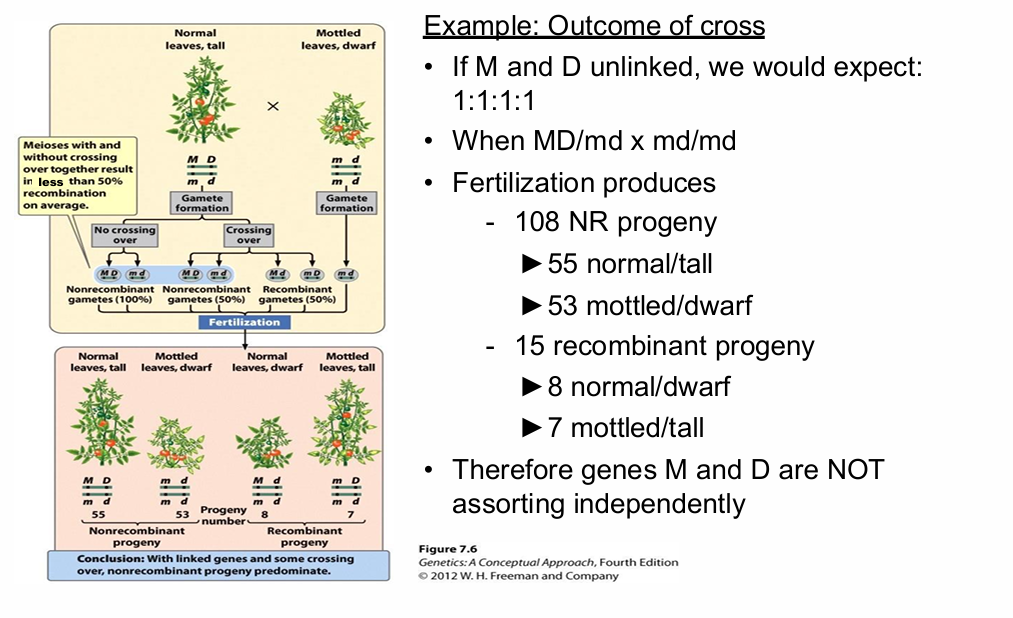
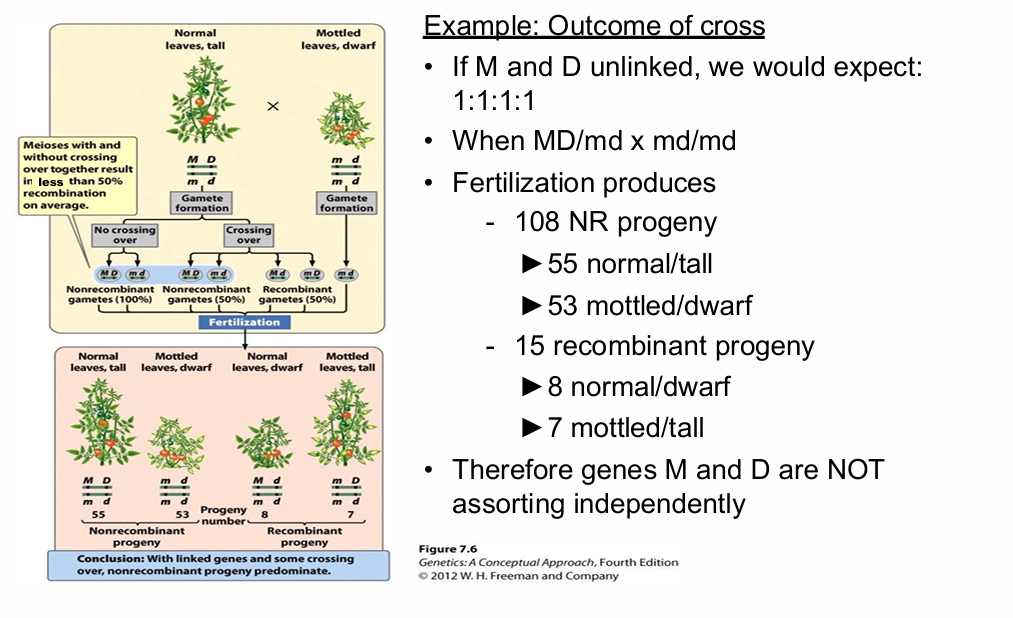
What progeny were actually observed in the tomato testcross?
Non-recombinant progeny = 108:
- 55 normal/tall
- 53 mottled/dwarf
.
Recombinant progeny = 15:
- 8 normal/dwarf
- 7 mottled/tall
Therefore:
M and D are not assorting independently and are linked.
What is recombination frequency, RF (θ)?
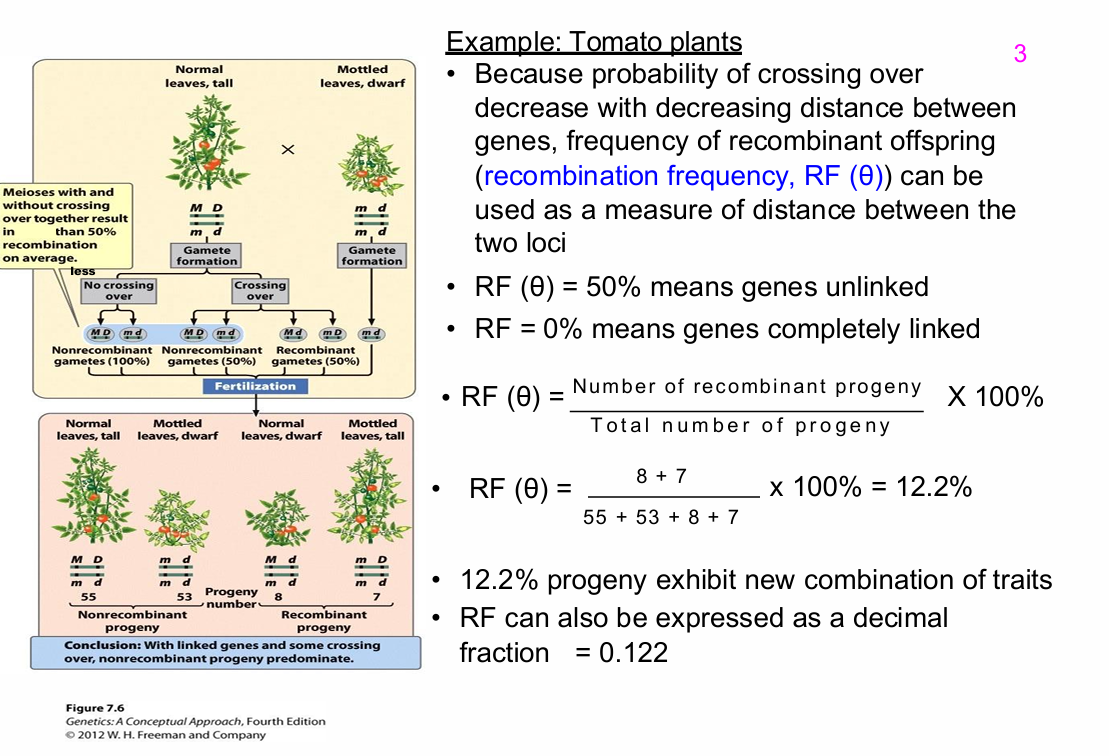
Recombination frequency is the proportion of offspring that are recombinant.
Formula:
RF (θ) = Number of recombinant progeny ÷ Total progeny × 100%
It can also be expressed as a decimal fraction.
What does RF = 50% or θ = 0.5 mean?
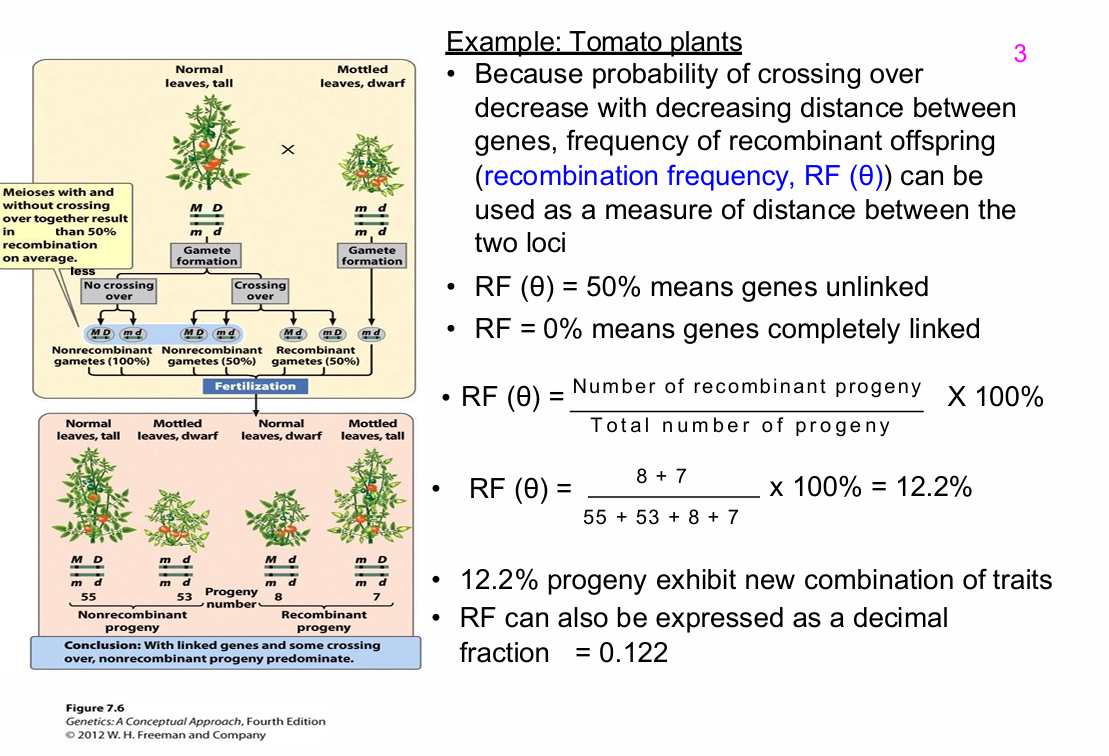
RF = 50% or θ = 0.5 means the loci behave as unlinked.
This can occur when:
- The loci are on different chromosomes
or
- They are far apart on the same chromosome.
What does RF = 0% or θ = 0 mean?
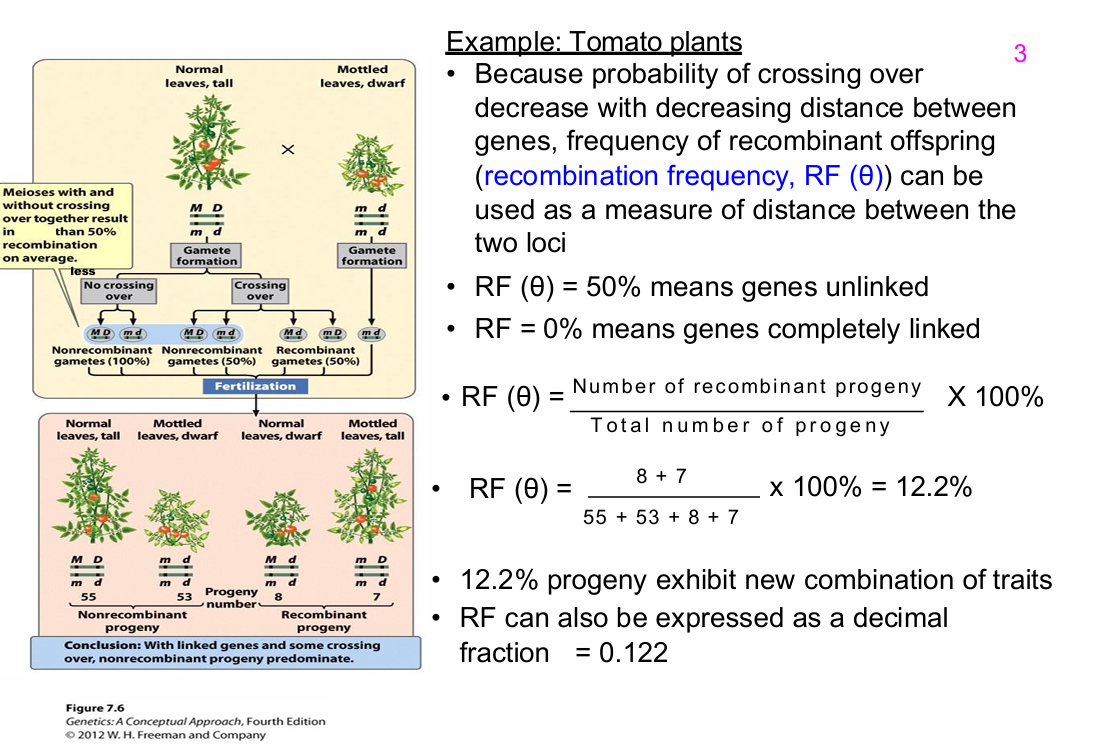
RF = 0% or θ = 0 means complete linkage.
No recombinant progeny are observed between the loci.
How is recombination frequency calculated in the tomato example?
Recombinant progeny:
8 + 7 = 15
Total progeny:
55 + 53 + 8 + 7 = 123
RF = 15/123 × 100%
= 12.2%
Decimal form:
θ = 0.122
What is the main relationship between recombination frequency and linkage?
Recombination frequency is a measure of genetic distance and therefore of the degree of linkage.
Lower RF:
- Loci are closer together.
- Stronger linkage.
Higher RF:
- Loci are farther apart.
- Weaker linkage.
Lecturer emphasis:
The number of recombinant offspring is used as a measure of distance between loci.
.
Key message #1: The number of recombinant offspring produced (recombination frequency) is a measure of the distance between two loci and therefore a measure of the degree of linkage
What is an important limitation of RF = 50%?
If two loci show 50% recombination, you cannot distinguish whether:
- They are on different chromosomes
or
- They are far apart on the same chromosome.
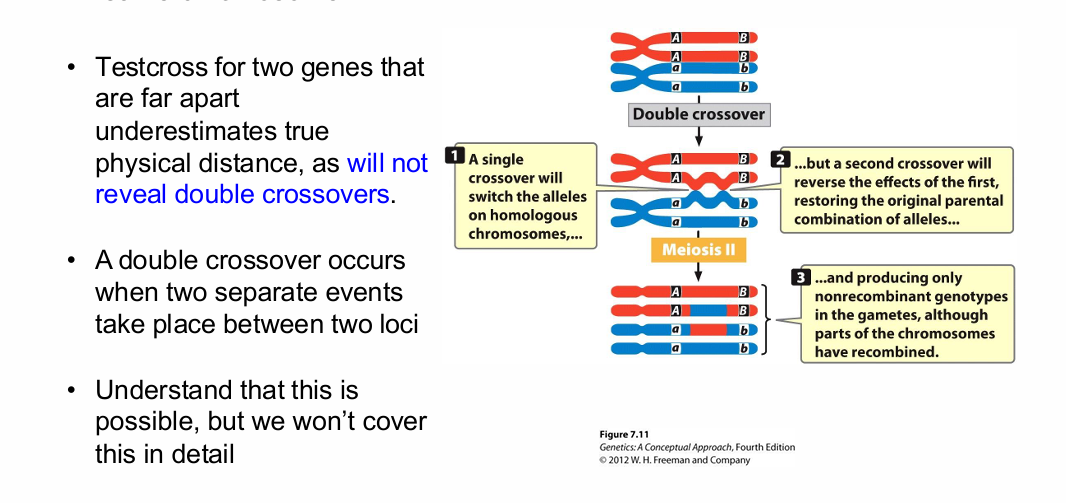
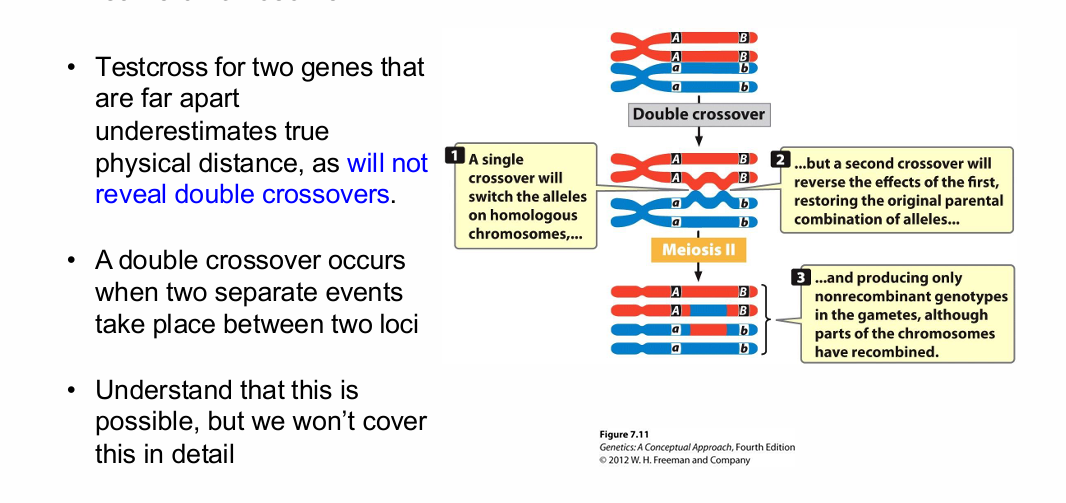
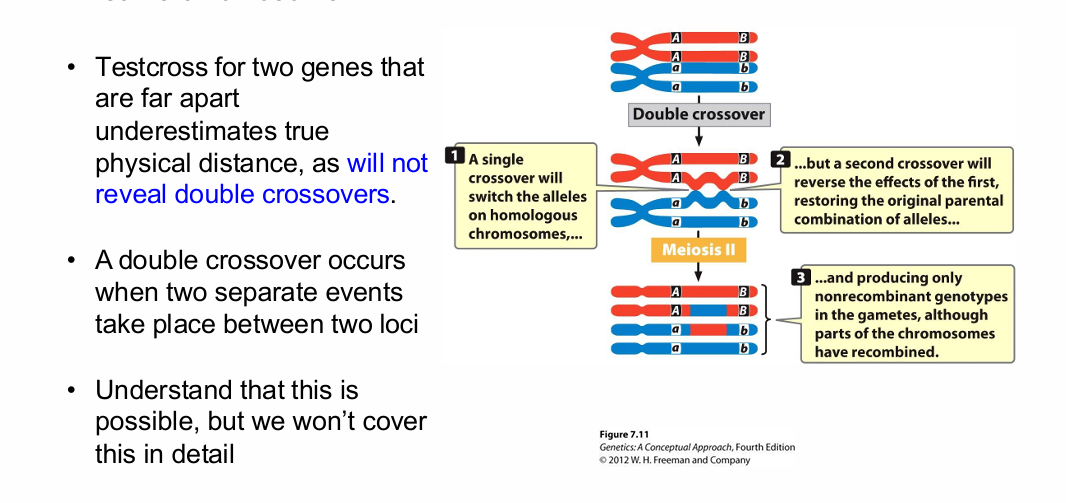
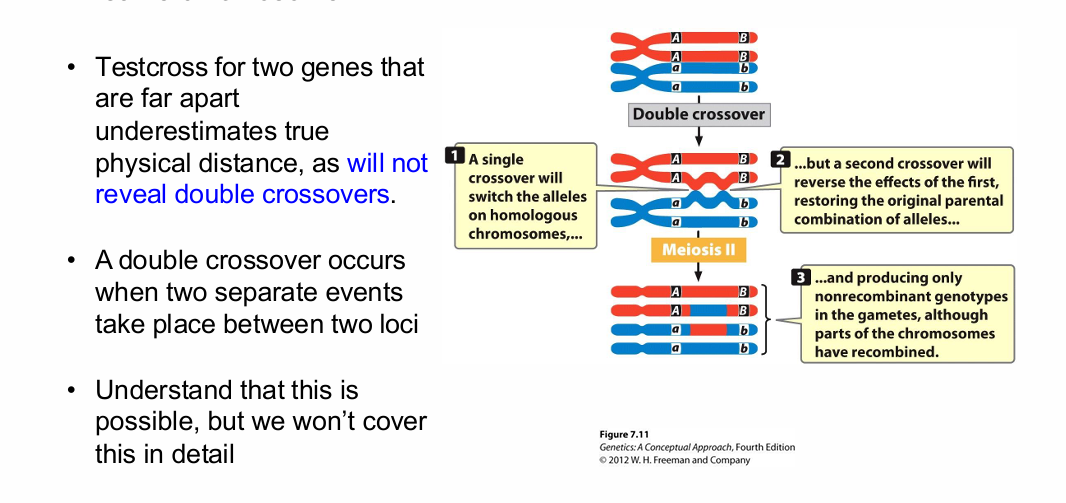
Why can recombination frequency underestimate true physical distance between two loci?
Double crossovers may go undetected.
A double crossover:
- Consists of two crossover events between the same two loci.
- The second crossover can reverse the apparent effect of the first.
.
Therefore:
- The parental allele arrangement may be restored.
- Recombinants are undercounted.
- Physical distance can be underestimated.
.
Lecturer explanation:
Students only needed to understand that this is possible; it was not covered in detail.
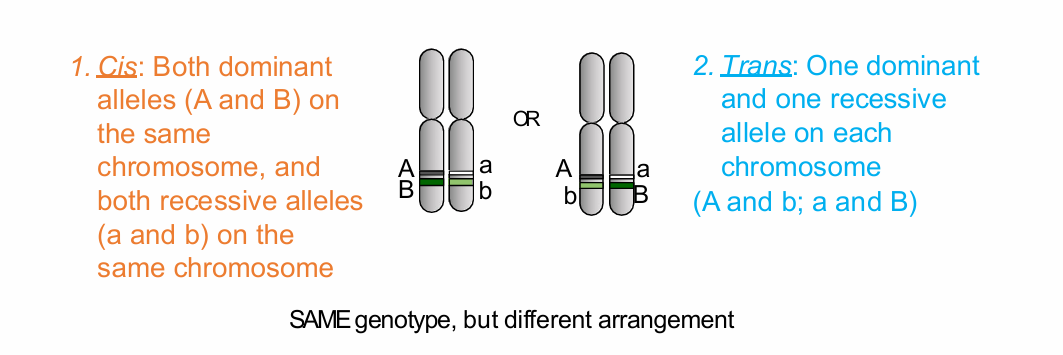
What is cis gene configuration?
Cis configuration places both dominant alleles on one homologous chromosome and both recessive alleles on the other.
Example:
AB/ab
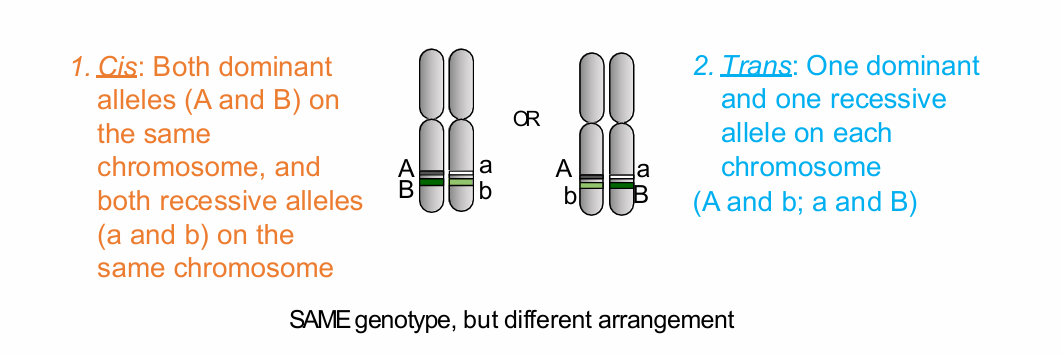
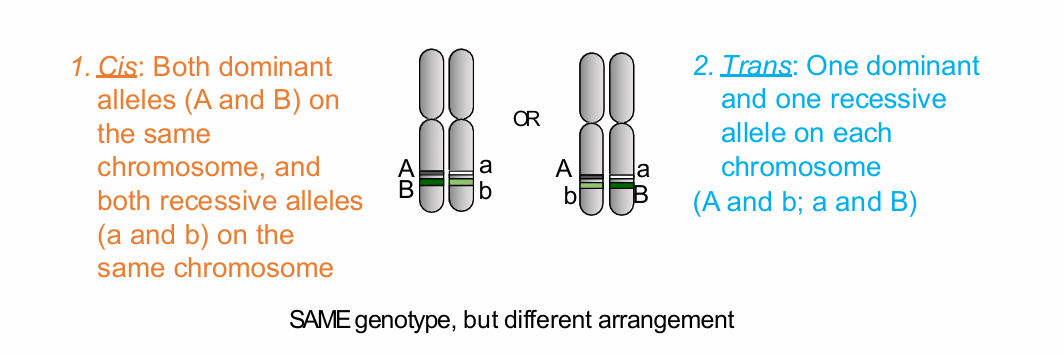
What is trans gene configuration?
Trans configuration places one dominant and one recessive allele on each homologous chromosome.
Example:
Ab/aB
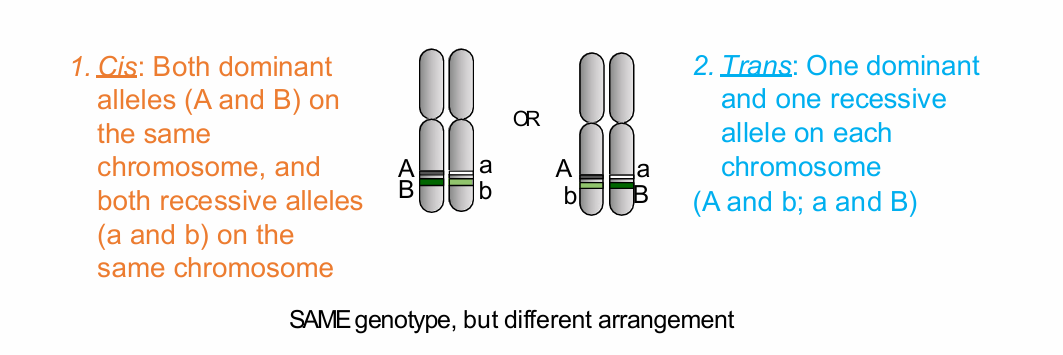
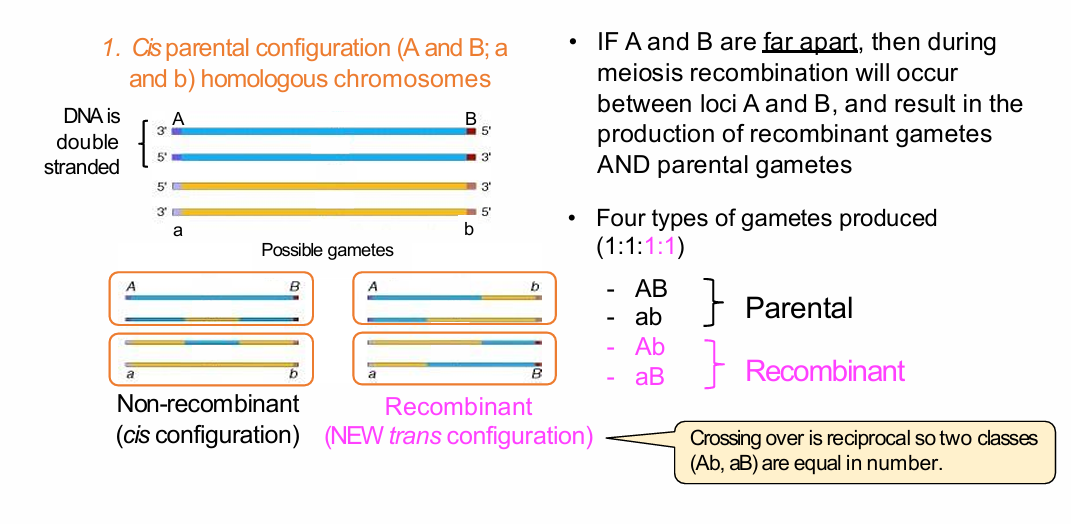
How can two parents have the same genotype but different gene configurations?
Both may be heterozygous:
A/a, B/b
.
But the alleles can be arranged differently on homologous chromosomes:
Cis:
AB/ab
.
Trans:
Ab/aB
.
Same genotype:
- Different chromosomal phase/configuration.
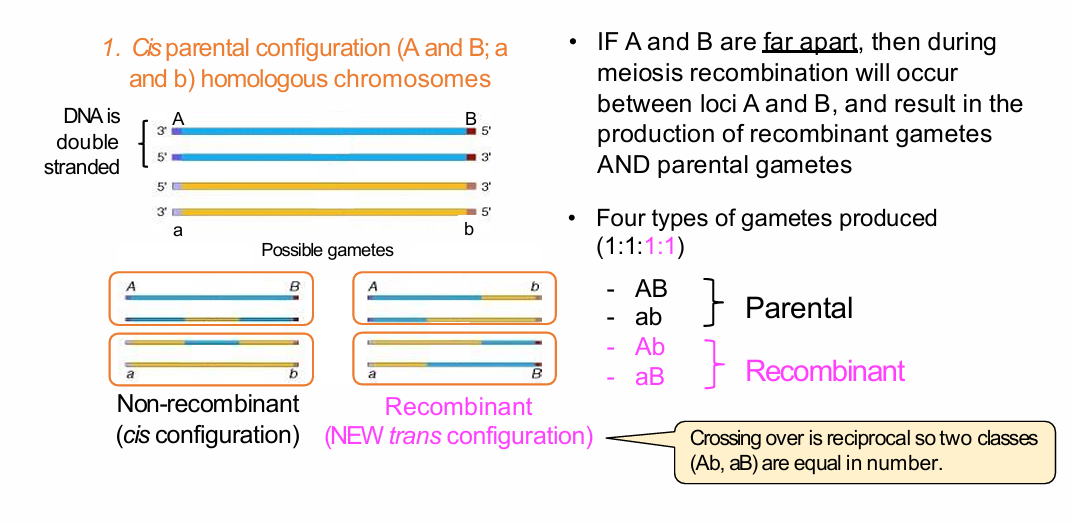
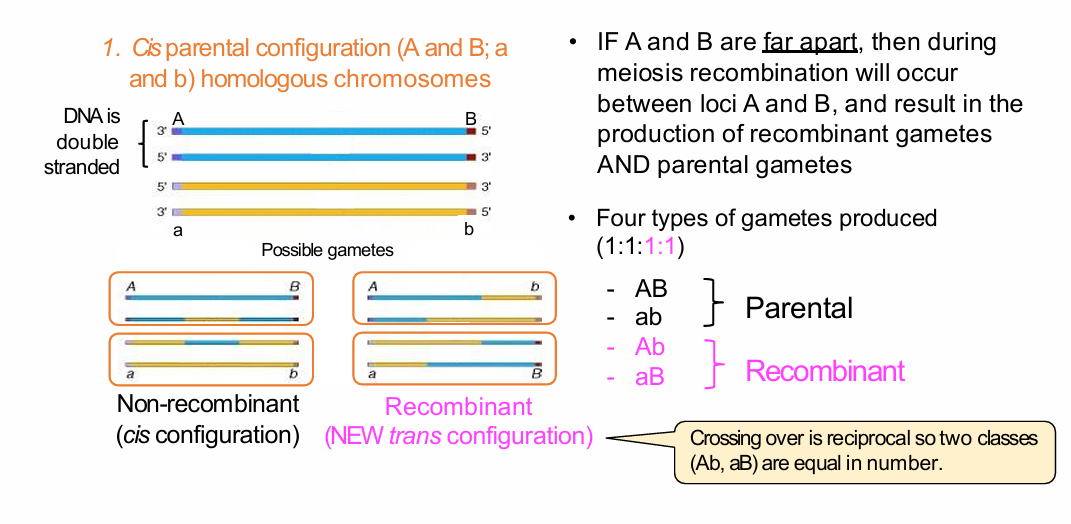
What gametes are produced from a cis-configured AB/ab parent when A and B are far apart and effectively unlinked?
Parental gametes:
- AB
- ab
Recombinant gametes:
- Ab
- aB
If effectively unlinked:
- Four gamete types are produced in approximately 1:1:1:1 proportions.
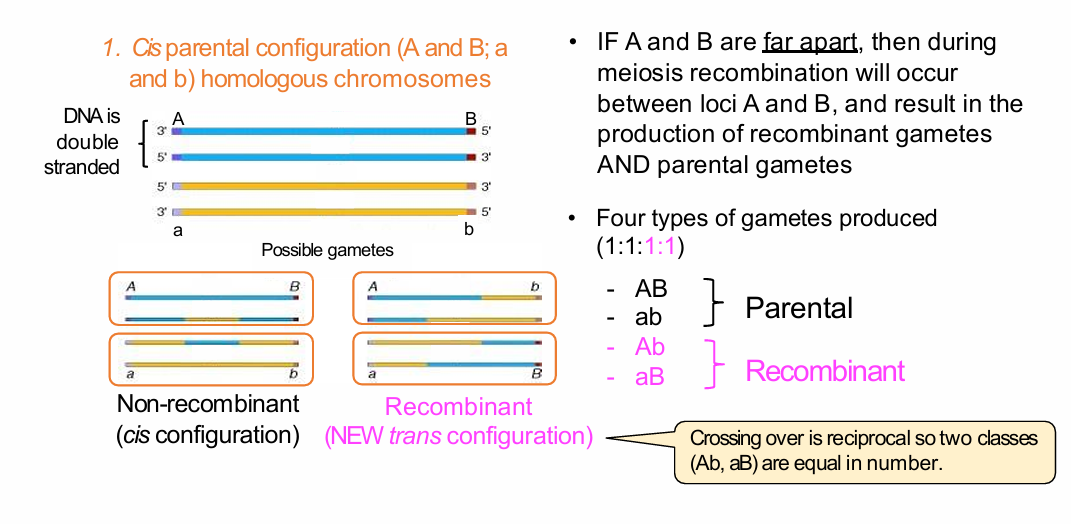
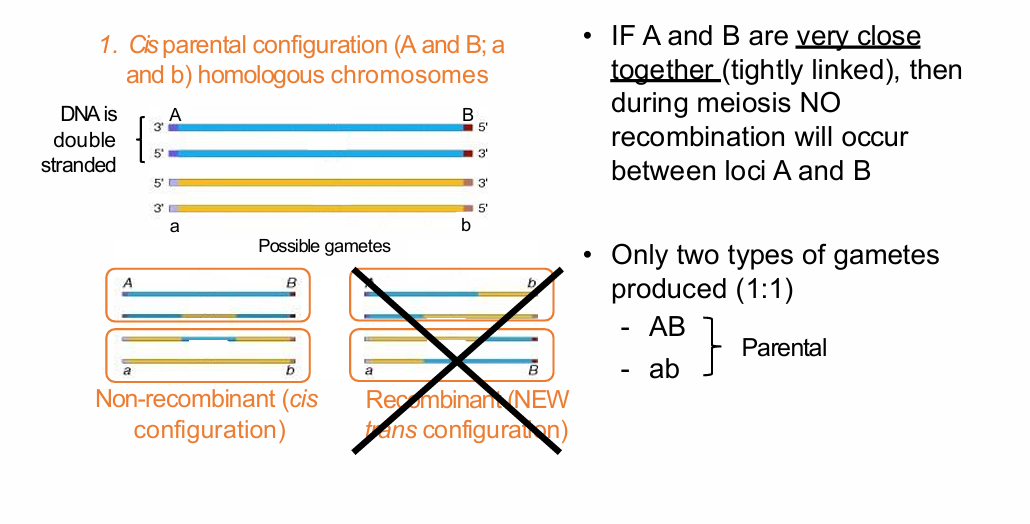
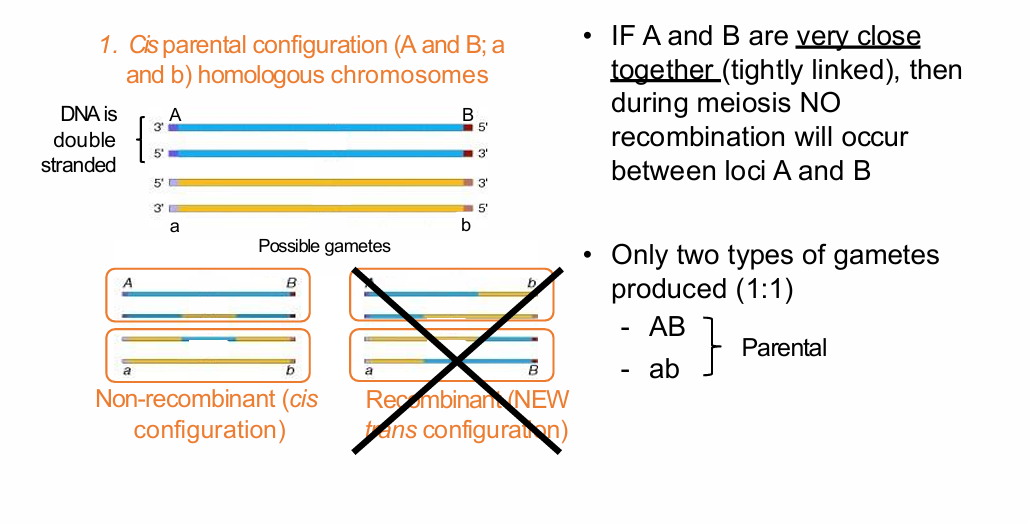
What gametes are produced from a tightly linked cis-configured AB/ab parent if no recombination occurs?
Only parental gametes:
- AB
- ab
.
Ratio:
1:1
No recombinant Ab or aB gametes are produced.
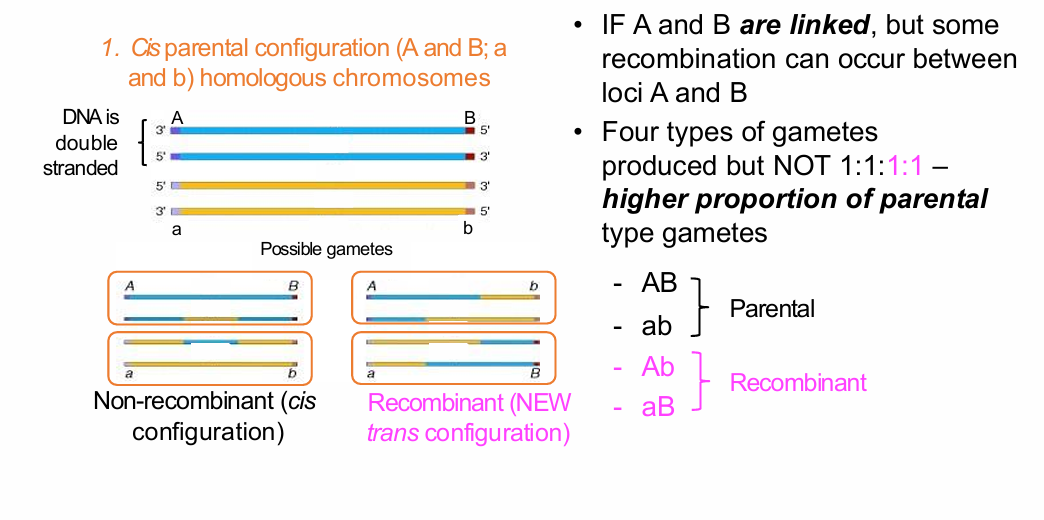
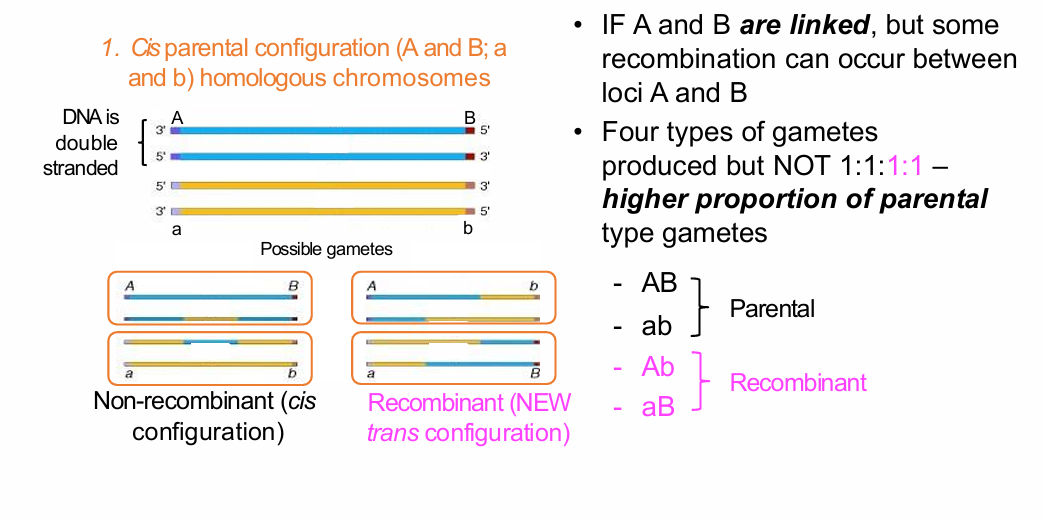
What gamete pattern occurs when cis-configured loci are linked but some recombination occurs?
All four gamete types occur:
- AB
- ab
- Ab
- aB
.
But:
- Parental gametes AB and ab are more common.
- Recombinant gametes Ab and aB are less common.
- The four classes are not in a 1:1:1:1 ratio.
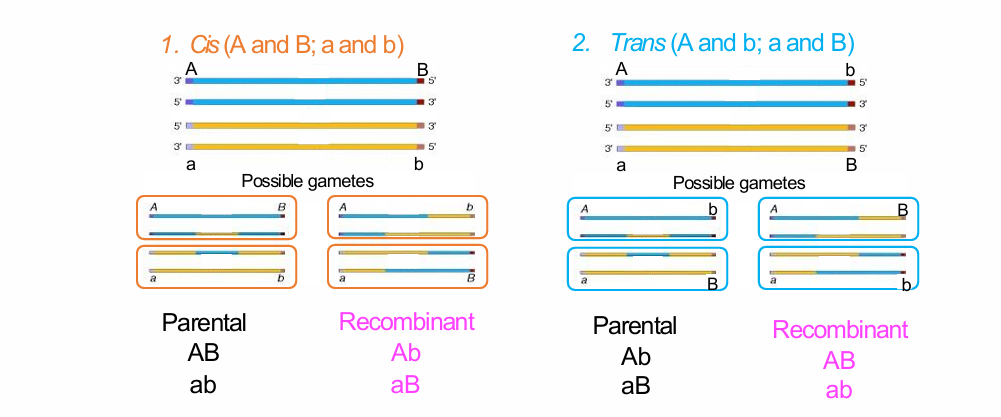
How do cis and trans configurations differ in their parental and recombinant gametes?
Cis:
AB/ab
.
Parental:
- AB
- ab
.
Recombinant:
- Ab
- aB
.
Trans:
Ab/aB
.
Parental:
- Ab
- aB
.
Recombinant:
- AB
- ab
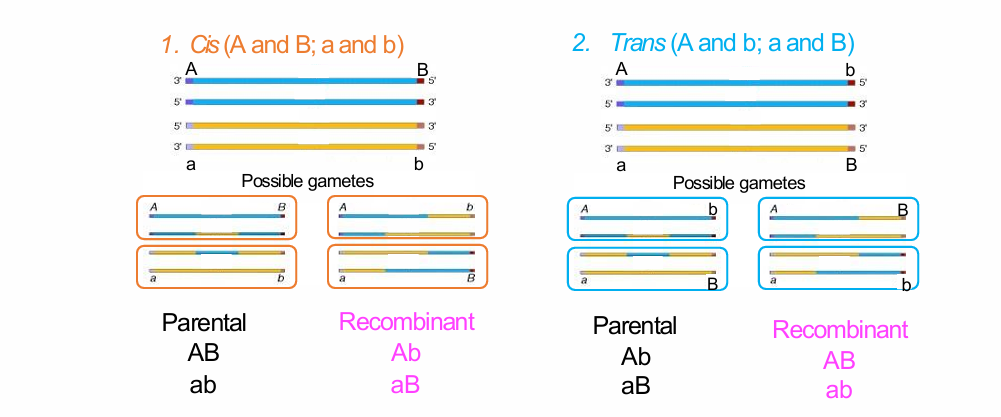
When does cis versus trans configuration affect offspring proportions?
If loci are unlinked:
- Cis and trans produce the same overall gamete proportions.
.
If loci are linked:
- The parental arrangement is overrepresented.
- Therefore, cis and trans produce different common gamete and progeny types.
What is the key message about linked loci and allele configuration?
If two loci are linked, the arrangement of their alleles in cis or trans determines which allele combinations tend to segregate together in gametes.
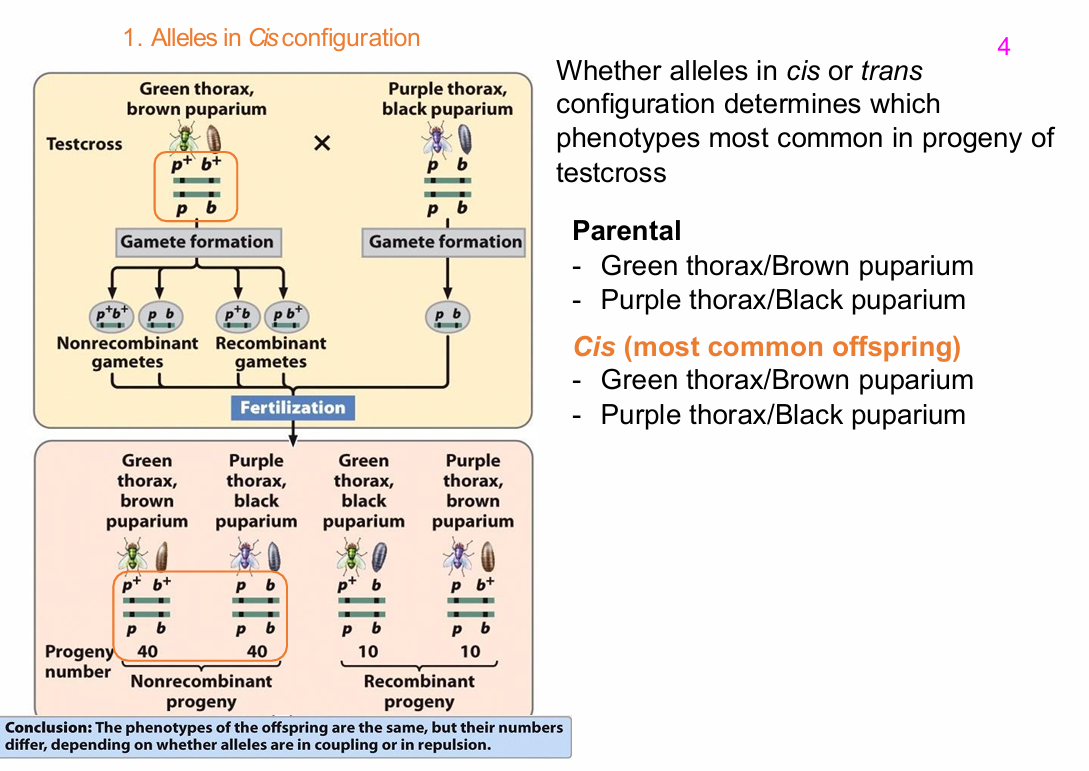
What Drosophila phenotypes were used to illustrate cis and trans configuration?
Thorax colour:
- Green
- Purple
.
Puparium colour:
- Brown
- Black
The lecture used these traits to show how cis versus trans configuration changes the most common offspring phenotypes.
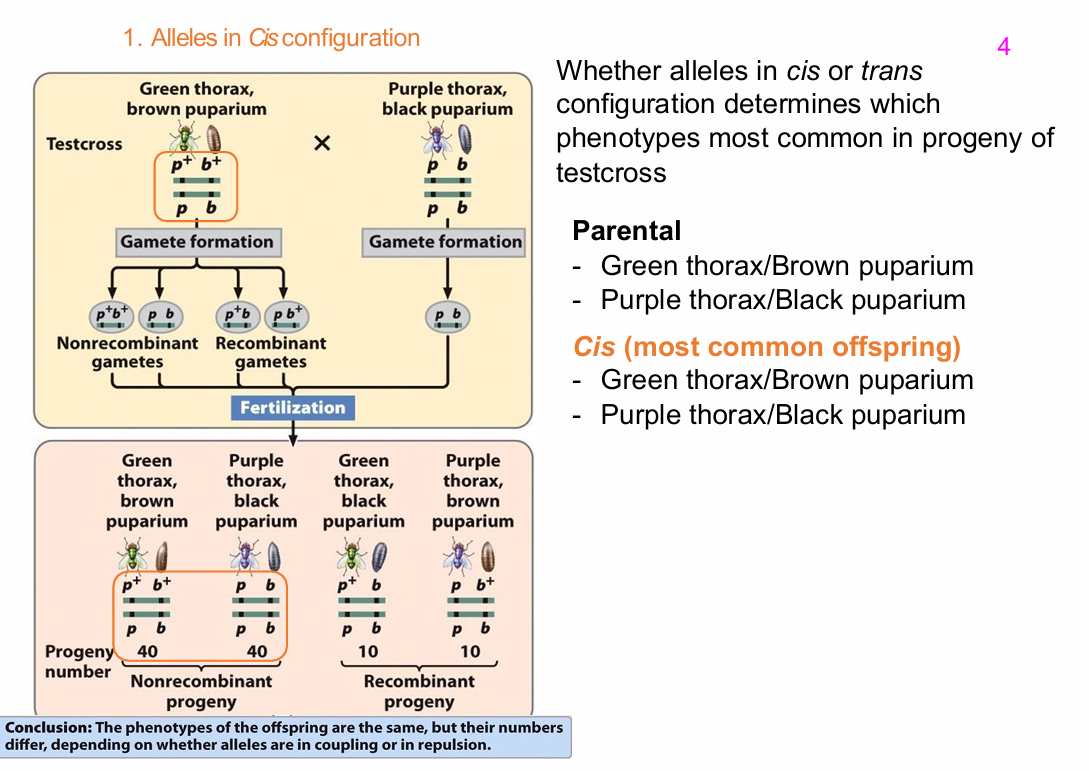
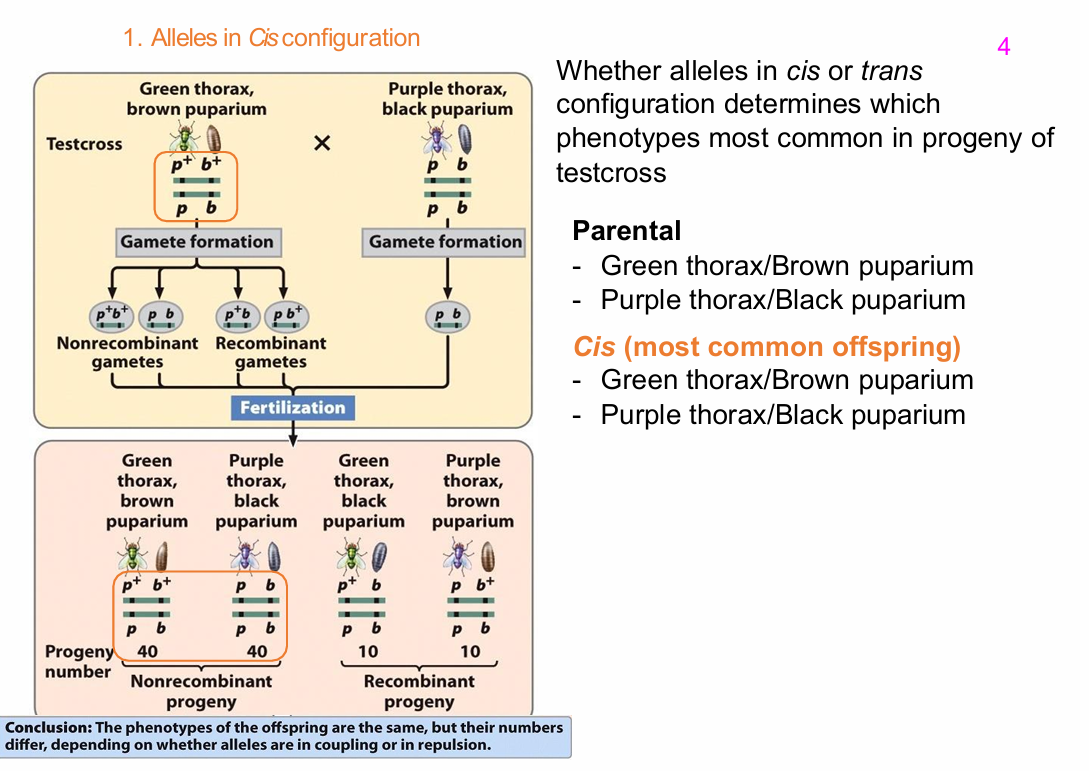
What are the most common offspring from the Drosophila cis testcross?
Most common non-recombinant offspring:
- Green thorax / brown puparium
- Purple thorax / black puparium
These correspond to the parental cis combinations.
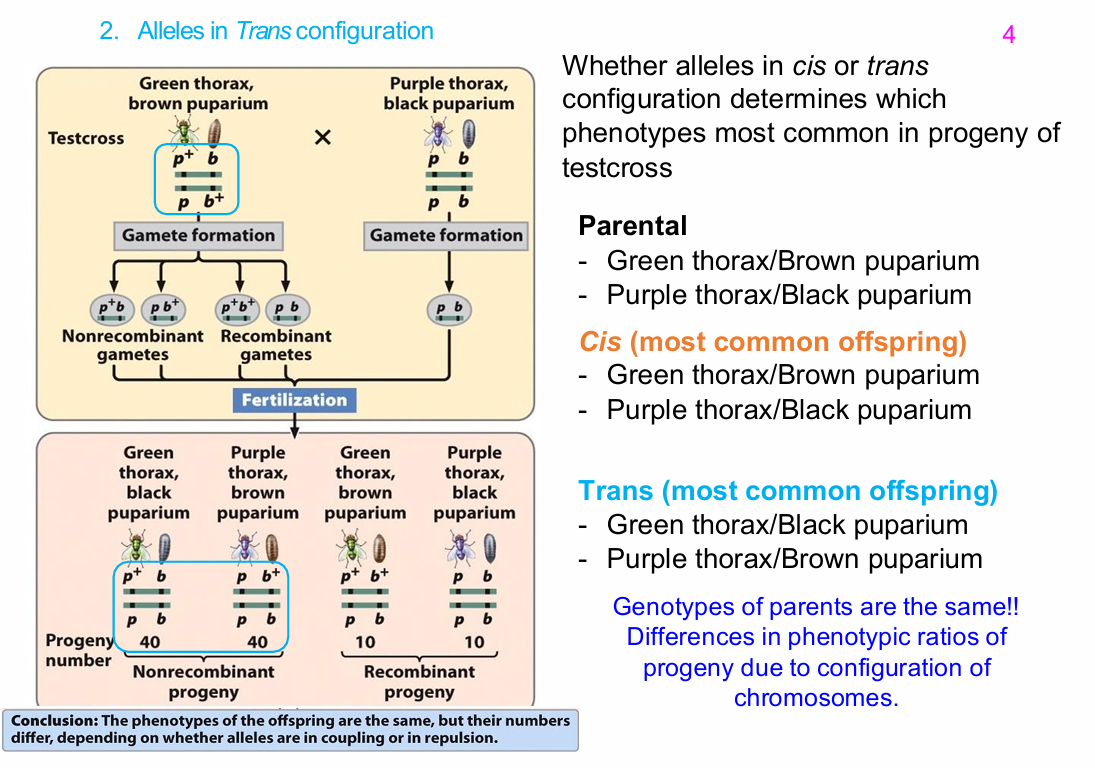
What are the most common offspring from the Drosophila trans testcross?
Most common non-recombinant offspring:
- Green thorax / black puparium
- Purple thorax / brown puparium
The parental genotype is the same as in the cis example, but chromosome configuration differs.
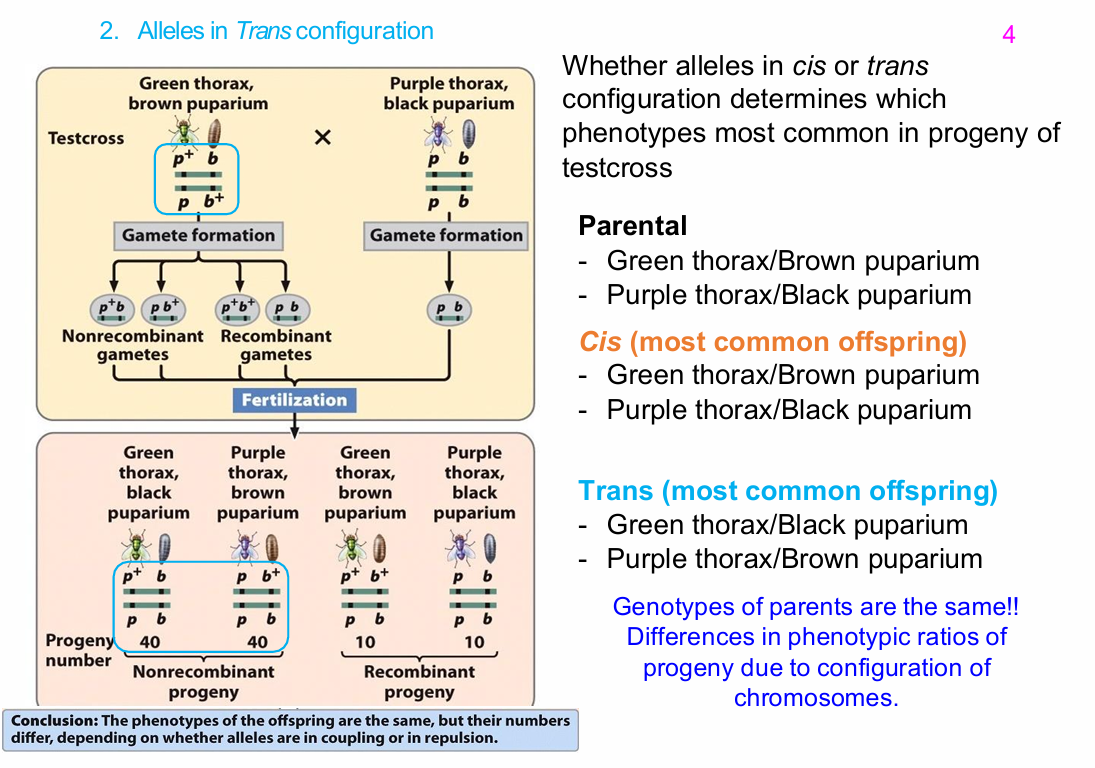
Why do cis and trans testcrosses produce different common phenotypes even when the parental genotype is the same?
Because linked alleles tend to stay in their original chromosomal arrangement.
Therefore:
- Cis preserves cis parental combinations most often.
- Trans preserves trans parental combinations most often.
.
Lecturer emphasis:
The genotype is the same, but the arrangement of alleles on chromosomes changes the phenotypic ratios of progeny.
What is the key relationship between linkage and inheritance as a genetic block?
The closer two loci are:
- The lower the chance they are separated by recombination.
- The more likely the parental alleles are inherited together as one block of genetic information.
What is linkage mapping?
Linkage mapping is the analysis of genetic linkage within pedigrees to identify the chromosomal region containing a disease gene.
What is the basic logic behind using linkage to find disease genes?
If a disease phenotype repeatedly co-segregates with a known gene or genetic marker:
- The disease-causing gene is likely to be physically close to that marker on the same chromosome.
Lecturer explanation:
This was described as a form of "guilt by association".
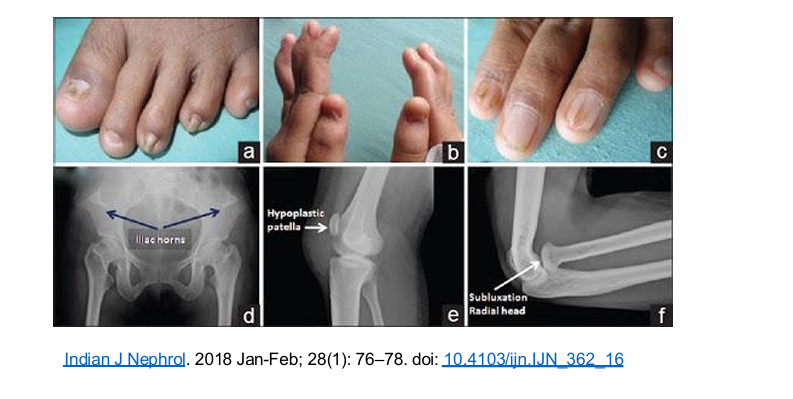
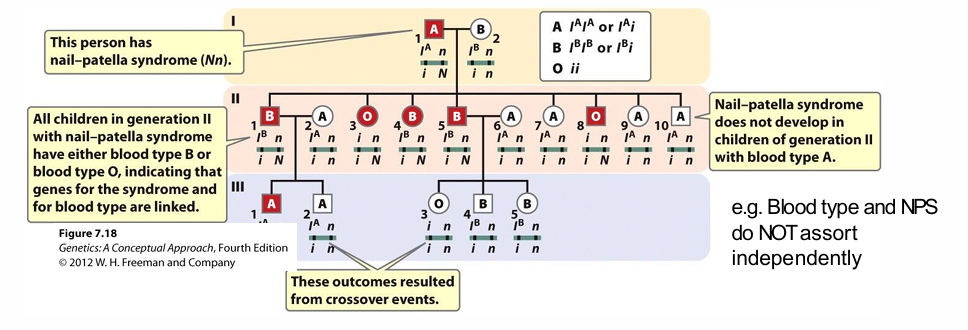
What is nail-patella syndrome, NPS?
Nail-patella syndrome is a rare, dominantly inherited disorder characterised by abnormalities of:
- Nails
- Knees
- Elbows
- Pelvis
.
It is also associated with:
- Early glaucoma
- Kidney failure
How was the NPS locus historically mapped?
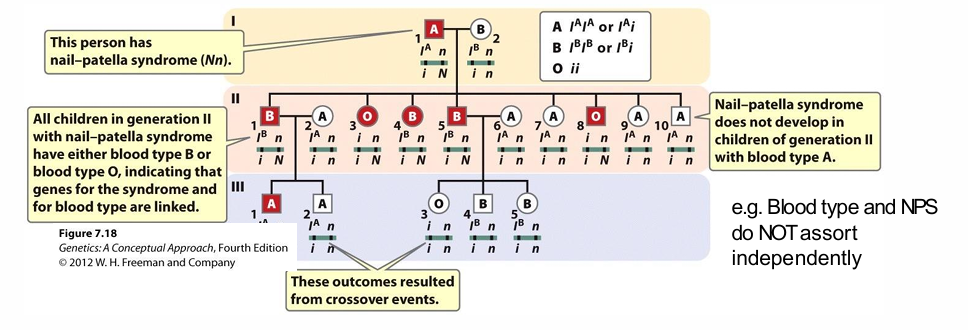
The NPS locus was identified by linkage with blood type.
.
Because blood type and NPS did not assort independently:
- The NPS gene was inferred to lie near the ABO locus.
Why are affected individuals with NPS usually assumed to be heterozygous in linkage studies?
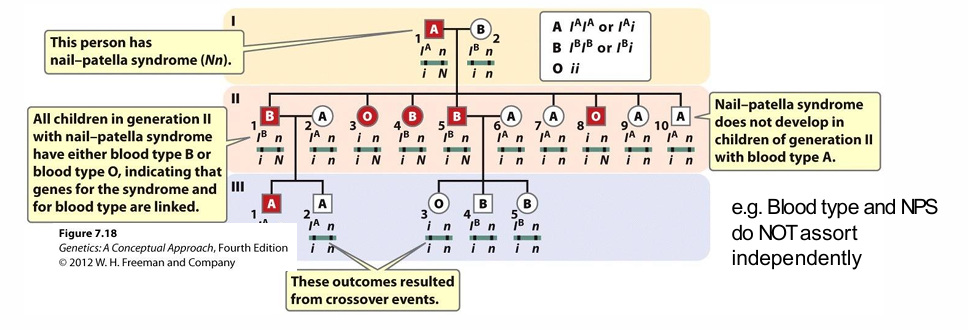
NPS is:
- Dominant
- Rare
.
Therefore affected individuals are generally assumed to have genotype:
Nn
What would be expected if blood type and NPS were inherited independently?
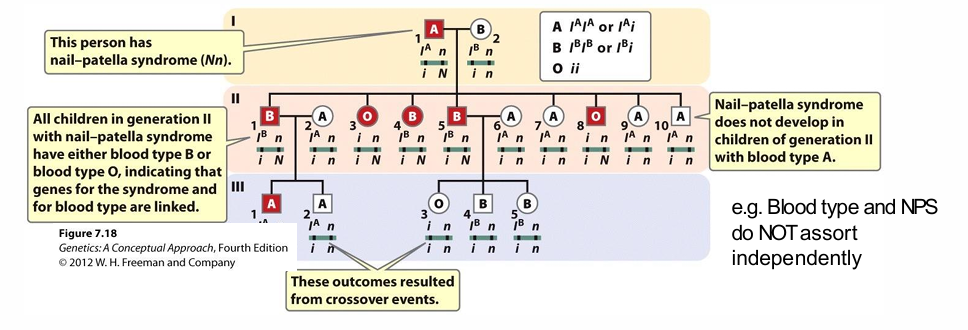
All blood-group combinations should appear among affected individuals.
.
If instead particular blood-type alleles repeatedly co-segregate with NPS:
- This suggests linkage.
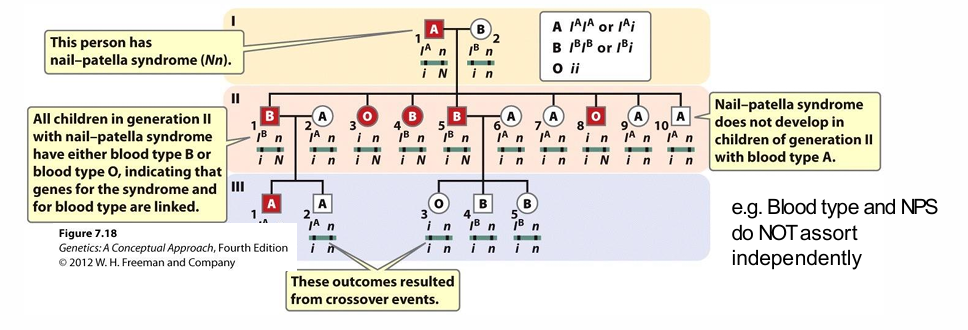
What did the NPS pedigree indicate about linkage with ABO?
In the pedigree:
- Affected individuals did not show random blood-type association.
- NPS co-segregated with particular ABO alleles.
- This suggested that the NPS locus was close to ABO on chromosome 9.
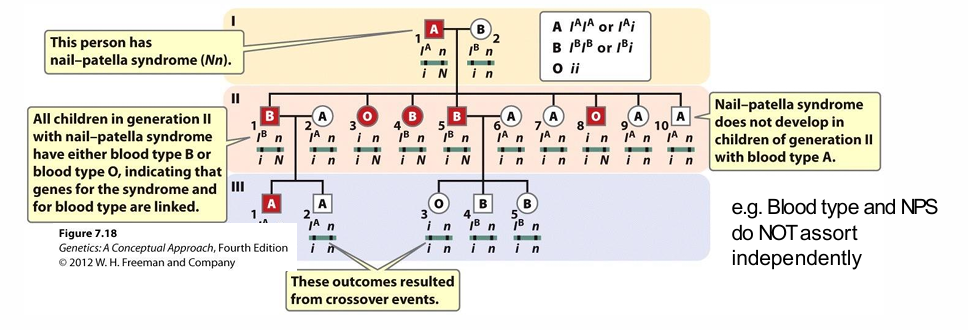
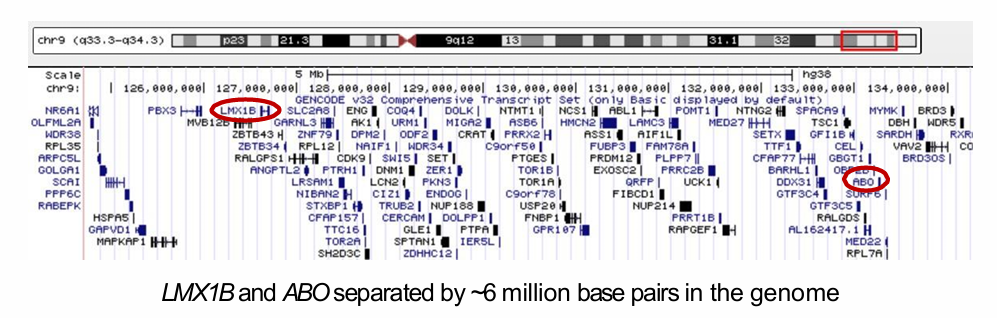
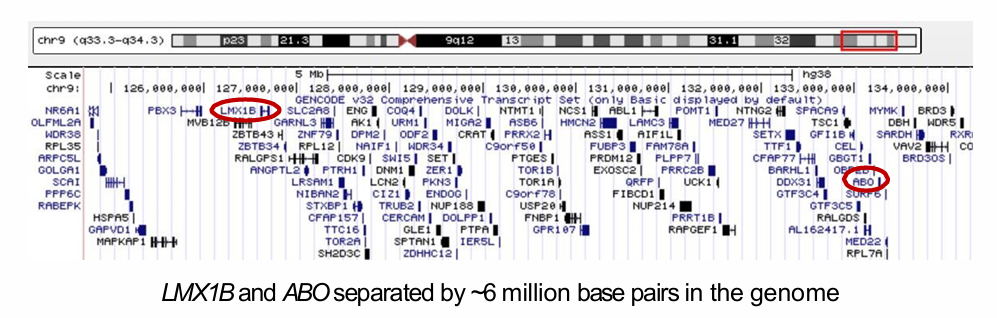
Where are ABO and the NPS gene LMX1B located?
ABO:
- Chromosome 9
- 9q34.2
.
LMX1B:
- Chromosome 9
- 9q33.3
.
Distance:
- Approximately 6 million base pairs apart
What does LMX1B encode, and why is this relevant to NPS?
LMX1B encodes a transcription factor.
.
It is especially important in early embryonic development of:
- Limbs
- Kidneys
- Eyes
These tissues are affected in nail-patella syndrome.
What limitation of phenotype-based linkage mapping is illustrated by the NPS example?
Even after linkage to ABO was established:
- The actual disease gene was still ~6 million base pairs away.
- Many genes lay within that interval.
Therefore:
Phenotype-based linkage could localise a region but still leave a large number of candidate genes.
Why did molecular genetic markers improve linkage mapping?
Historically, linkage mapping relied on observable phenotypes.
.
Molecular markers improved it because they:
- Are present regardless of whether a phenotype is expressed.
- Can be typed directly (e.g PCR, microarray or sequencing)
- Allow many genome positions to be analysed.
- Improve power and usefulness.
What are the advantages of DNA markers over phenotypic traits in linkage mapping?
DNA markers:
- Are present from birth.
- Do not require waiting for disease onset.
- Can distinguish homozygous from heterozygous individuals.
- Can be typed rapidly by PCR, microarray or sequencing.
- Can be distributed throughout the genome.
- Can be highly polymorphic and therefore informative.
Why are highly polymorphic markers especially informative in linkage studies?
Highly polymorphic markers:
- Have multiple common alleles.
- Are more likely to be heterozygous.
- Make it easier to determine which parental allele was transmitted.
.
Examples:
- Microsatellites are multiallelic.
- SNVs/SNPs are usually biallelic.
What is a genetic marker?
A genetic marker is a polymorphic DNA sequence that can be genotyped and tracked through a pedigree.
Examples:
- Microsatellites
- SNPs
Useful markers are often highly variable between individuals.
What is the key message about molecular markers in linkage mapping?
Molecular markers are polymorphic DNA sequences spread throughout the genome that can be typed and followed through pedigrees to track inheritance.
How is co-segregation of markers used to localise a disease gene?
1. Type many polymorphic markers across the genome.
2. Track which marker alleles are inherited with the disease phenotype.
3. Identify marker alleles consistently present in affected individuals and absent from unaffected individuals.
4. Infer that the disease gene lies near the consistently co-segregating marker.
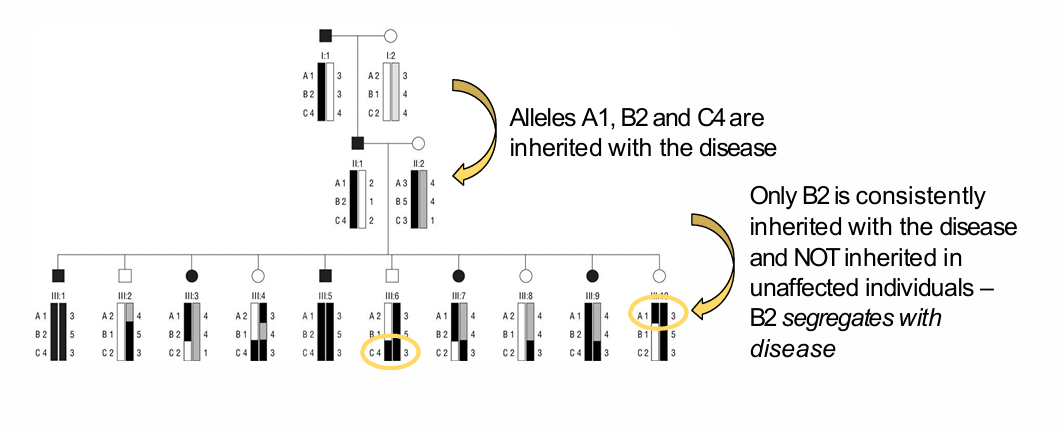
What did the A1, B2 and C4 pedigree example demonstrate?
Initially:
- A1, B2 and C4 appeared with disease.
.
Across the larger family:
- Only B2 remained consistently inherited with disease.
- B2 was not inherited by unaffected individuals.
.
Therefore:
- B2 segregates with the disease.
- B2 is likely near the disease-causing locus.
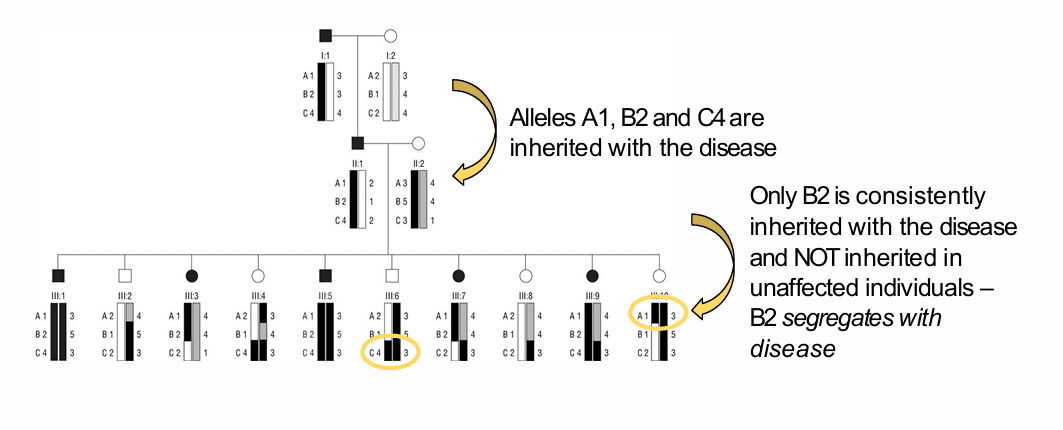
Why do large families improve linkage mapping?
More offspring provide:
- More meioses
- More recombination events
- More opportunities to separate nearby marker alleles
This helps distinguish which marker is truly closest to the disease gene.
Lecturer explanation:
The toy pedigree worked well largely because there were many family members.
What is the key message about marker co-segregation?
Exclusive co-segregation of a marker allele with disease through a pedigree implies that the marker lies in the same chromosomal region as the disease-causing gene or variant.
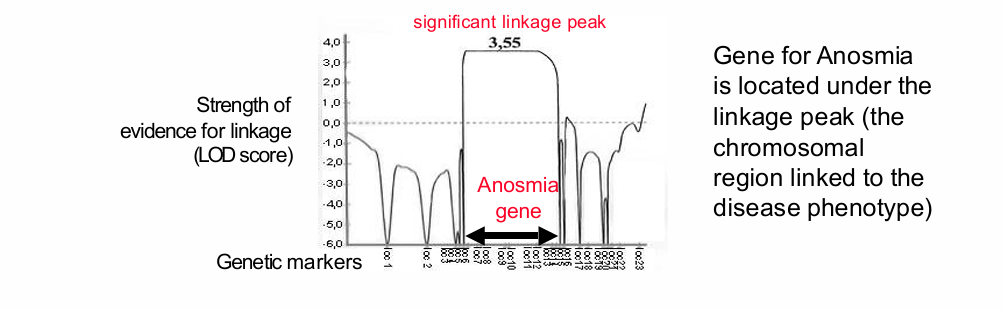
What is multipoint linkage mapping?
Multipoint linkage mapping analyses many genetic markers simultaneously rather than one marker at a time.
Purpose:
- Refine the linked genomic region
- Narrow the interval likely to contain the disease gene
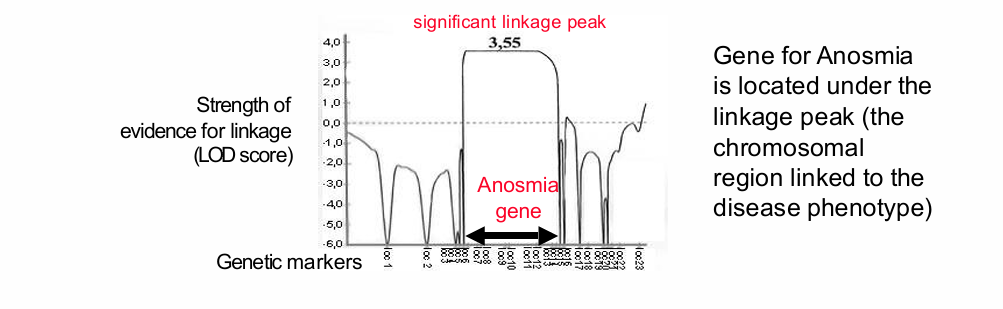
How did marker density affect linkage-map resolution historically?
Historically:
- As few as ~50 markers could identify linkage.
- Resulting linkage regions could be up to ~40 million base pairs.
.
Using thousands of markers:
- Narrows the linked region.
- Improves localisation of the disease gene.
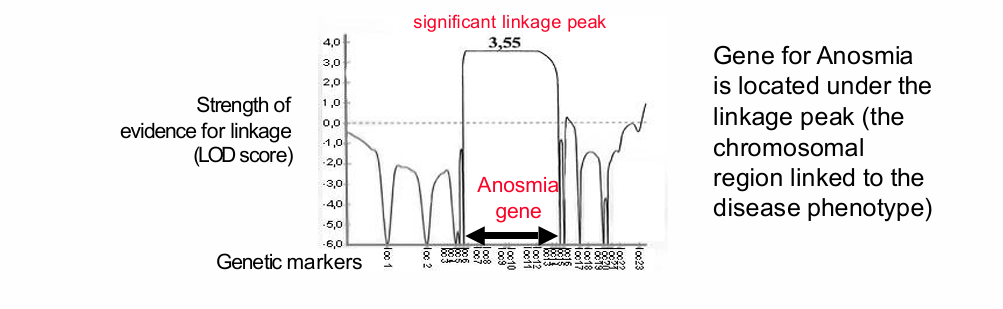
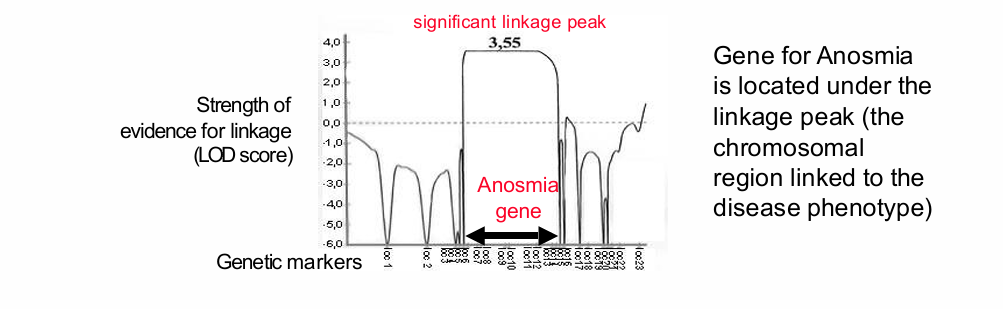
What should you identify in the multipoint linkage-mapping graph?
- Genetic markers along the genomic region
- LOD score on the vertical axis as strength of evidence for linkage
- A significant linkage peak
- The disease gene, in the example an anosmia gene, located beneath the linkage peak
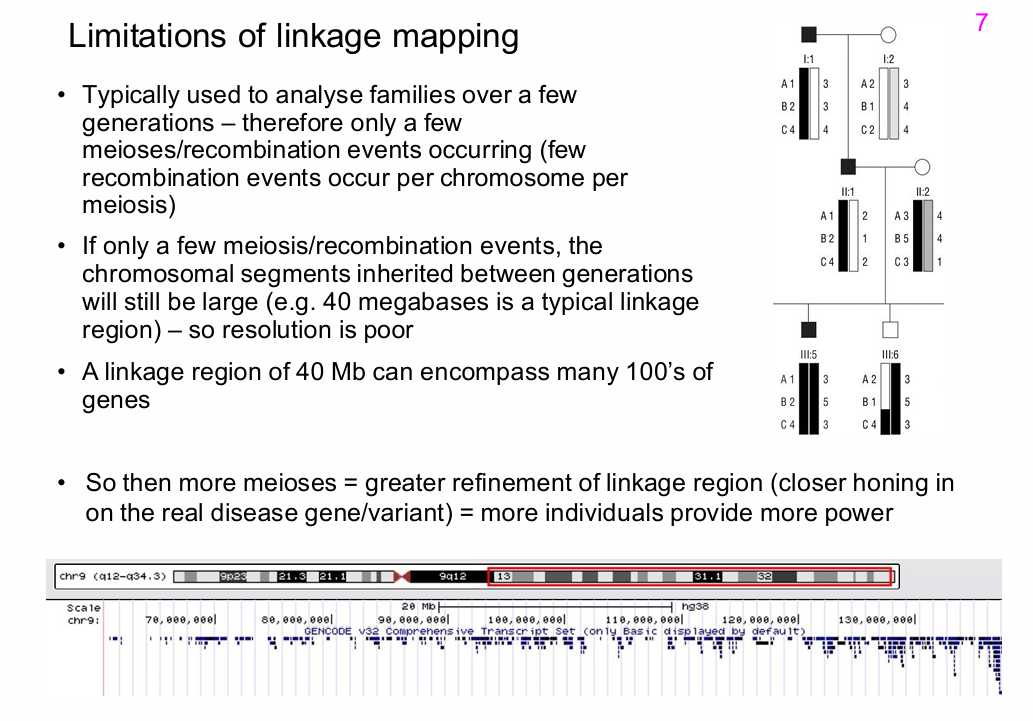
Why is the number of markers not the only factor determining linkage-map resolution?
Resolution also depends on the number of informative meioses/recombination events.
If few recombination events occur:
- Large chromosome segments remain inherited together.
- Even dense marker typing cannot fully resolve the disease locus.
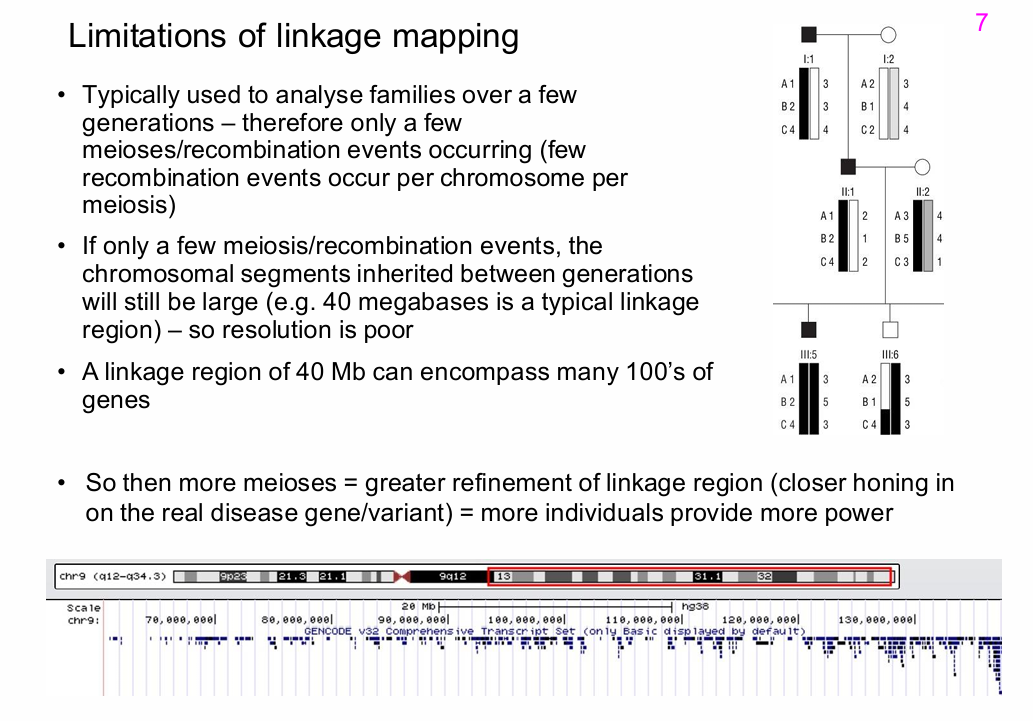
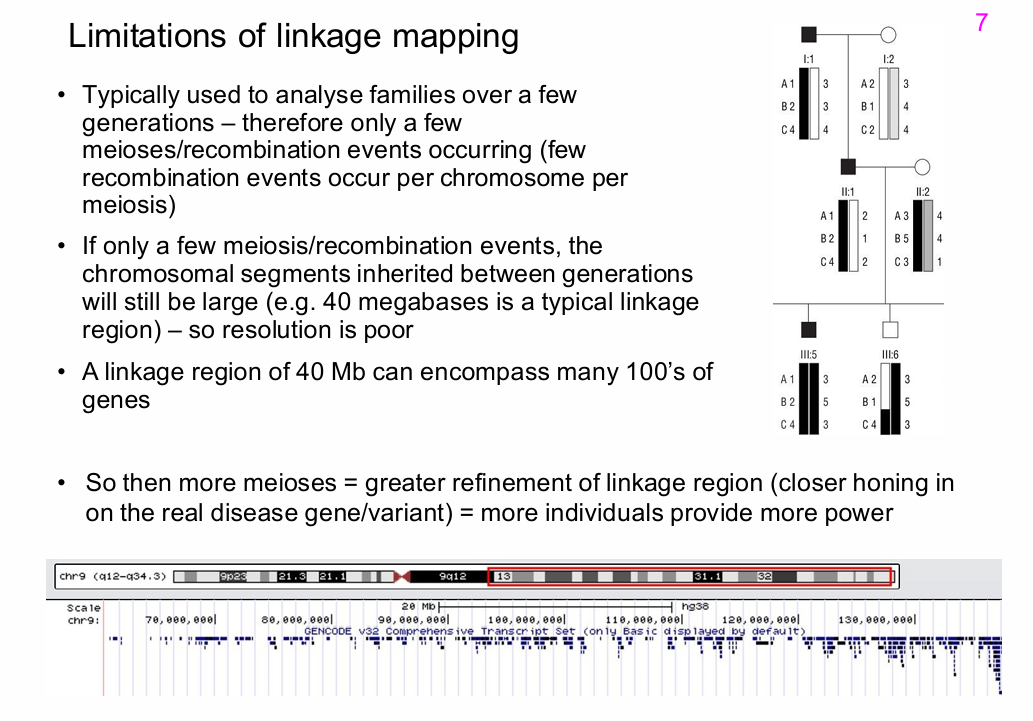
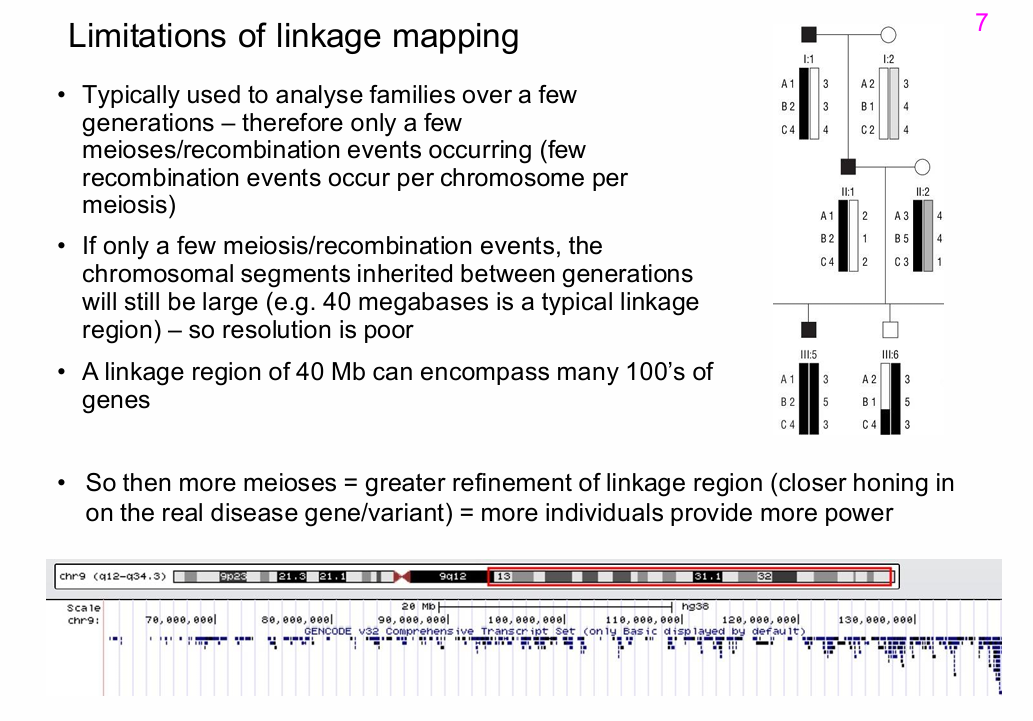
Why is linkage mapping often low-resolution in human families?
Human linkage studies often involve:
- Few generations
- Few offspring
- Few recombination events per chromosome per meiosis
Therefore:
- Inherited chromosome segments remain large.
- Typical linkage regions may be ~40 Mb.
- A 40 Mb region can contain hundreds of genes.
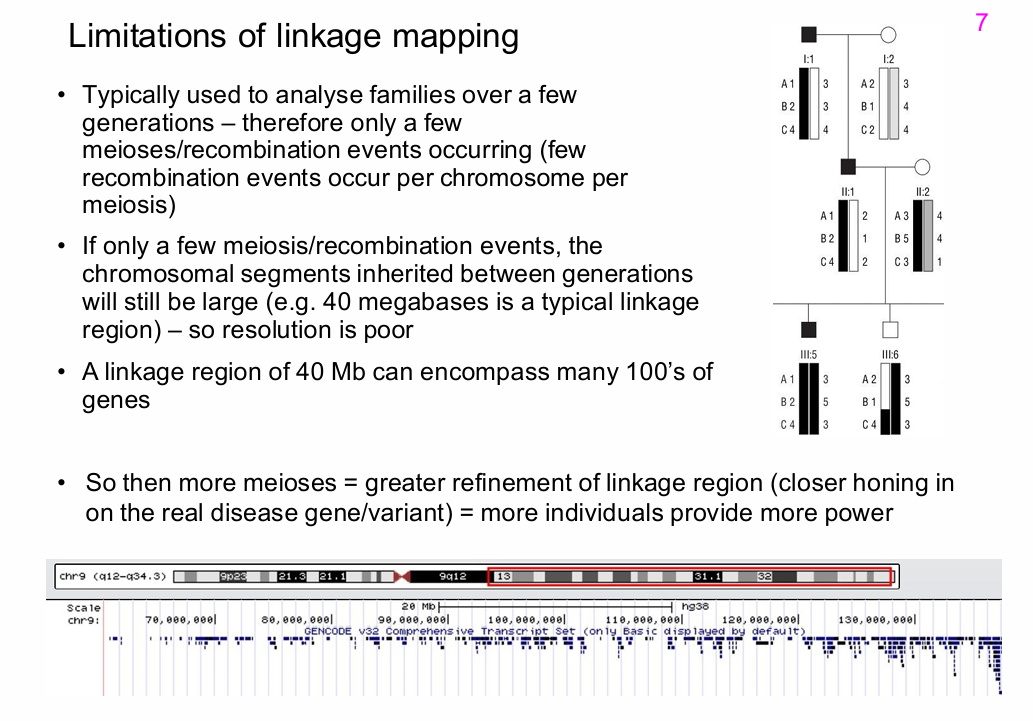
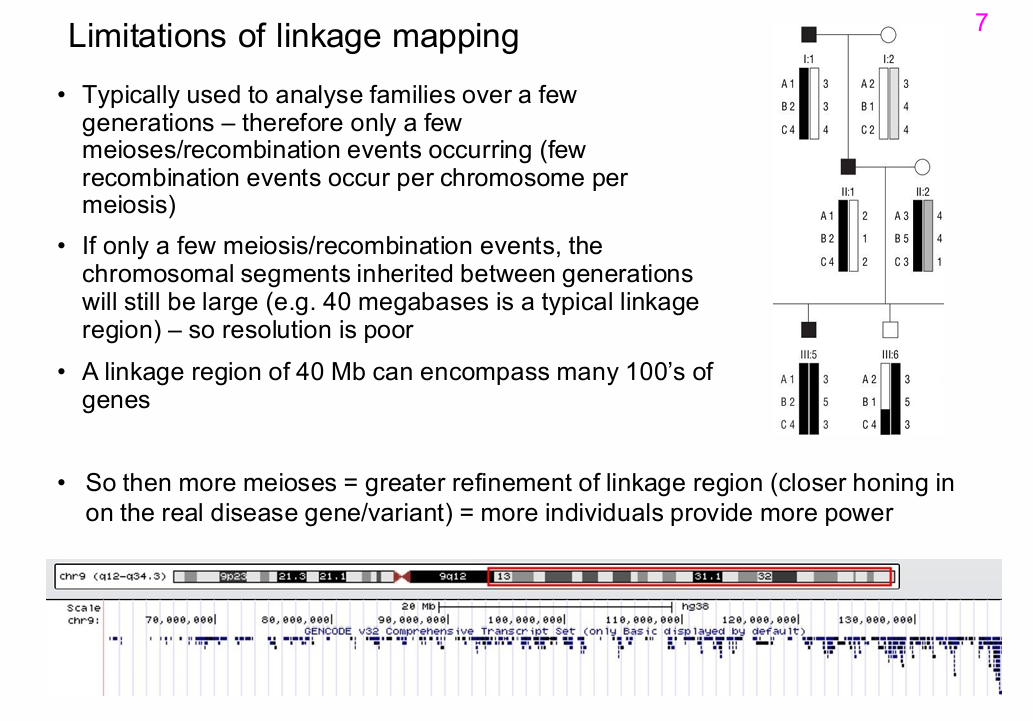
How does increasing the number of meioses improve linkage mapping?
More meioses create more recombination breakpoints.
This allows:
- Greater refinement of the linked interval
- Better localisation of the disease gene
- Greater statistical power
More individuals therefore generally improve mapping resolution.
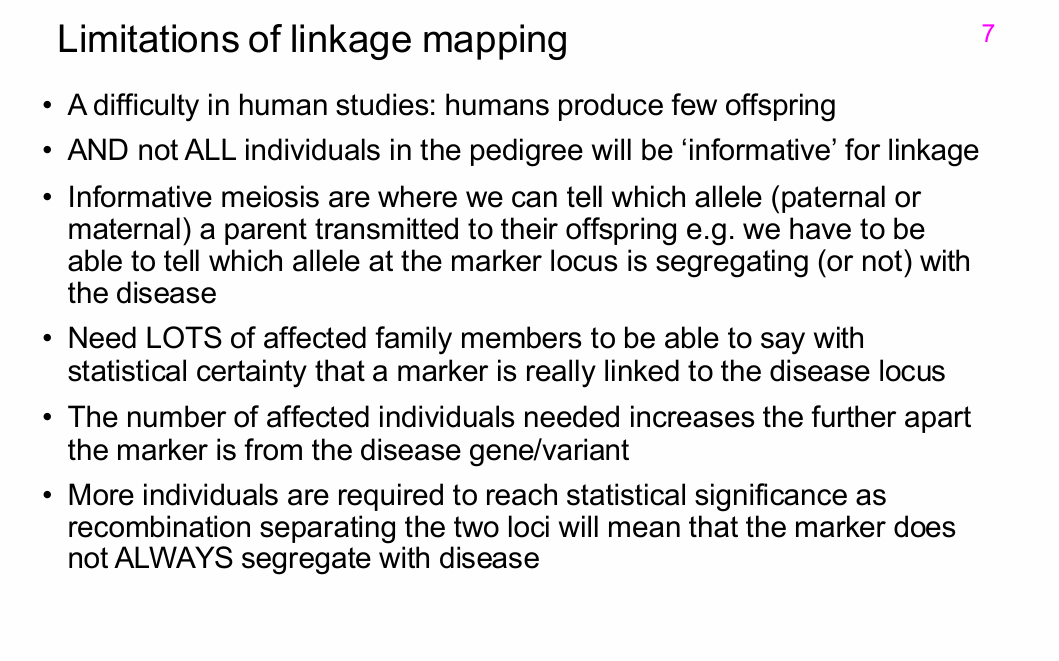
What is an informative meiosis in linkage analysis?
An informative meiosis is one in which it is possible to determine which marker allele, paternal or maternal, was transmitted to an offspring.
This allows researchers to assess whether a marker allele segregated with the disease.
Why are not all family members informative for linkage?
If marker alleles or parental origin cannot be distinguished:
- It may be impossible to determine which allele was transmitted.
- That meiosis provides little or no information about co-segregation with disease.
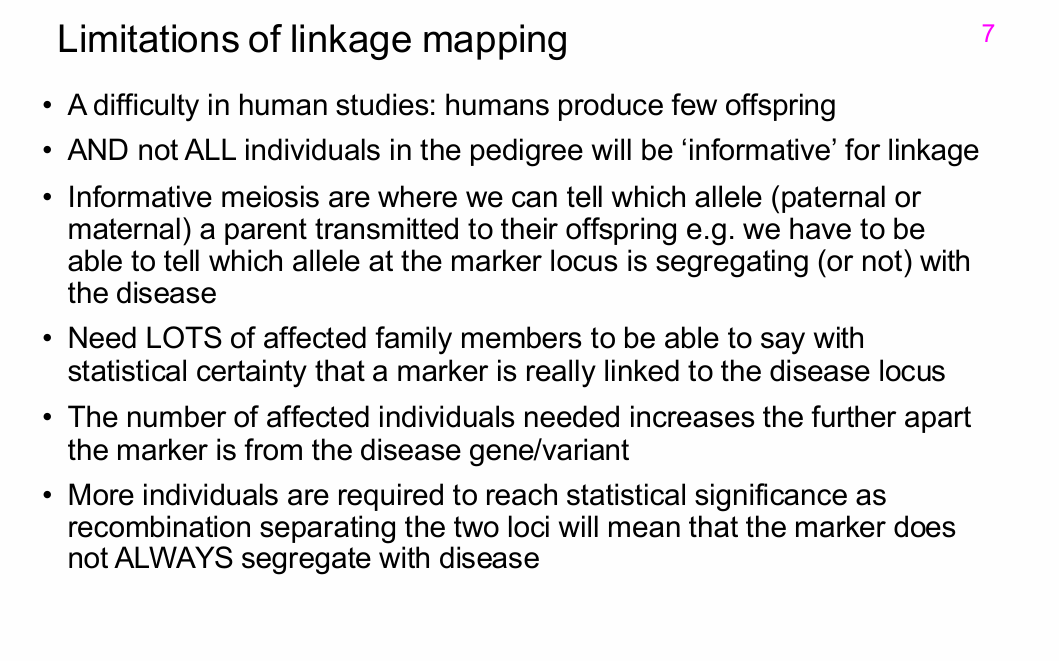
Why are many affected family members often required for statistically convincing linkage?
More affected individuals provide:
- More informative meioses
- More opportunities to observe co-segregation
- More power to distinguish true linkage from chance
.
The farther a marker is from the disease locus:
- The more recombination can separate them.
- The more individuals are needed to establish linkage.
What is a LOD score, Z?
LOD stands for logarithm of odds.
A LOD score is a statistic that measures the strength of evidence that two loci are linked given the available family data.
What question does a LOD score ask?
It compares:
Likelihood that two loci are linked
versus
Likelihood that the loci are unlinked
It asks whether observed co-segregation is better explained by true linkage or by chance.
How is recombination fraction θ interpreted in LOD-score analysis?
θ = 0:
- Complete linkage
.
θ = 0.5:
- No linkage
.
Intermediate θ:
- Partial linkage
- Lower θ generally means closer loci
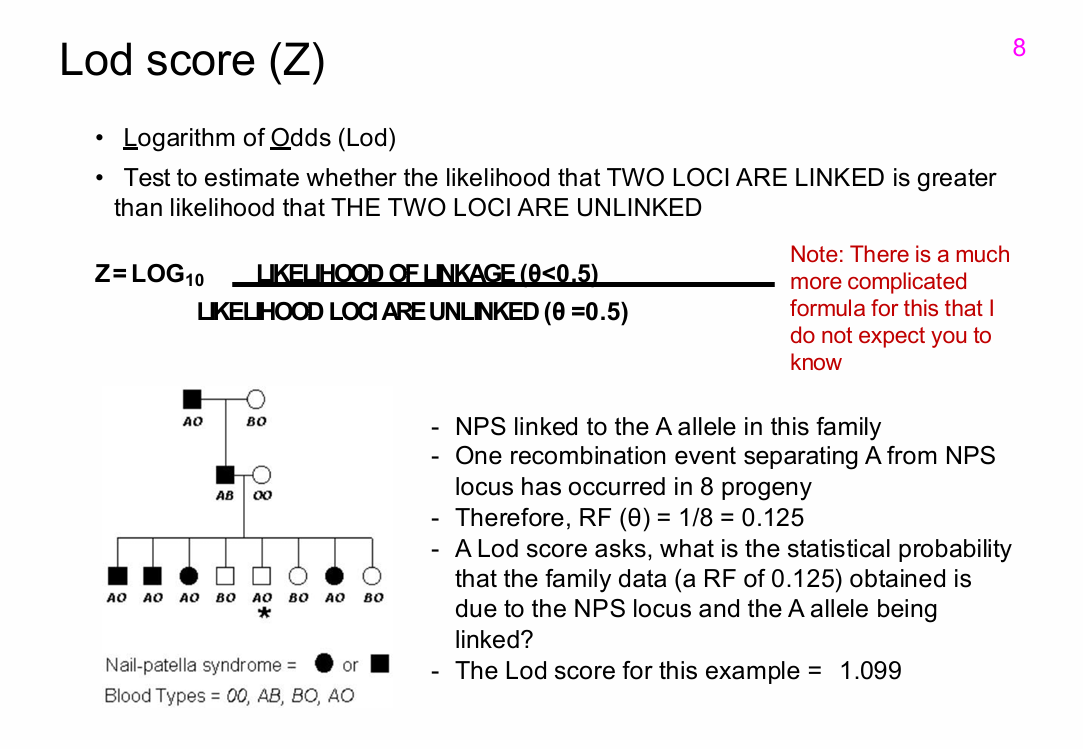
What simplified LOD-score relationship was shown?
Z = log₁₀ [Likelihood of linkage at θ < 0.5 ÷ Likelihood loci are unlinked at θ = 0.5]
Lecturer explanation:
The full calculation is more complicated and was not expected to be memorised.
![<p>Z = log₁₀ [Likelihood of linkage at θ < 0.5 ÷ Likelihood loci are unlinked at θ = 0.5]</p><p>Lecturer explanation:</p><p>The full calculation is more complicated and was not expected to be memorised.</p>](https://assets.knowt.com/user-attachments/2c8f410b-f267-4806-94c3-ad92e5ac9935.png)
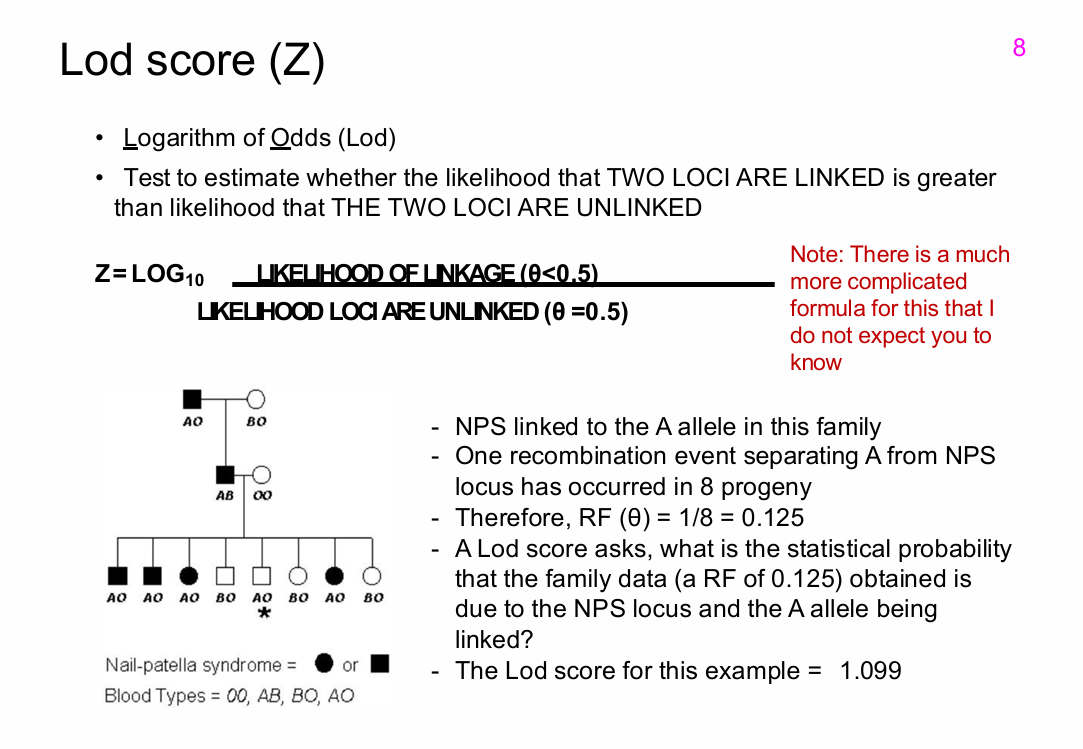
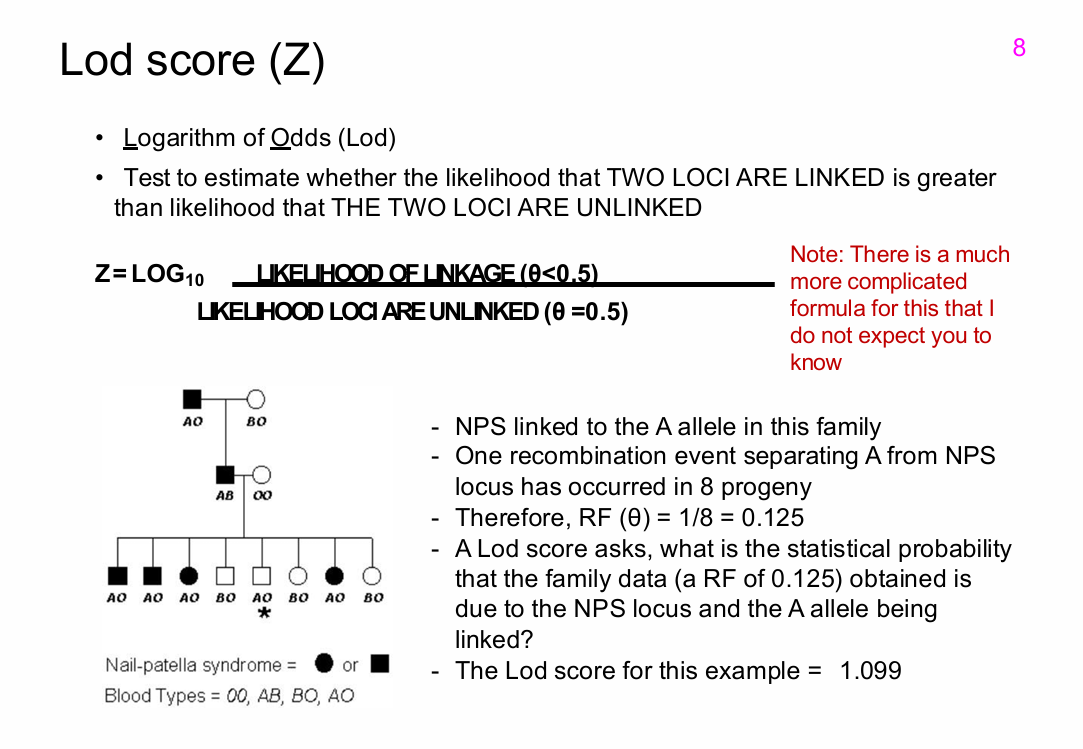
What were the recombination fraction and LOD score in the NPS pedigree example?
There was:
- 1 recombination event in 8 progeny
Therefore:
θ = 1/8 = 0.125
LOD score:
Z = 1.099
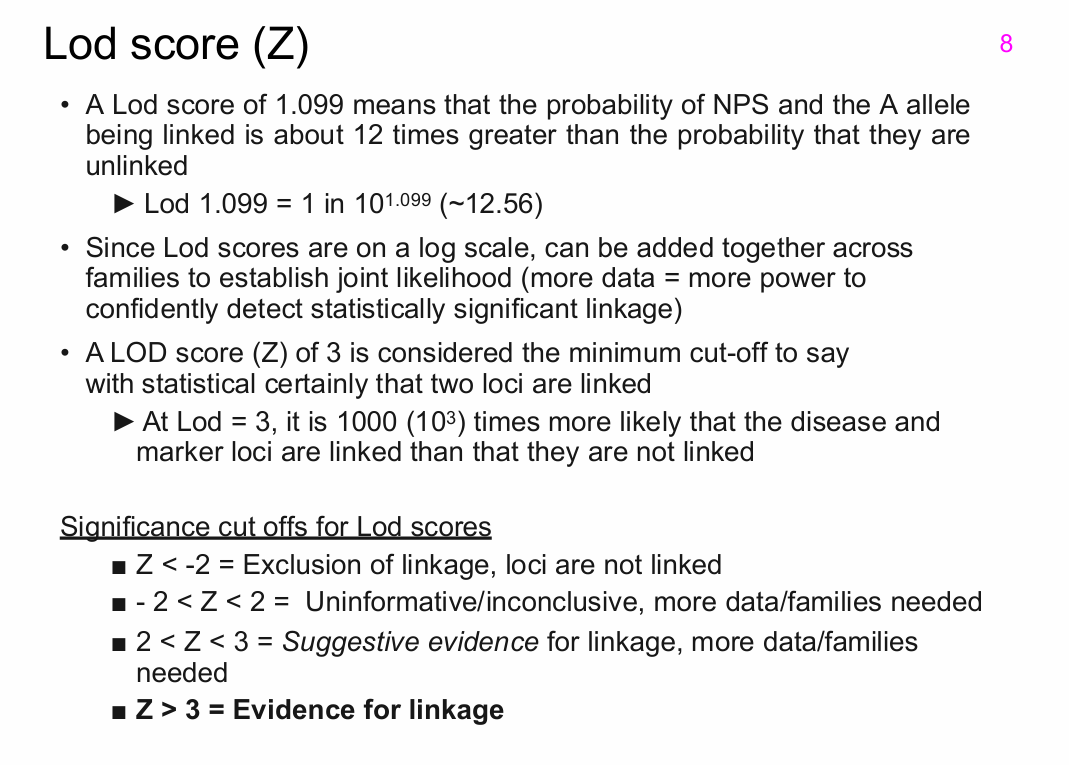
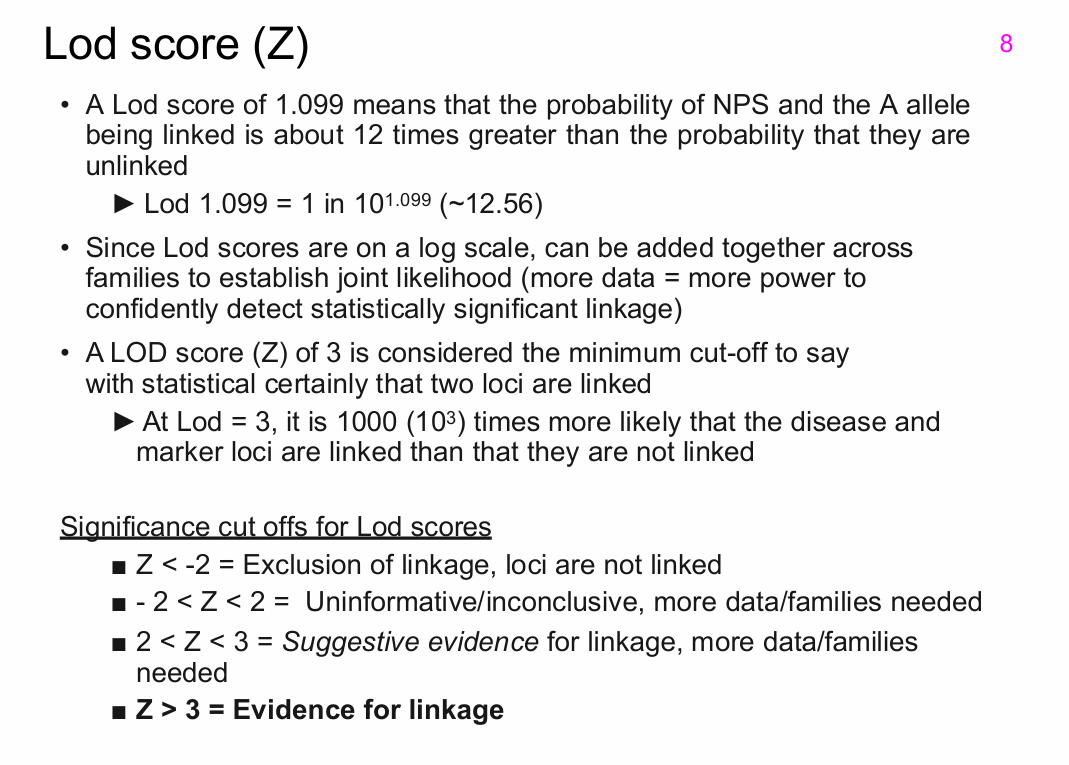
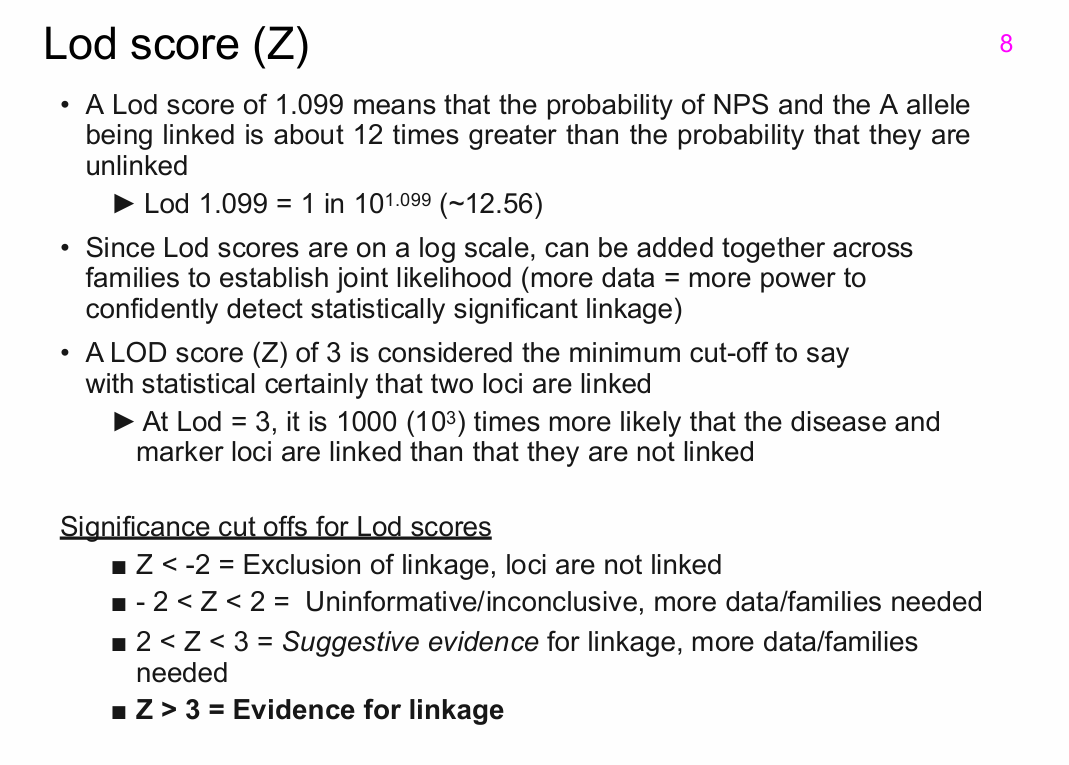
What does a LOD score of 1.099 mean in the NPS example?
It means the observed data are about:
12.56 times more likely
under a linkage model than under an unlinked model.
However:
- This is not sufficient to claim significant linkage.
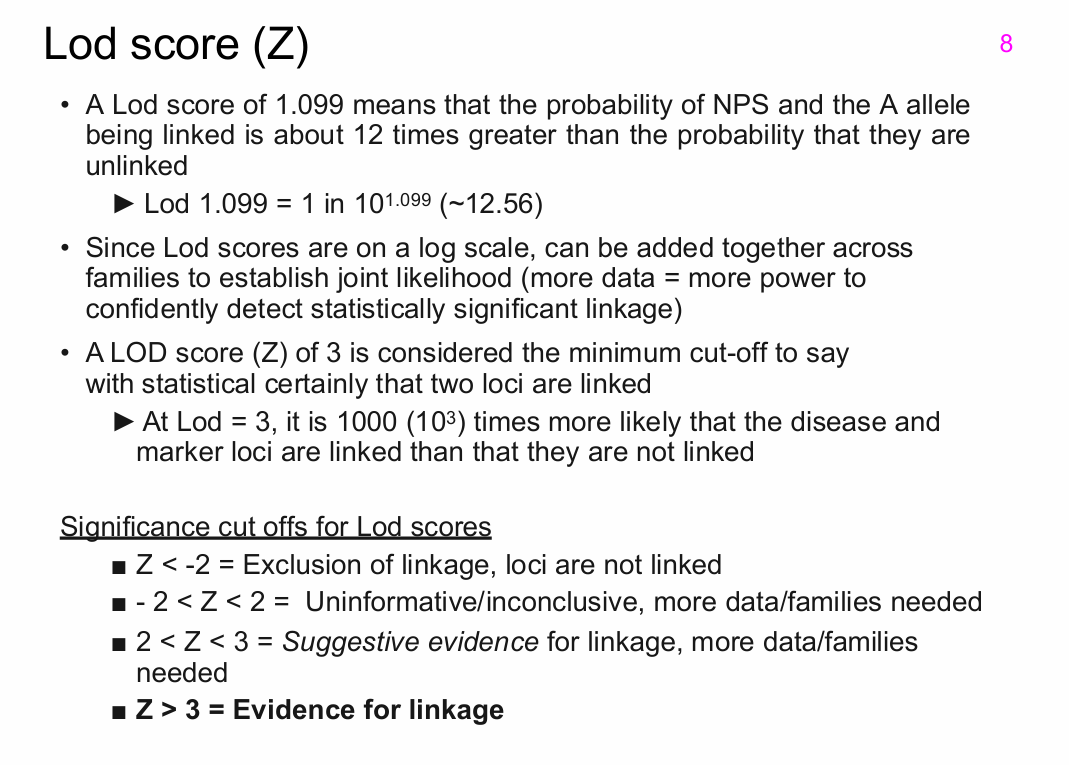
Why can LOD scores from different families be added together?
LOD scores are on a logarithmic scale.
Therefore:
- Evidence from independent families can be summed.
- Combining more families increases statistical power.
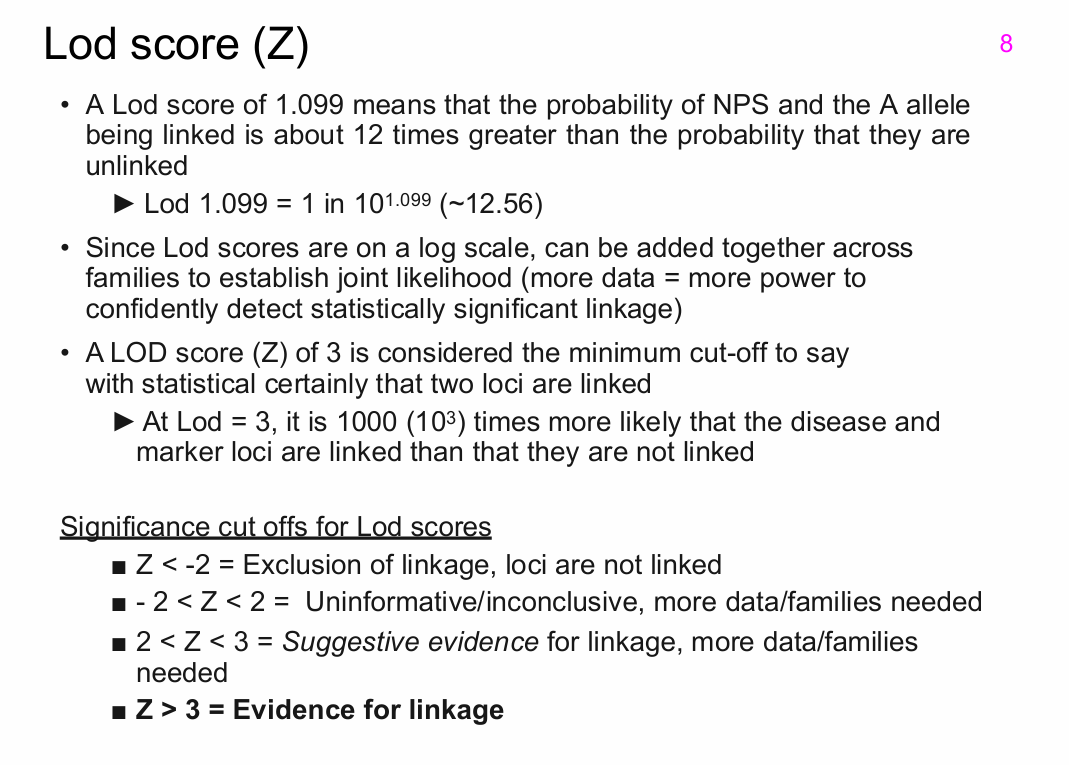
What LOD score is considered significant evidence for linkage?
Z ≥ 3
At Z = 3:
- Linkage is 10³ = 1000 times more likely than no linkage.
What are the standard LOD-score interpretation thresholds given in the lecture?
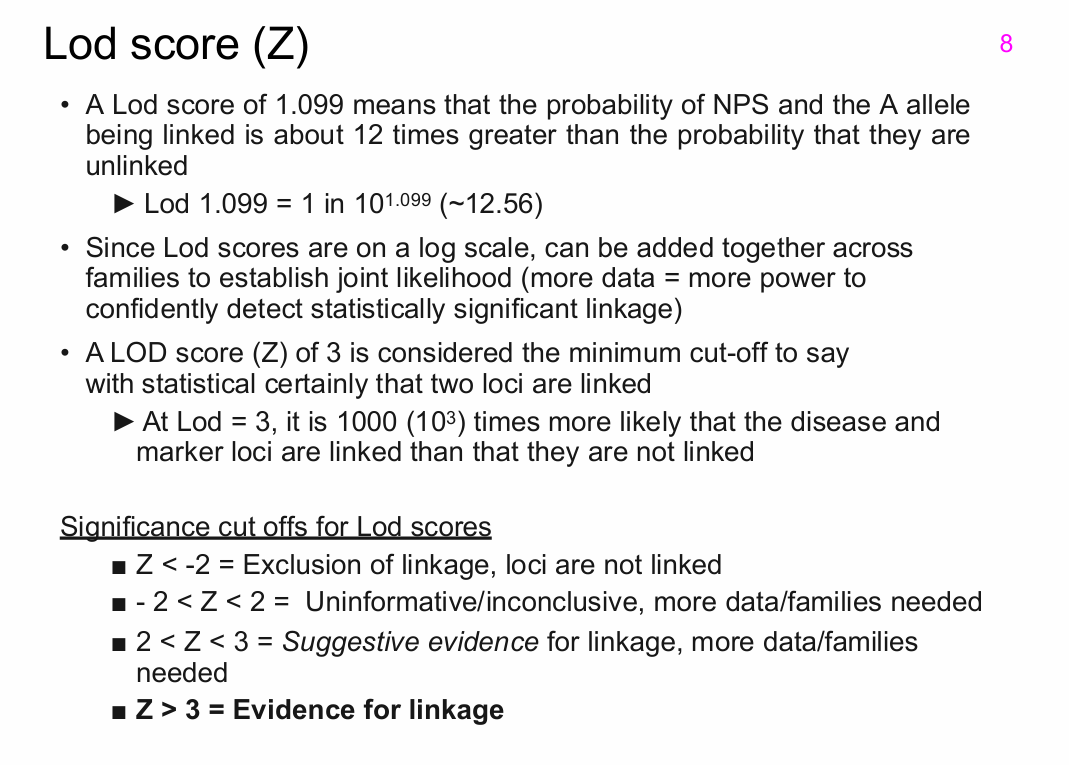
Z < -2:
- Exclusion of linkage
.
-2 < Z < 2:
- Uninformative/inconclusive
- More data needed
.
2 < Z < 3:
- Suggestive evidence for linkage
- More data needed
.
Z > 3:
- Evidence for linkage
What is the key message about LOD scores?
A LOD score is a statistic based on recombination fraction that assesses the probability that two loci are linked.
Z ≥ 3:
- Considered significant evidence for linkage.
Evidence can be strengthened by summing data across multiple families.
What are the major steps in linkage mapping a Mendelian disease gene?
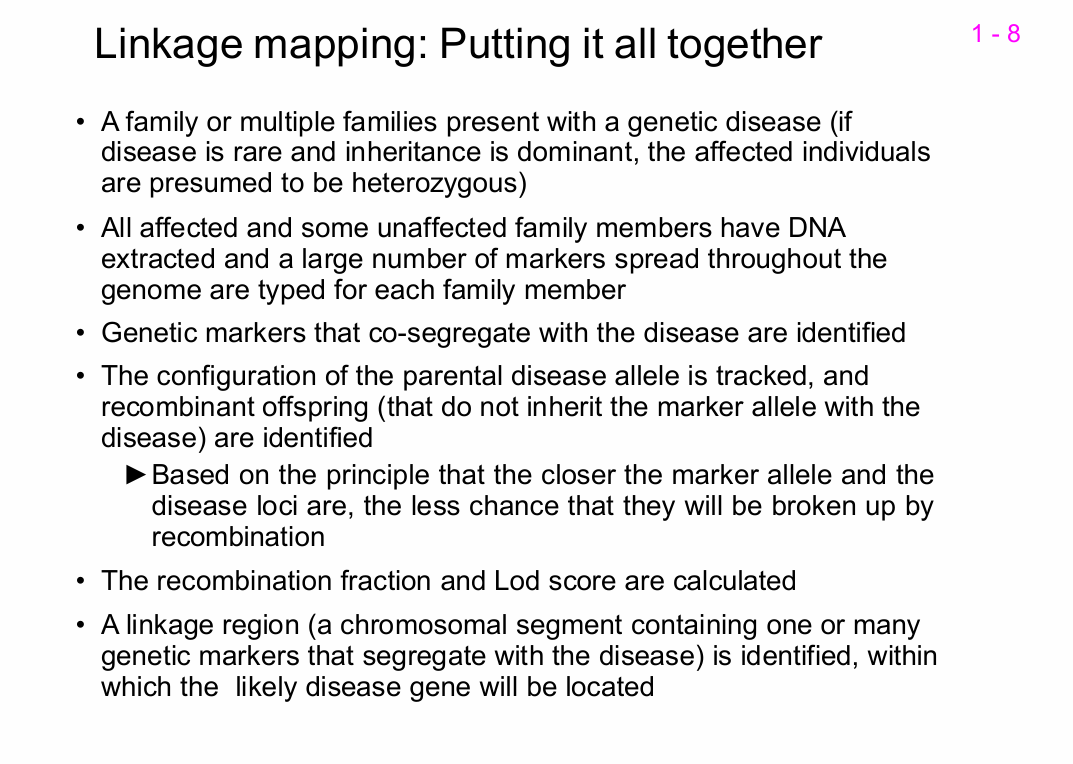
1. Identify one or more families with the genetic disease.
2. If the disease is rare and dominant, affected individuals are presumed heterozygous.
3. Extract DNA from affected and selected unaffected relatives.
4. Genotype many markers across the genome.
5. Identify markers that co-segregate with disease.
6. Track parental allele configuration and recombinant offspring.
7. Calculate recombination fraction.
8. Calculate LOD scores.
9. Define a linkage region containing one or more markers.
10. Search that region for the likely disease gene/variant.
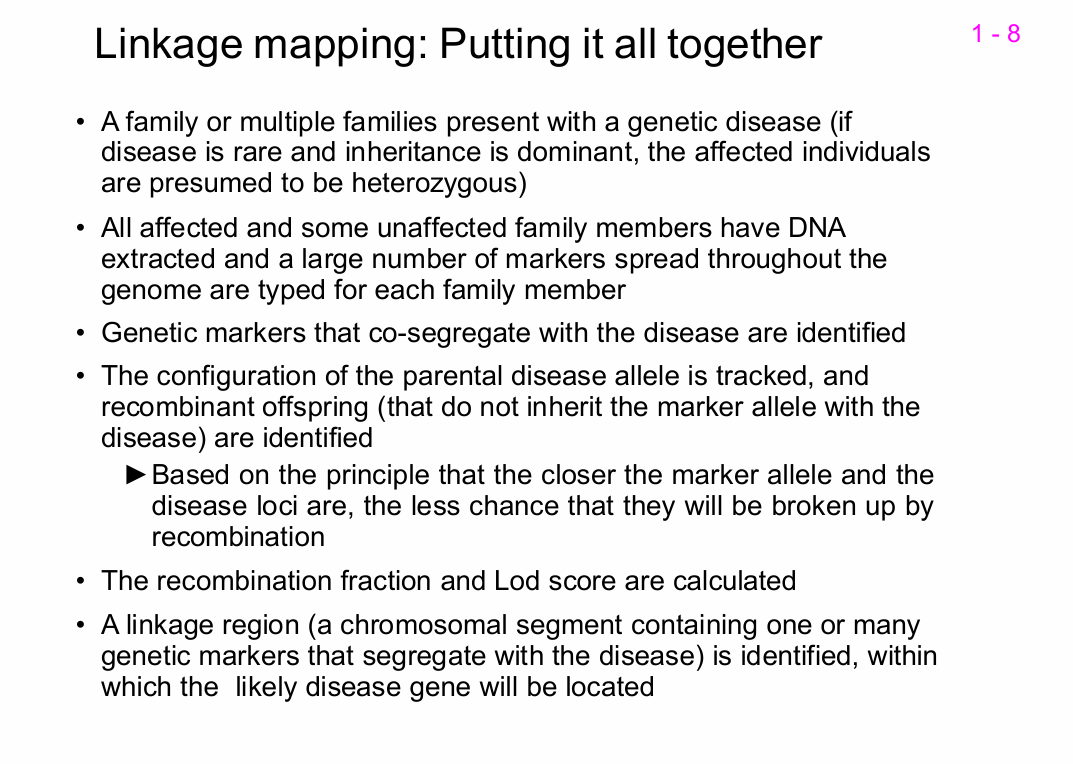
What biological principle underlies linkage mapping?
The closer a marker allele lies to a disease locus:
- The less likely recombination will separate them.
- The more often they will be inherited together.
What is a linkage region?
A linkage region is a chromosomal segment containing one or more markers that co-segregate with the disease phenotype.
The disease-causing gene is expected to lie somewhere within that region.
What is genetic heterogeneity in the context of linkage mapping?
Genetic heterogeneity means that:
- The same or similar phenotype can be caused by different loci
or
- Different families can have mutations in different genes.
How can genetic heterogeneity confound linkage analysis?
If different families have the same clinical diagnosis but different causal genes:
- Their disease loci may be on different chromosomes.
- They will not co-segregate with the same markers.
- Combining them can weaken or eliminate the linkage signal.
What example of genetic heterogeneity was given by the lecturer?
The lecturer used Noonan syndrome as an example.
Different families may have disease caused by different genes, such as:
- NRAS
- SOS1
Combining such families may prevent localisation to a single linkage region.
What is incomplete penetrance in linkage mapping?
Incomplete penetrance occurs when an individual carries a disease-causing genotype but does not show the expected phenotype.
How can incomplete penetrance confound a linkage study?
A carrier may be incorrectly classified as unaffected.
This can:
- Make a disease-linked marker appear not to co-segregate with disease.
- Distort recombination estimates.
- Prevent identification of the true disease locus.
Why is detailed clinical phenotyping essential for linkage mapping?
Accurate phenotype classification determines:
- Which individuals are included as affected
- Which are considered unaffected
- Whether families likely share the same underlying genetic disorder
Poor phenotyping can create false heterogeneity and weaken linkage evidence.
Why can combining families with similar but not identical clinical features cause linkage mapping to fail?
Similar phenotypes may result from:
- Different genes
- Different genes in the same biological pathway
.
If the causal genes are on different chromosomes:
- The families will not share the same linked markers.
- Combined analysis may not produce a significant linkage signal.
What overall factors determine whether linkage mapping succeeds?
Success depends on:
- Accurate clinical phenotyping
- Enough affected relatives
- Enough informative meioses
- Sufficient marker density
- Low genetic heterogeneity
- Correct handling of incomplete penetrance
- Adequate recombination information
- Sufficient statistical power