Describing Continuous Data
1/13
Earn XP
Description and Tags
Appropriate visualisation for the distribution of numeric data, methods to calculate the spread and central tendency for the distribution of numeric data
Name | Mastery | Learn | Test | Matching | Spaced | Call with Kai | Chat |
|---|
No analytics yet
Send a link to your students to track their progress
14 Terms
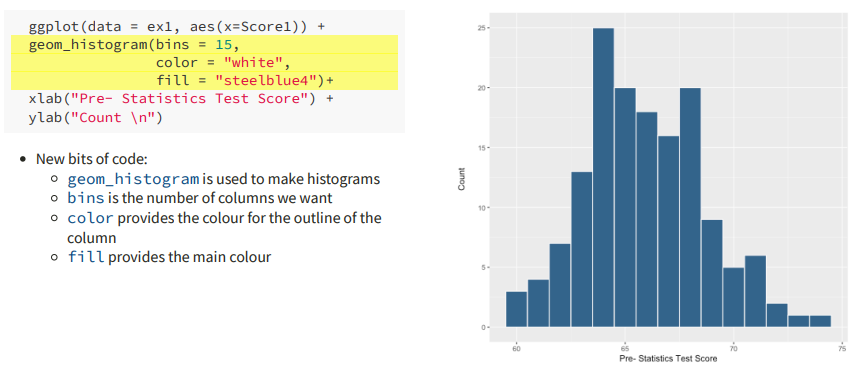
What is used to visualise the distribution of continuous data?
Histogram
Properties:
X-axis → values of some variables commonly presented in bins (range of scores)
Y-axis → frequency of a given value/values within bins
What is the code for histograms?
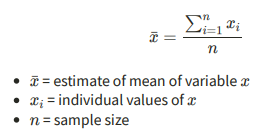
How is the arithmetic mean calculated?
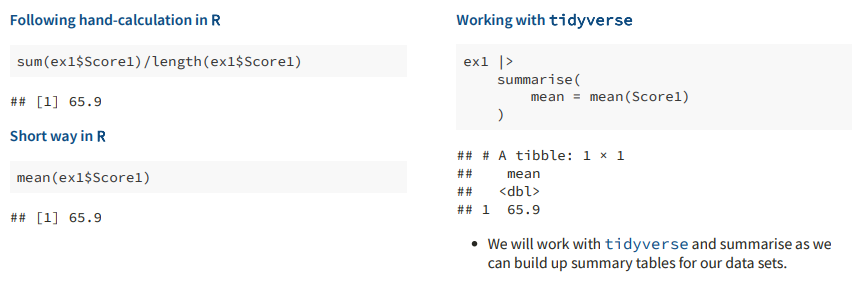
What is the code for calculating the mean?
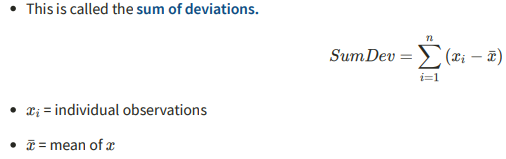
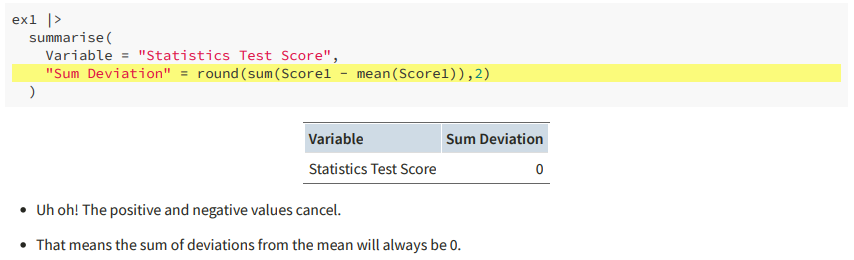
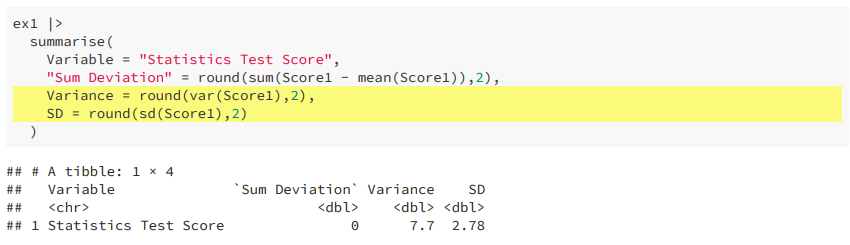
What is the sum of deviations?
Adding up the amount by which each observation differs from the mean
What is the code for calculating the sum of deviations?
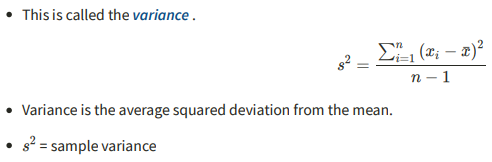
What is variance? What is it useful for?
Average squared deviation from the mean → useful to remove the effect of sign (when calculating the sum of deviations)
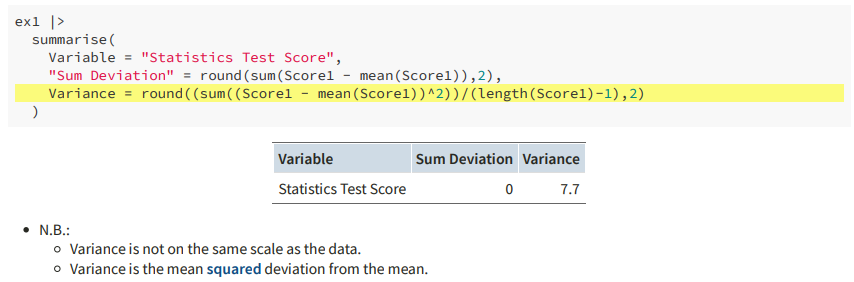
What is the code for calculating variance?
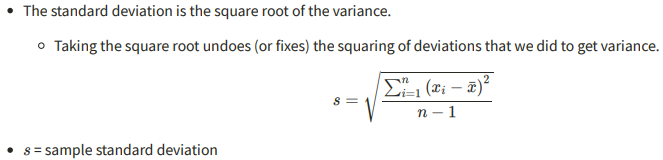
What is standard deviation?
Measure of variation in the same units as the mean/variable; square root of the variable
What is the code for calculating standard deviation?
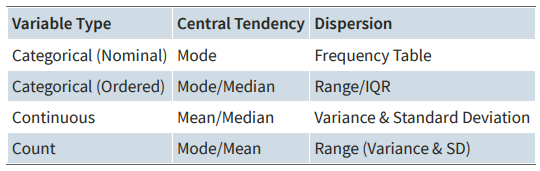
What does the measure used for different variable types depend on?
Depends on level of measurement
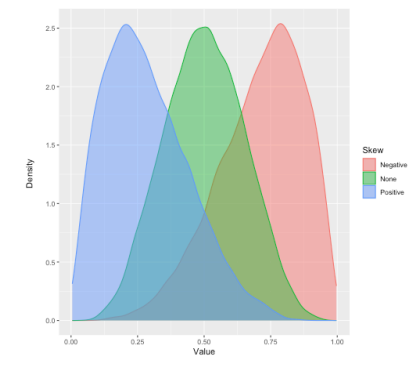
What is a skewed distribution and what does it look like?
Measure of asymmetry
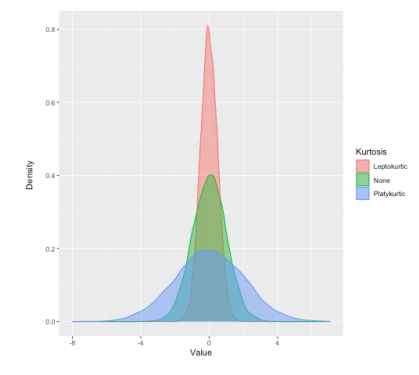
What is kurtosis and what does it look like?
Measure of the flatness of the peak + the fatness of the tails of the distribution
What do skew and kurtosis impact?
The normality of the distribution of the data