AP Bio - Unit 0 - Methods of Science (copy)
1/47
Earn XP
Name | Mastery | Learn | Test | Matching | Spaced |
|---|
No study sessions yet.
48 Terms
Bar graph
A type of chart that represents data with rectangular bars, where the length of each bar is proportional to the value it represents. Often used to compare different groups or track changes over time.
Biology
The scientific study of life and living organisms, encompassing a wide range of fields that examine the structure, function, growth, evolution, and distribution of living things.It includes areas such as genetics, ecology, and physiology.
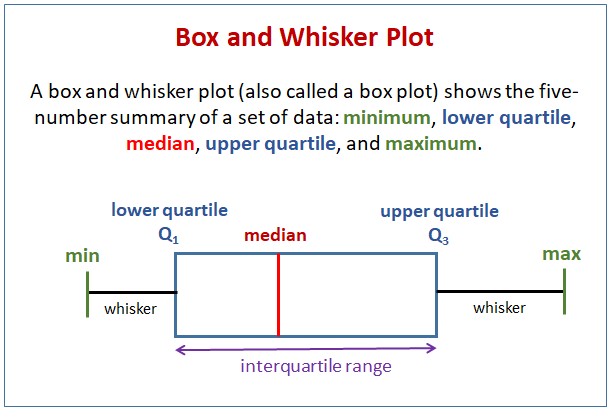
Box & Whisker plot
A standardized way of displaying the distribution of data based on a five-number summary: minimum, first quartile, median, third quartile, and maximum. This type of plot helps to visualize the central tendency and variability of a dataset.
Cell
The basic structural and functional unit of all living organisms, consisting of cytoplasm enclosed within a membrane, and containing genetic material and organelles.
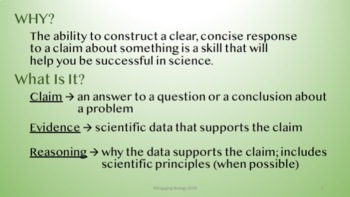
CER
A framework for constructing scientific explanations that includes a Claim, Evidence, and Reasoning, used to articulate and support conclusions based on data.
Null Hypothesis (H0)
A statement that there is no effect or no difference between variables, used as a default position in statistical testing. It serves as a basis for comparison against the alternative hypothesis.
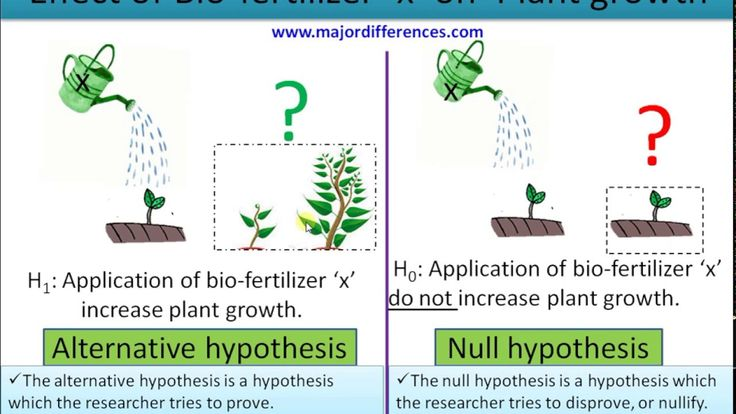
Alternative Hypothesis (HA)
A statement that indicates the presence of an effect or a difference between variables, which researchers aim to support in statistical testing.

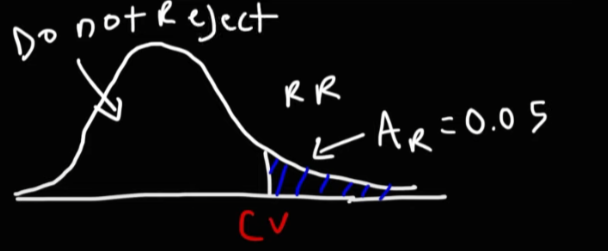
Critical Chi Square Value
The threshold that determines whether to reject the null hypothesis based on the chi-square statistic.

Alpha (Chi Square Test)
The significance level in hypothesis testing represents the probability of rejecting the null hypothesis when it's true. Commonly set at 0.05, it sets the threshold for statistical significance.
Chi Square Goodness Fit vs Independent Test
Two types of chi-square tests: one distribution matches an expected distribution, while the other tests if two categorical variables are independent of each other.
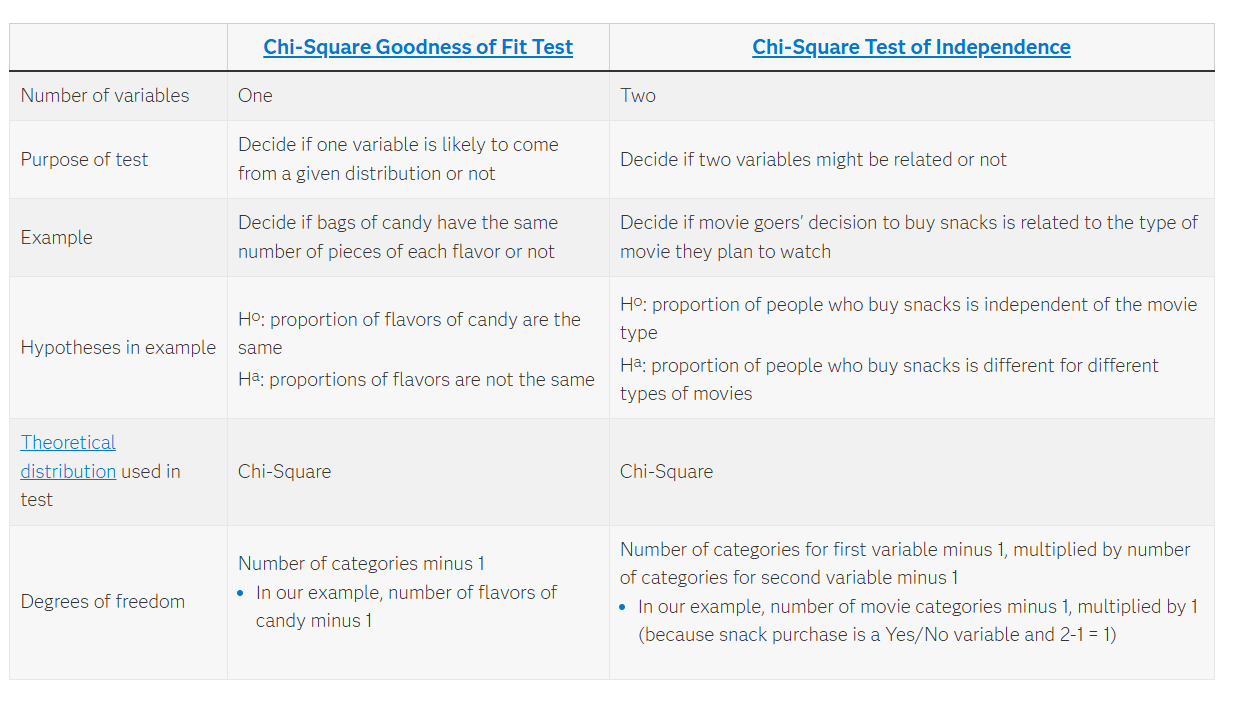
Degrees of Freedom
The number of values in a statistical calculation that can vary is used to find the chi-square distribution. (Goodness fit test: n - 1)
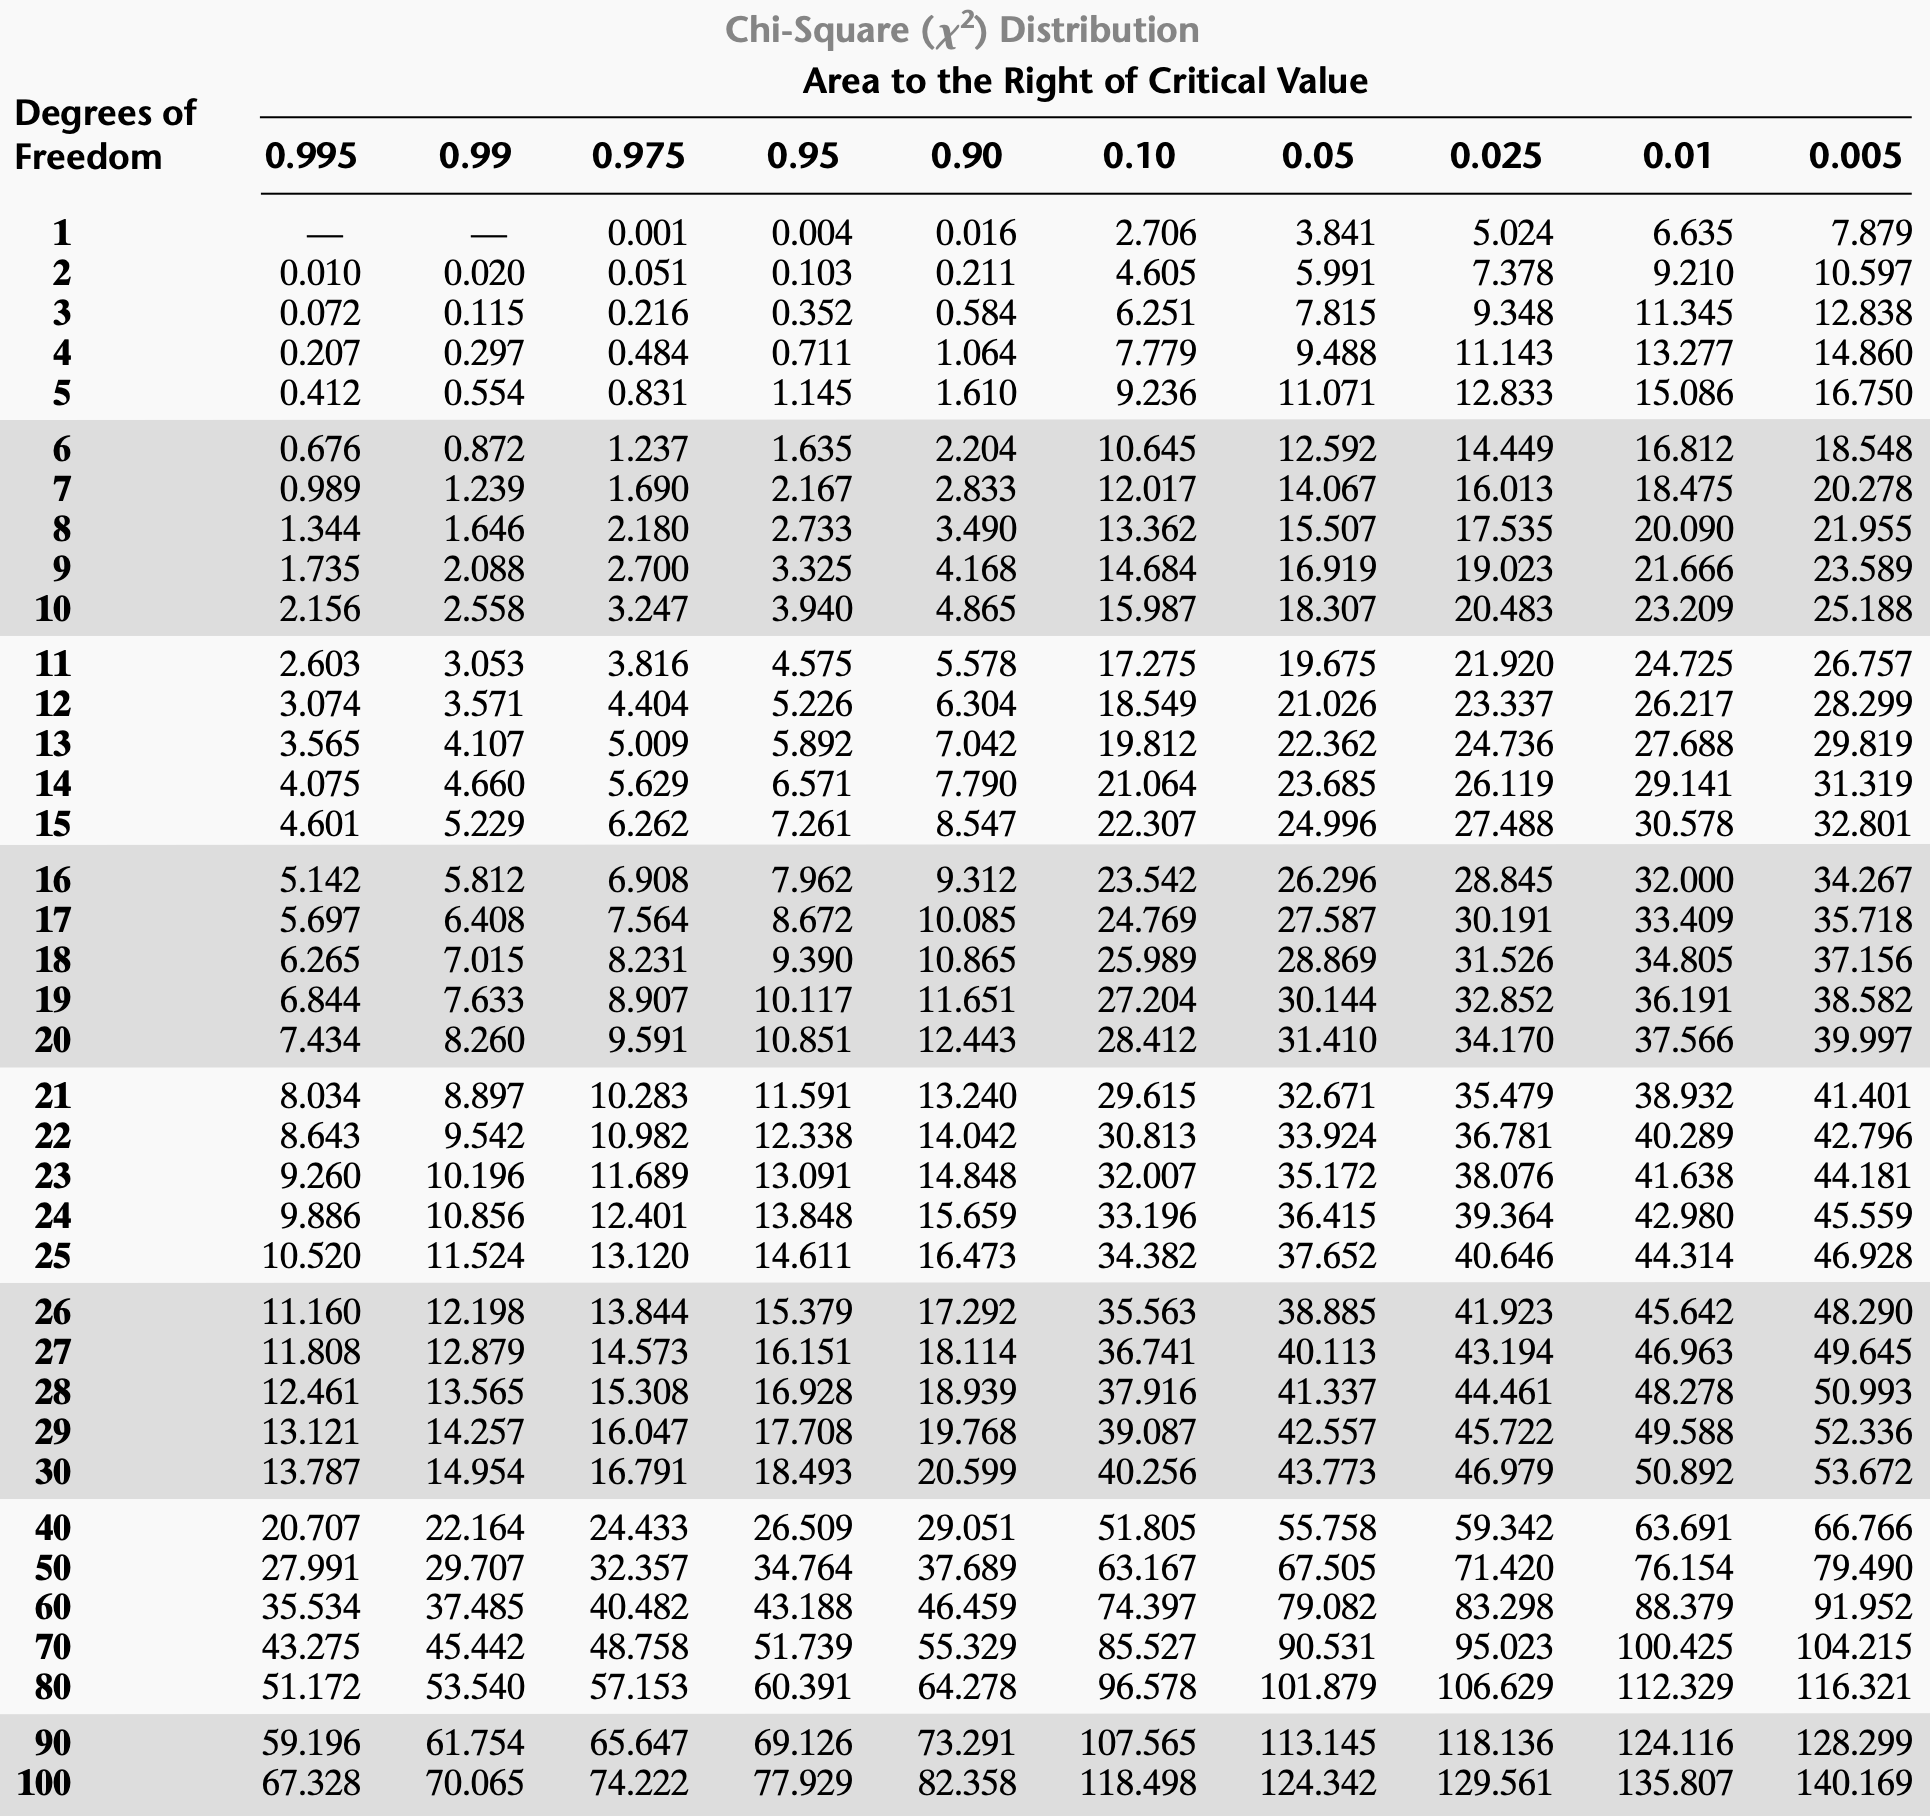
Chi Square Distribution Table
A reference table used to find critical values for chi-square tests, based on degrees of freedom and alpha levels, to determine statistical significance. (Area right to the critical value = alpha)
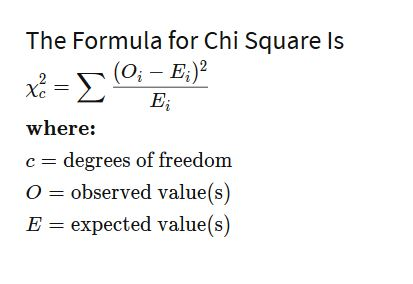
Chi Square Formula
A formula used to calculate the chi-square statistic by comparing observed frequencies to expected frequencies, in EACH CATAGORY. E = sigma, the sum of all the equations from each catagory
Control Group
The group of subject that receive no treatment or a standardized treatment. Uses it as a baseline to compare with the experimented group.
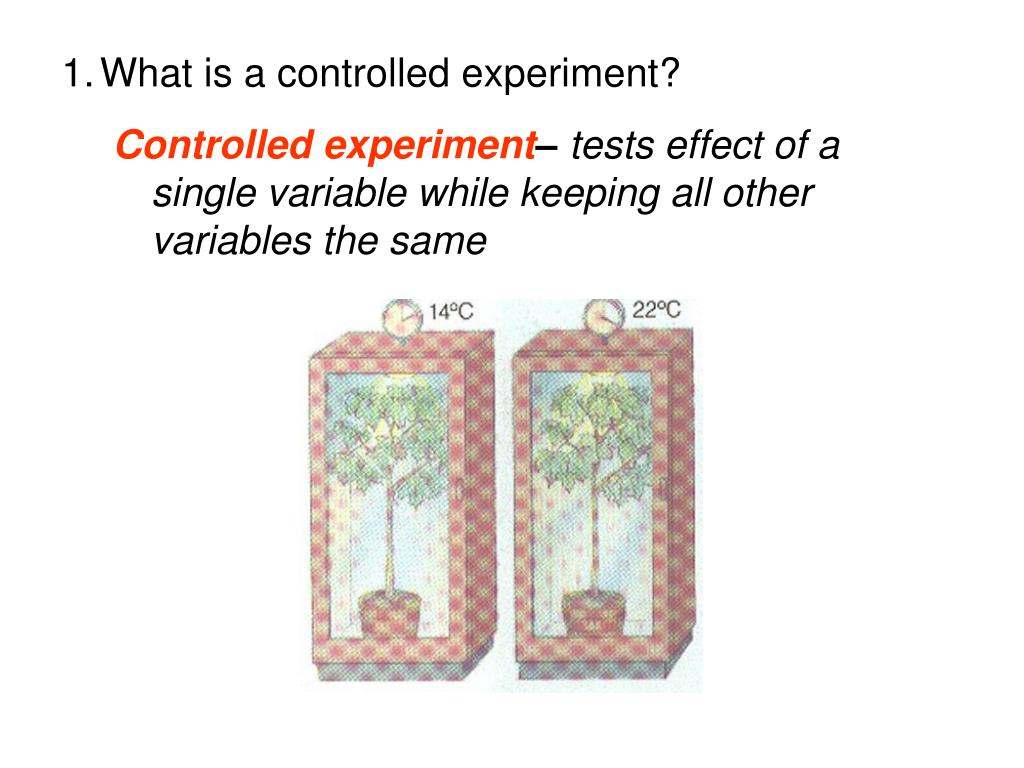
Controlled experiment
All variables other than the independent variable are controlled or held constant so they don’t influence the dependent variable.
Controlled variables/constants
Any factor that is controlled or held constant during an experiment.
Data table
A display of information in a table.
Dependent variable
What is measured in an experiment, and its value depends on changes made to an independent variable
DNA
The material that carries all the information about how a living thing will look and function.
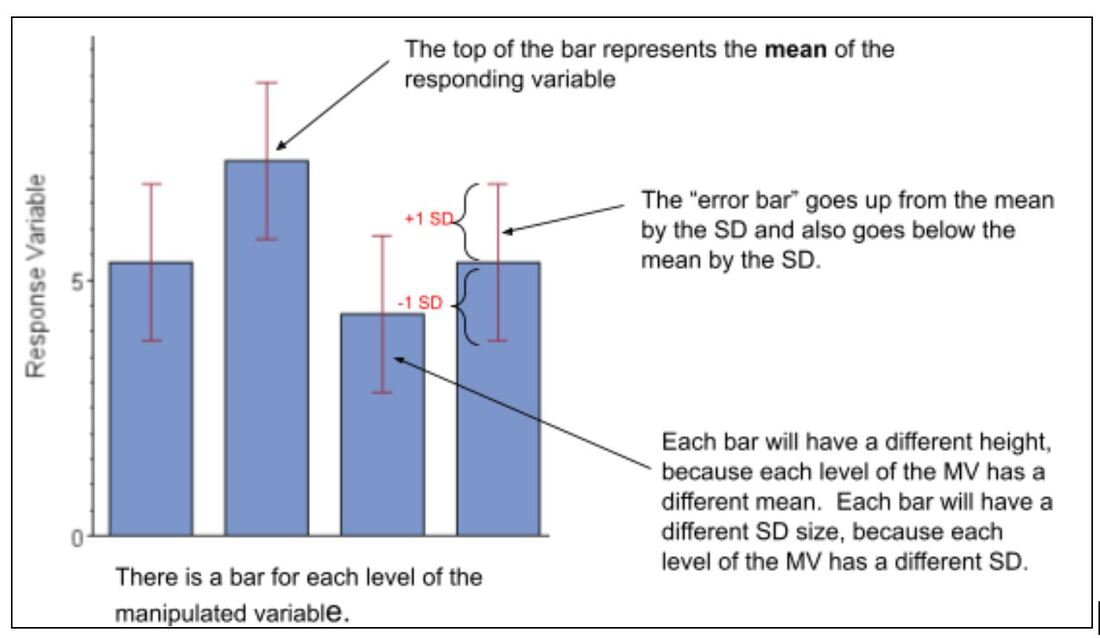
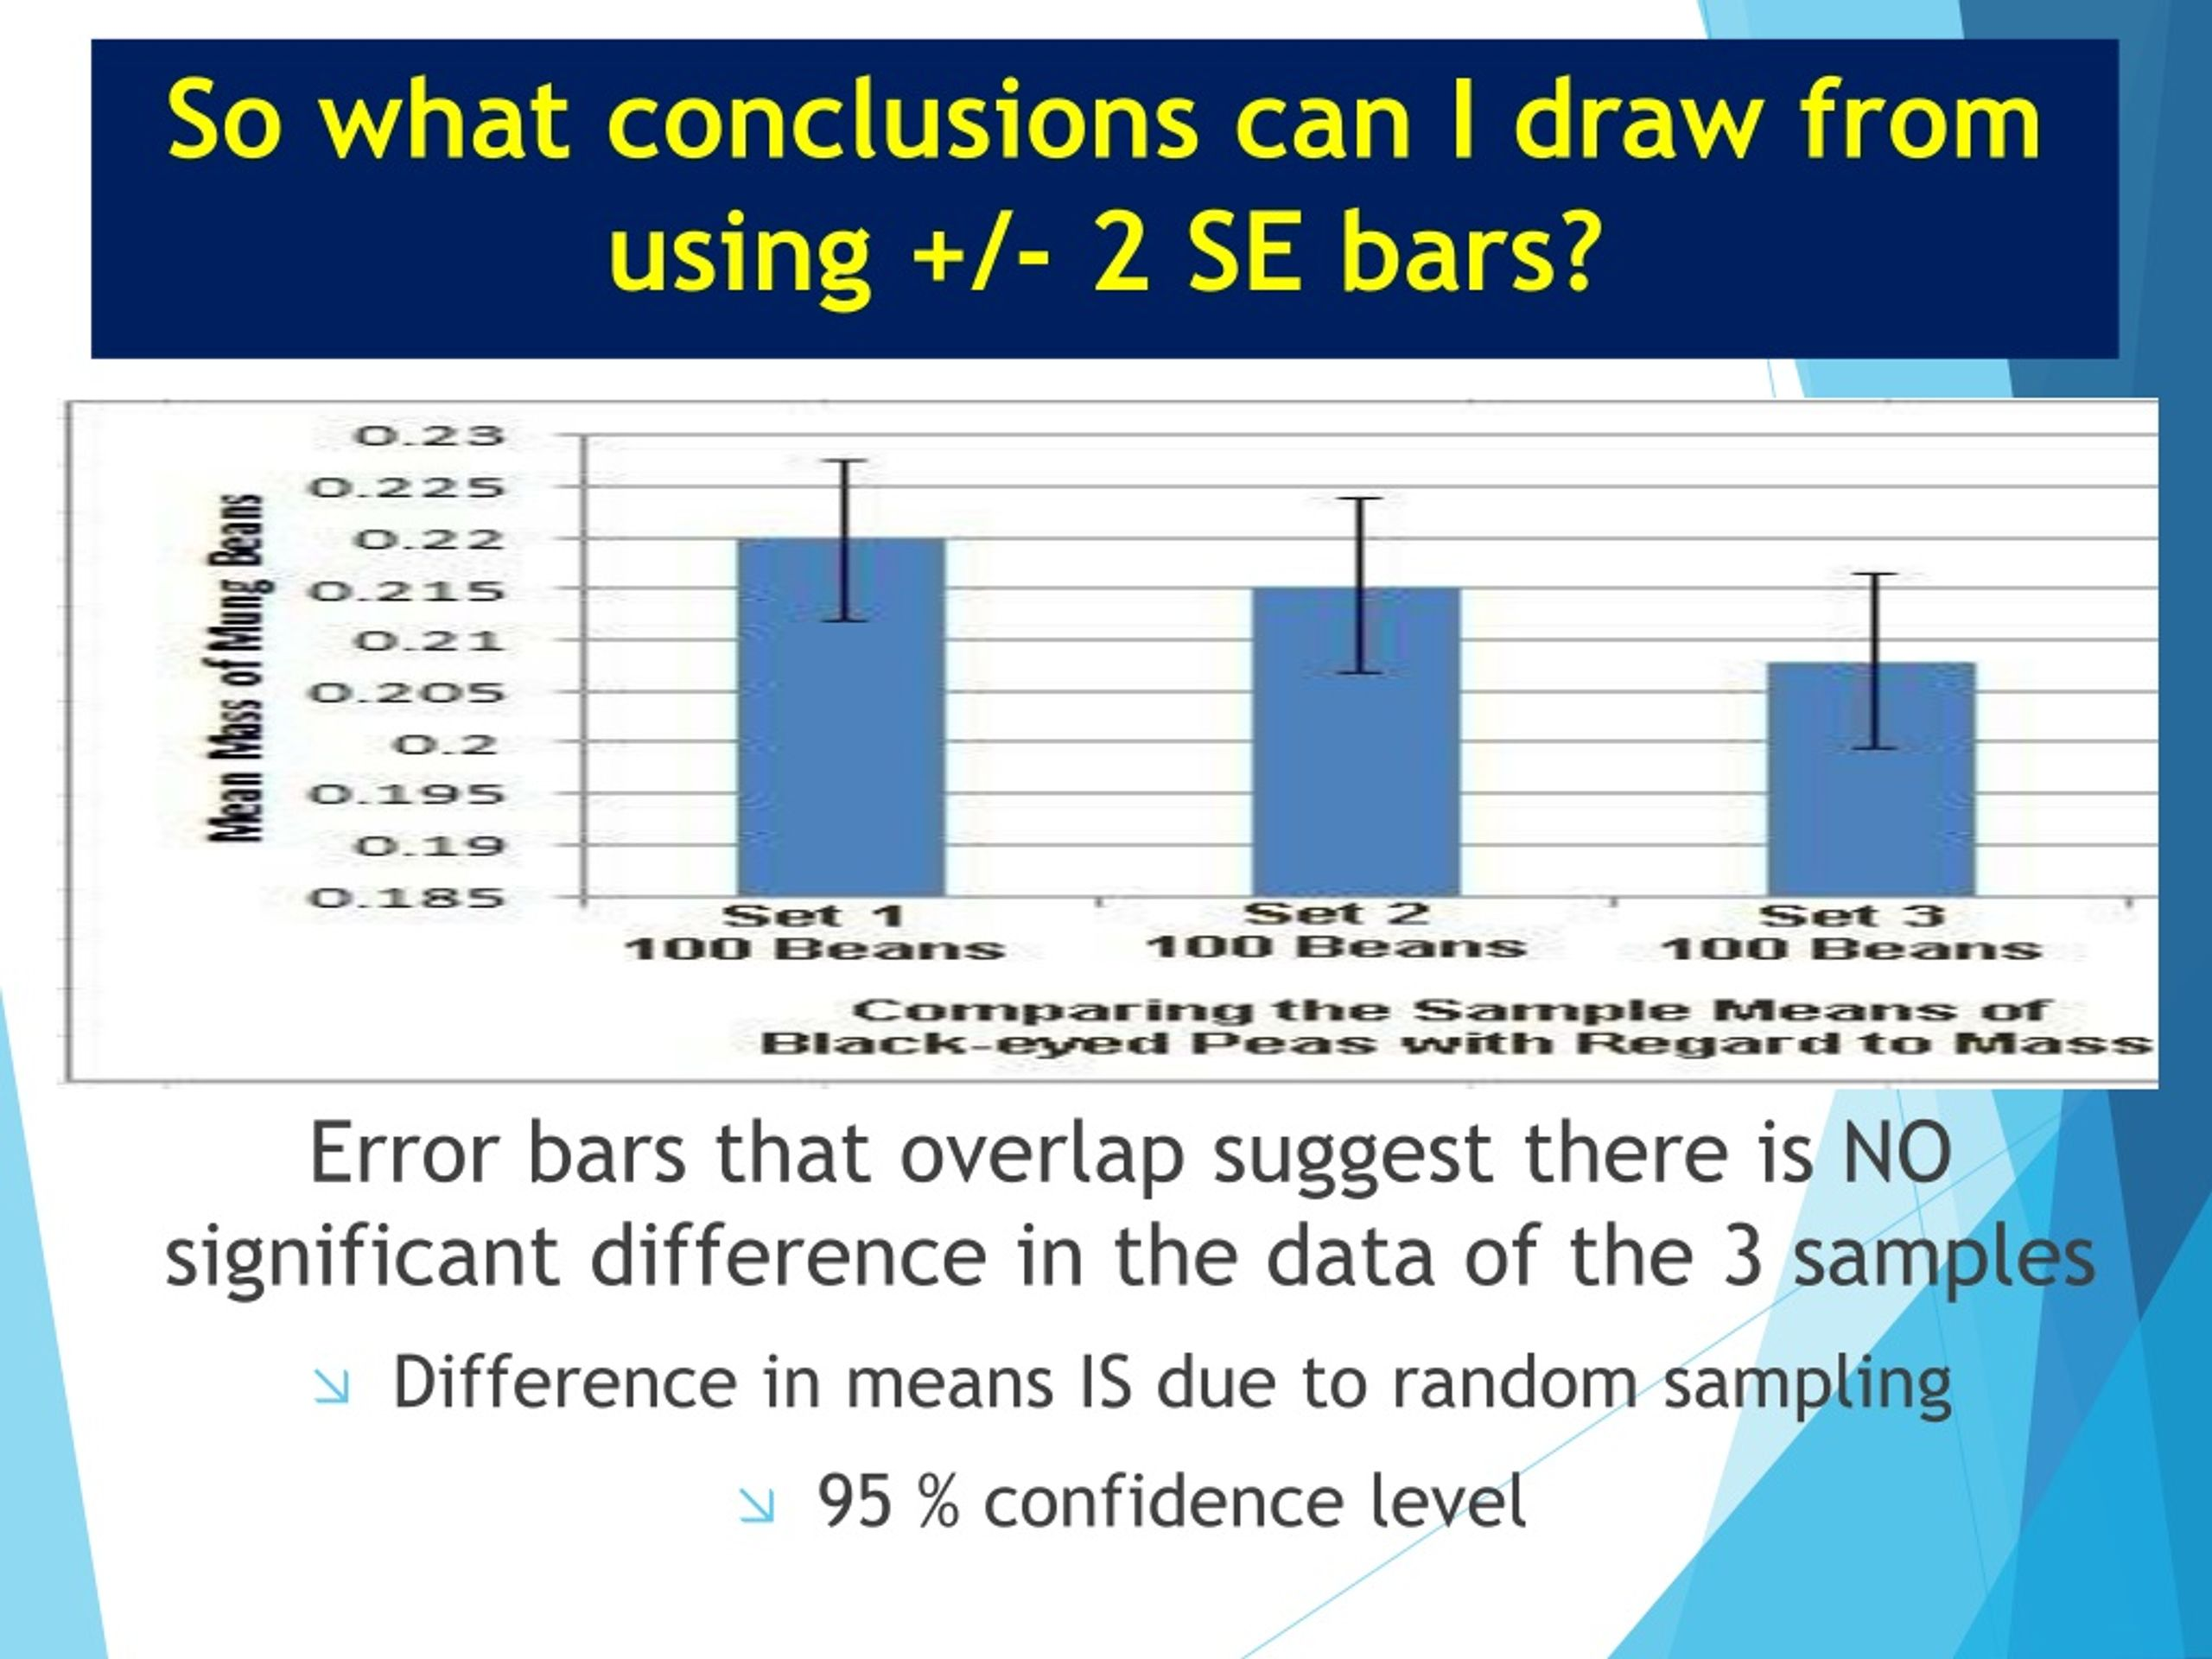
Error Bars
A line through a point on a graph, parallel to one of the axes, which represents the variation or spread relative to corresponding point (which is usually a central tendency, such as mean) (small SD bar = low spread, data are clumped around the mean; larger SD bar = larger spread, data are more variable from the mean).
(2± 1 SEM)
Evolution
Various types of plants, animals, and other living things on Earth have their origin in other preexisting types and that the distinguishable differences are due to modifications in successive generations.
Experimental group
The group in a designed experiment that receives the treatment or condition that researchers are testing.
Independent variable
A factor that is manipulated or changed in an experiment to observe its effect on a dependent variable.
Law
A statement or mathematical equation that describes or predicts a natural phenomenon.
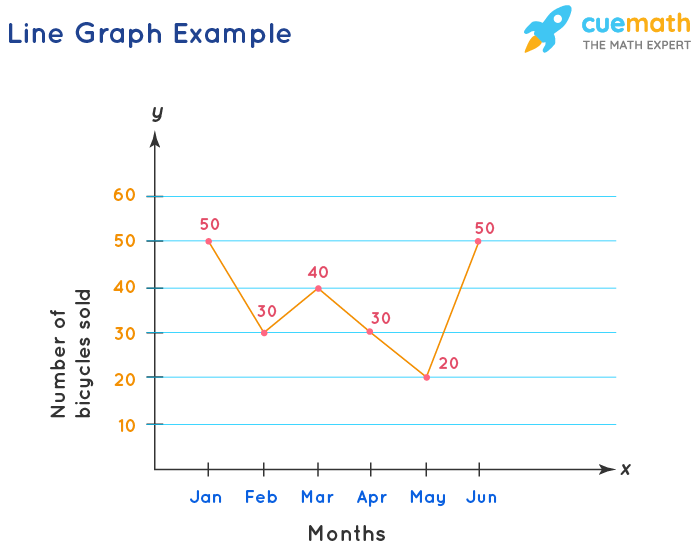
Line Graph
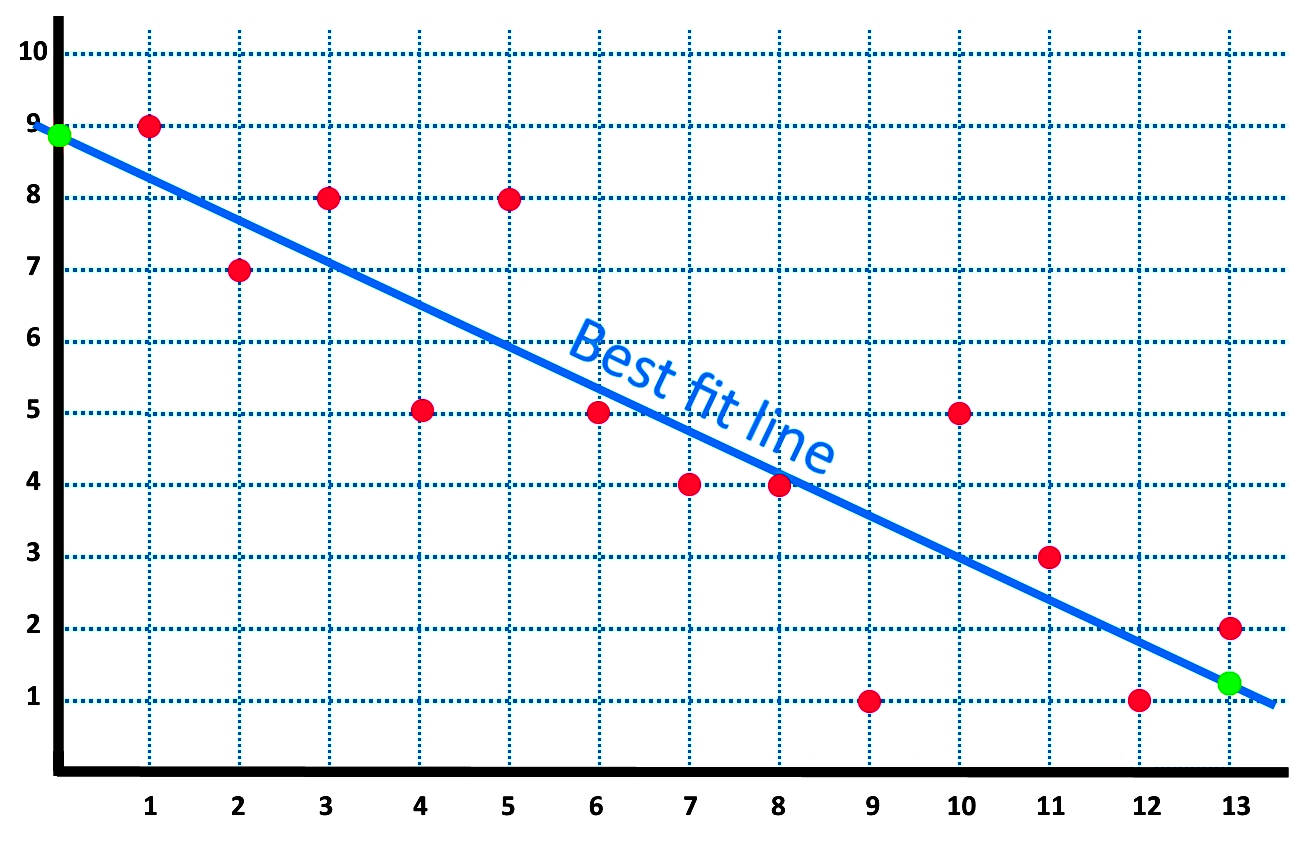
Line of best fit
Mean
The average of all numerical data.
Negative control
A group that does not receive the procedure or treatment and is expected not to yield a positive result. Its role is to ensure that a positive result in the experiment is due to the treatment or procedure.
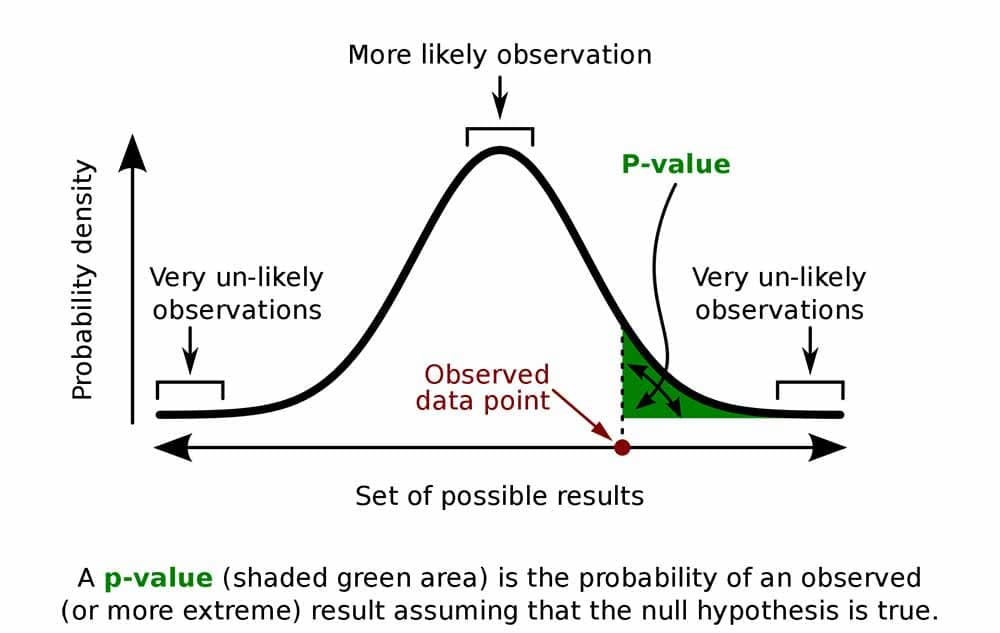
P-value
This helps determine the significance of results in hypothesis testing. It's the probability of observing the test results (or more extreme), assuming the null hypothesis is true; smaller value suggest stronger evidence against the null hypothesis.
Positive Control
A sample treated to produce a known positive result, confirming the experiment's ability to generate results under test conditions.
Product
A molecule that is formed as a result of a biological process, such as a chemical reaction or synthesis
Qualtitative data
Data representing information and concepts that are not represented by numbers (ex. interviews, diaries, etc.)
Quantitative data
Data that is can be represented by numbers.
Rate
The speed or frequency of a process or event.
Reactant
A substance that undergoes a chemical change during a reaction.
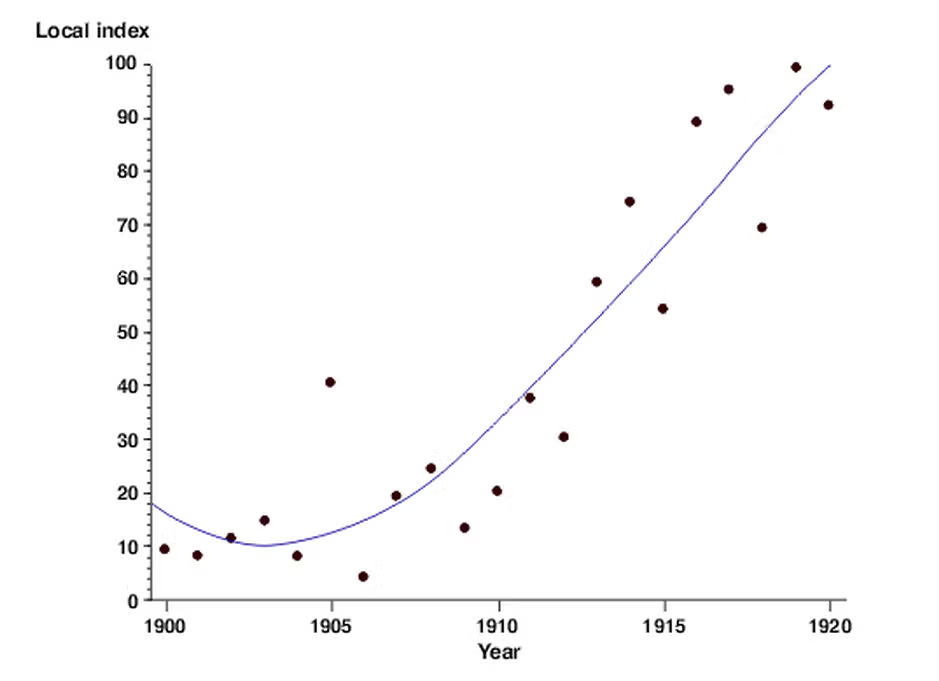
Scatter plot
Science
The systematic study of the structure and behavior of the physical and natural world through observation, experimentation, and the testing of theories against the evidence obtained.
Standard deviation
A measure of the amount of variation of the values of a variable about its mean.
Low indicates that the values tend to be close to the mean of the set, while a high indicates that the values are spread out over a wider range.
Standard error of the mean (SEM)
Indicates how much the sample mean deviates from the population mean. Smaller = more precise estimate.
Sample vs Population Mean
The average calculated from a subset of a population, used to estimate the population mean. Population mean is the true average of an entire group. The significance lies in using the sample mean to infer characteristics about the larger population, with SEM indicating the accuracy of this estimation.
Statistical significance
Indicates whether a result is likely due to something other than chance, often assessed using p-values to see if the null hypothesis can be rejected.
Statistics
A field of mathematics that involves the collection, analysis, interpretation, and presentation of data.
Theory
A well-substantiated explanation of an aspect of the natural world that can incorporate laws, hypotheses and facts.
Trial
In scientific terms, it refers to a methodical experiment or investigation conducted to test a hypothesis.
Variable
A factor or characteristic that can change or vary in an experiment or study.
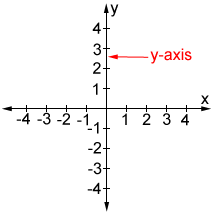
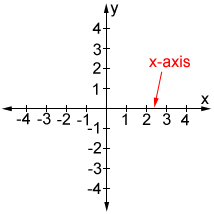
X-axis
Y-axis