Complete AICE Environmental Management Review
1/287
There's no tags or description
Looks like no tags are added yet.
Name | Mastery | Learn | Test | Matching | Spaced | Call with Kai |
|---|
No study sessions yet.
288 Terms
Name all 7 continents
Africa, Antarctica, Asia, Oceania, Europe, North America, South America
Name all 5 oceans
Pacific Ocean, Atlantic Ocean, Arctic Ocean, Indian Ocean, Southern Ocean
LICs
low income countries
MICs
middle income countries
HICs
high income countries
Sustainability
the ability to meet the needs of the present without compromising the ability of future generations to meet their own needs
Hypothesis Formula
There will be a(n) [direct/inverse] relationship between [insert combination of experiment-specific variables here]
(NEVER SAY THE WORD PROVES)
Quantitive data
numerical data
Qualitative data
descriptive data
independent variable
the manipulated variable
Dependent variable
the measured variable
Limitations can lead to...
uncertainty in results
Theory
a hypothesis that is consistently supported by investigation and observation
What is used to collect representative date?
sampling strategies
How does random sampling decrease bias?
It removes human choice from the procedure so the results are not inadvertently influenced.
Random Sampling
each item/individual has an equal probability of being chosen
- best used for smaller data sets
- can produce more representative results
Systematic Sampling
selects items using an interval
- best when data does not exhibit patterns and manipulation risk is low
- best for wide study area
- may cause over or under representation due to arbitrary parameters
Selection Bias
occurs when the selection for the sample is not representative of the population
Measurement Bias
happens when there is faulty equipment
Population Density
population size/total land area
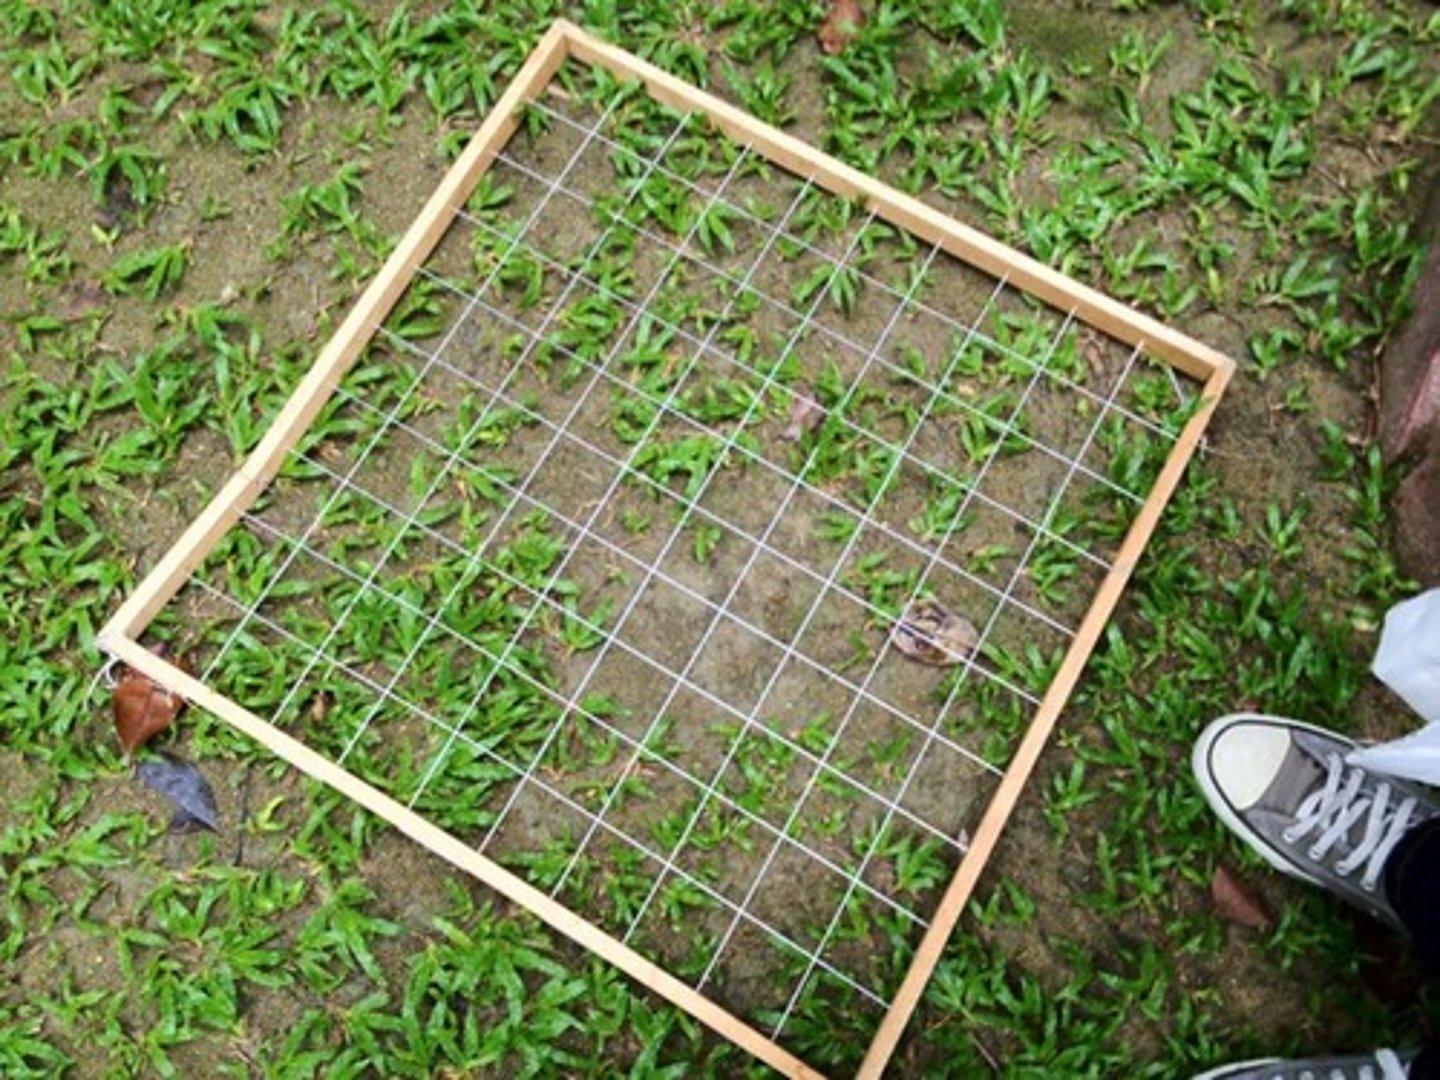
Quadrats
3 types: frame, grid, point
Pros:
- good for observing changes in an entire population over time
- easy to design and carry out
- useful for population density
Cons:
- design flaws could introduce errors (ex. incorrect quadrat size relative to the size of the species being sampled)
- not good for measuring dispersion patterns
Frame Quadrat
- a square frame is used to outline a sample area
Steps:
1. determine quadrat size (m^2)
2. count individuals in quadrat
3. individuals/area
(example on 2.3 ppt slide 39)
- can also be used to calculate percentage cover

Grid Quadrat
- measures percent frequency
Steps:
1. count the number of squares where the species is present
2. count number of total squares
3. squares with species/total squares = %
(example on 2.3 ppt slide 40)
Percent Coverage
percent of area within a quadrat covered by a single species (subjectivity due to estimations)
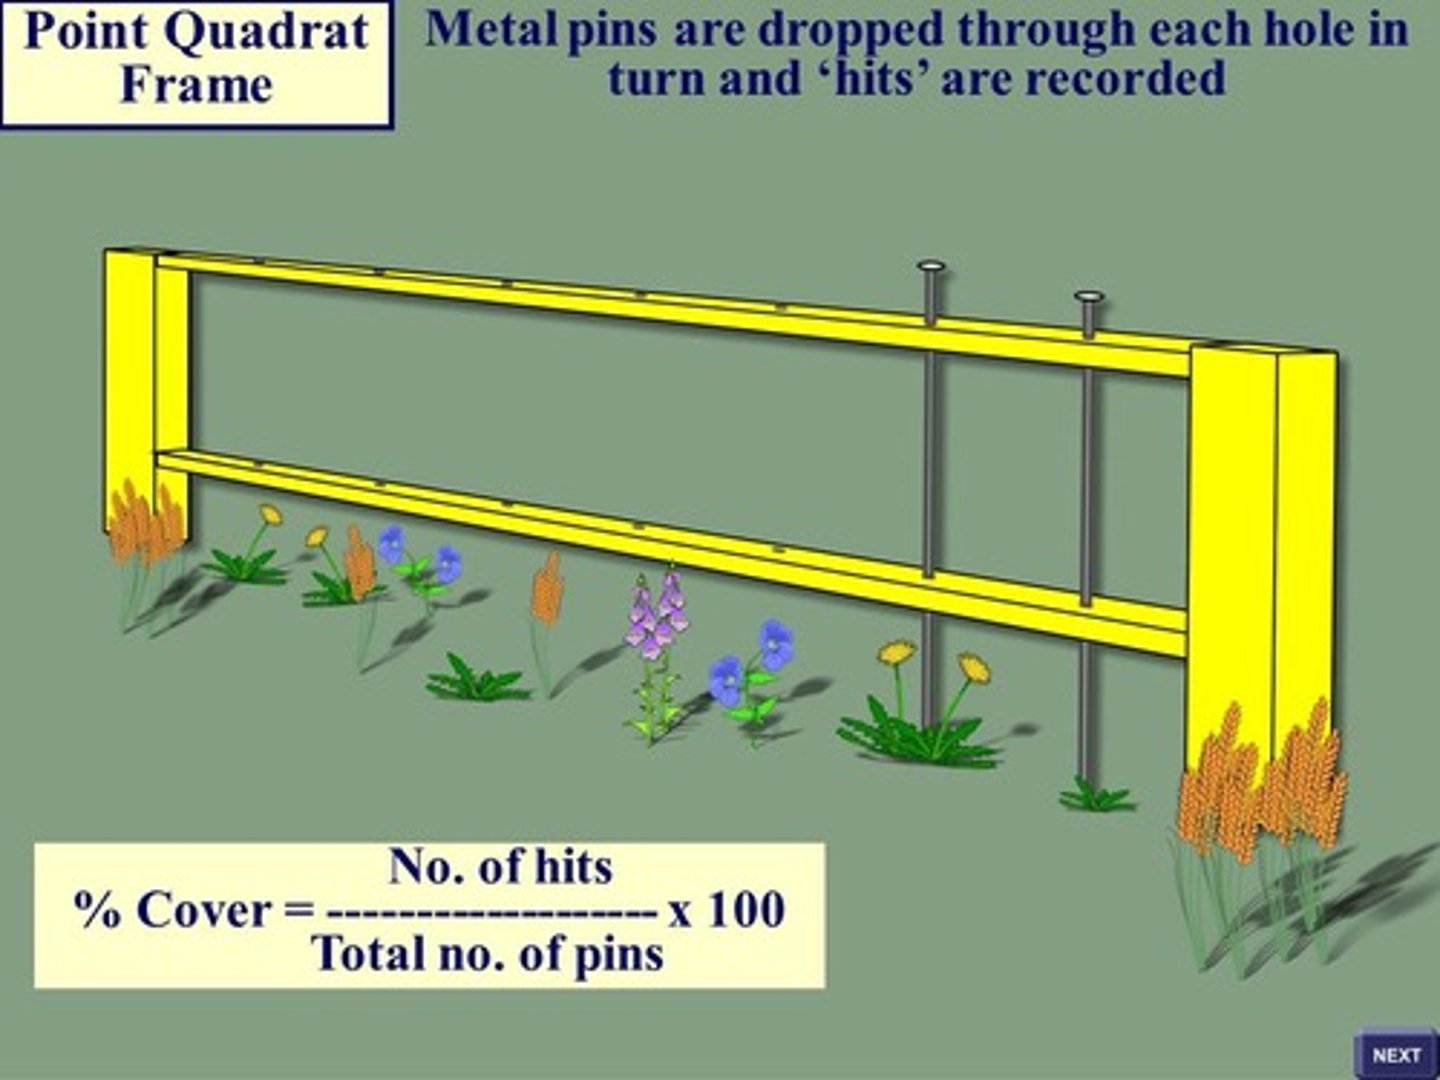
Point Quadrat
- pin dropped through holes in a horizontal bar, each species touched by a pin is counted
Pros:
- good for dense vegetation
- less subjective when calculating % cover
Cons:
- bad for plants larger than the frame
- overestimates tall, thin leaved plants
Pitfall Traps
Pros:
- passive, easily installable
- can help with calculating biodiversity
Cons:
- non-selective in what species it catches
- trapped animals could harm one another
- not good for population density
Sweep Nets
Pros:
- good for catching insects and animals in grass
- fast and allows for specificity
Cons:
- human error can cause variability
- easily damaged
- not suitable for low-to-the-ground species
Beating Trays
Pros:
- good for beetles and larva
Cons:
- unwanted material may drop onto the tray
- variability as a result of time or weather
Kick Nets/Sampling
Pros:
- can quick and easy
Cons:
- only catches a portion of the species
- not good for population density
- underestimates invertebrates that are attached to stones or heavy
Light Traps
Pros:
- cheap and portable
- collects large samples of and varieties of insects
- monitors disease-carrying insects
Cons:
- ineffective in the presence of other light
- variable based on different species' response to light
- may attract disease-carrying insects
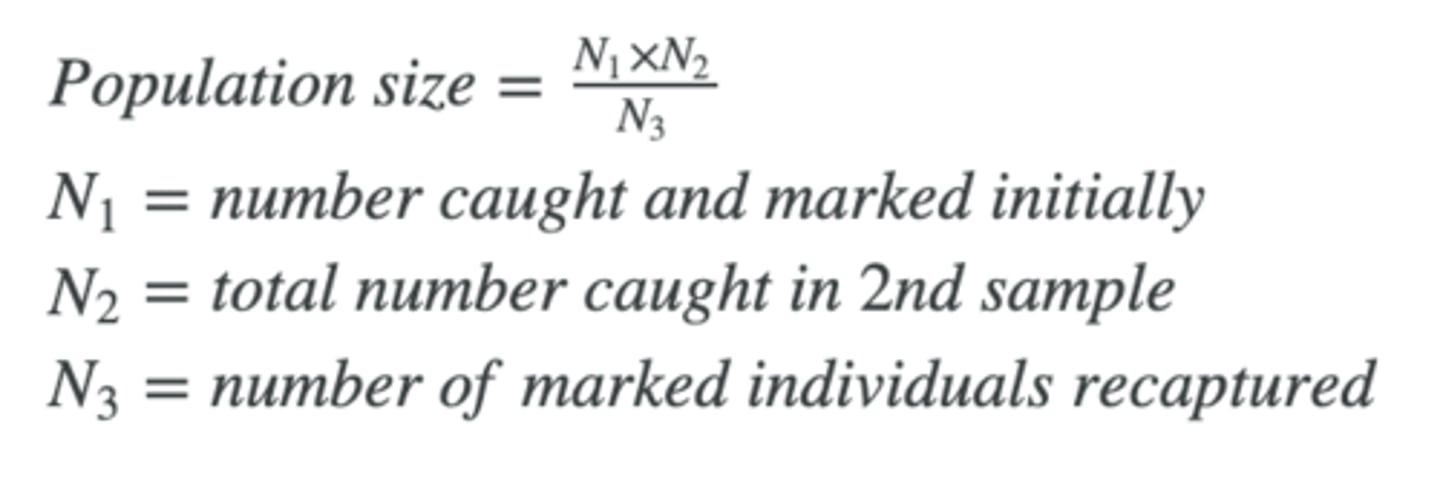
Capture-Mark-Recapture
- measures population of individual species (assuming population does not change, there is random sampling, marks cannot be removed, and there is enough time for marked animals to be randomly dispersed amongst the population)
Questionnaires and Interviews
Pros:
- lots of data in a short period
- typically cheap
- broad info rang
Cons:
- may get too much or too little data
- people are unreliable
- questions may introduce bias
- no verification of data
General Sampling Limitations
- chance of bias
- difficult to get a representative sample
- species may be mis-identified if similar
- results may be skewed by inconsistent counting
Lincoln Index
- based on Capture-Mark-Recapture
(example problem in 2.3 ppt slide 29)
Species Richness
the number of species in a community
Species Evenness
a measure of relative abundance of the populations of different species in an area
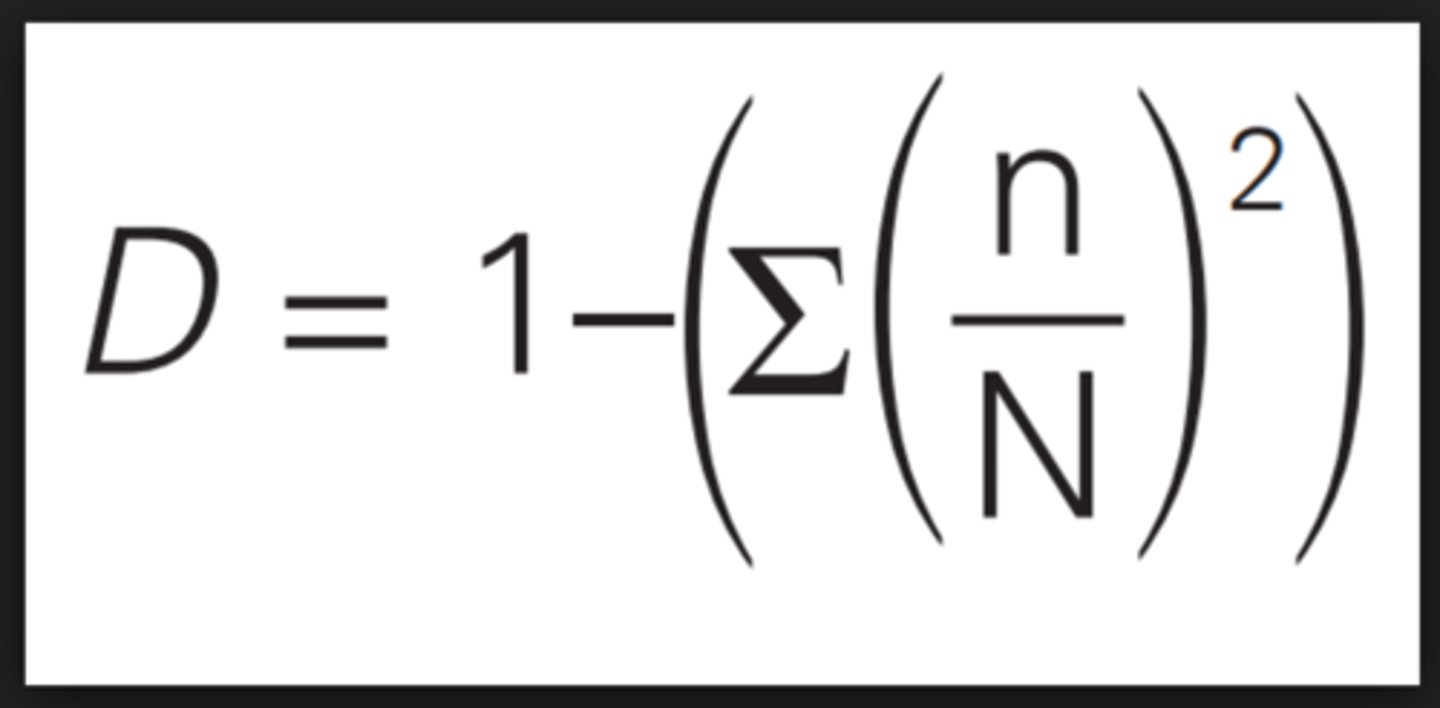
Simpson's Index of Diversity
- used to quantify an area's biodiversity by comparing species richness and species evenness
- max diversity is 1 and minimum diversity is 0 (0-1 range)
- example on 2.3 ppt slide 35
ACFOR
- good for quick and easy sampling
- Abundant, Common, Frequent, Occasional, Rare
- subjective and not quantitative
Calculate Relative Species Abundance
# of species from one group/total # of species from all groups
Methods of Data Collection (Technology Specific)
- geospatial systems
- satellite sensors
- radio tracking
- computer modeling
- crowdsourcing
Big Data
"extremely large data sets that may be analyzed computationally to reveal patterns, trends, and associations"
Major atmosphere components
NITROGEN, oxygen, carbon dioxide, argon, water vapor
Troposphere
- Temp. decreases with height (adiabatic cooling - convection currents)
- 10-11 km
- "weather layer" because water is here
- densest layer
Stratosphere
- home to the ozone layer
- 20-60 km
- air gets warmer as altitude increases because the ozone layer absorbs UV radiation
Mesosphere
- temperature decreases to nearly 100 C
- low pressure
- meteoroids burn up here
Thermosphere
- up to 1,000 km
- temp. is high due to direct solar radiation
- low pressure and density
- aurora borealis is here because solar energy strips electrons from gas molecules, forming ions
Where is the ozone layer located?
stratosphere
Ozone Layer
- NOT RELATED TO GROUND LEVEL OZONE OR CLIMATE CHANGE
- absorbs UV radiation
- concentration is measured in Dobson units
Aerosals
tiny liquid and solid particles resulting from forest fires, mineral dust from sandstorms, sea spray, volcanic eruptions, and human introduced pollution
- They provide a surface for water to condense (essential in the formation of clouds)
What is climate determined by?
topography, wind and ocean currents, latitude
Albedo
the amount of energy reflected back to space
Surface area of the sun's rays
rays near the poles are diffused, leading to less isolation
Earth's Energy Budget
the culmination of the energy moving through wind and ocean currents (thermohaline circulation)
Carbon Cycle Input and Outputs
Photosynthesis - removes
Respiration - adds
Feeding/Biomass - changes state
Decomposition - adds
Fossilisation - removes
Combustion - adds
Major Carbon Stores
vegetation (TREES) and the ocean
Positive Feedback Loop
initial warning triggers events that amplify the effects of warming (BAD)
Negative Feedback Loop
initial warning triggers events that reduce the effects of global warming (GOOD)
Natural Greenhouse Effect
necessary because GHGs trap heat in the atmosphere (without it the surface temp. would be about -18 C)
natural = good
human-caused = bad
Primary Air Pollution
added directly to the atmosphere
Secondary Air Pollution
results from one or more chemical reactions
Particulates/Aerosols
Sources: dust, diesel engines, power plants, wood burning
Effects: respiratory issues, premature death, worsened lung function, eye irritation, reduced visibility, discoloration of buildings and statues
Removal: use a electrostatic precipitator (removes particulates using static cling) to filter smokestacks
Carbon Monoxide (CO)
Sources: volcanoes, fires/wood burning, fossil fuel burning (specifically petroleum - transportation)
Effects: headaches, dizziness, low oxygen levels (death), heart damage
Removal: regulate car emissions, have developing countries use kerosine stoves instead of wood burning stoves
Carbon Dioxide (CO2)
Sources: volcanoes, forest fires, respiration, burning fossil fuels, car combustion
Effects: climate change = death
Removal: The Paris Climate Agreement
Sulfur Oxides
Sources: BURNING OF COAL
Effects: ACID RAIN, kills crops and forests, kills fish, removes soil nutrients, corrodes stone and metal, respiratory harm
Removal: flue gas (combustion/exhaust from power plants) cleaner
Flue Gas Cleaner
removes SO2 using water
also known as a wet scrubber
Nitrogen Oxides
Sources: TRANSPORTATION (combustion/burning of gasoline)
Effects: lung damage, acid rain, yellow smog
Removal: reduce car emissions, catalytic converter
Catalytic Converter
removes pollutants from motor vehicle exhaust by oxidizing them into CO2 and H2O or reducing them to nitrogen
Volatile Organic Compounds (VOCs)
Sources: car exhaust, paints, varnishes, coatings, petroleum products, perfumes, nail polish (smelly things)
Effects: respiratory issues and some are carcinogenic (mostly harmless though)
Removal: reduce their exposure and classify them as hazardous so they can be regulated
Ground-Level Ozone
Sources: NOx + VOCs + SUN ---> O3 (ground level ozone)
this reaction requires clear and sunny skies
Effects: lung and vegetation damage, smog
Removal: regulate NOx and VOCs
Temperature Inversion
a cooler layer of air is trapped by a warmer layer due to warm fronts (similar concept to anvil clouds)
Urban Heat Island Effect
cities are hotter than their surrounding areas due to...
- paved surfaces and human activities that release heat
- tall buildings reduce albedo
- particulates scatter radiation
Acid Depositions
a mix of air pollutants that deposit from the atmosphere as acidic wet deposition/acid rain (with a pH <5.6) or acidic dry deposition
Wet Deposition
acid rain/snow
Dry Deposition
acidity is incorporated into dust/smoke and fall to the ground
it washes away and, in turn, makes runoff acidic
Formation of Acid Deposition
- 2SO3 + H2O --> H2SO4 (sulfur dioxide reacts with water and oxygen in the atmosphere to form sulfuric acid
- 2NO2 + H2O --> HNO3 + HNO2 (nitrogen monoxide reacts with oxygen and water in the atmosphere to form nitric acid)
Impacts of Acid Deposition
- defoliation as a result of damage to roots and leaves
- reduced crop yield
- chemical weathering of stones and bricks, weakening building structures and eroding significant cultural statues or artifacts
- aluminum in soil washes into waterways, causing fish to produce excess mucus and suffocate
- most fish eggs cannot hatch at pH 5
Photochemical Smog
a mixture of air pollutants and particulates, including ground level
ozone, that is formed when oxides of nitrogen and volatile organic compounds (VOCs) react in the
presence of sunlight
Impacts:
- eye and respiratory irritation
- decreased crop yields
- deterioration of plastics and rubber
Strategies for Managing Air Pollution
- reduced use of fossil fuels
- reducing...
-> SO2 using flue gas cleaners
-> oxides and nitrogen with catalytic converters
-> particulates with electrostatic precipitators
-> VOCs with safe disposal
-> vehicle emissions
- legislation
- polluter pays principal
Ozone Depletion
The basics:
1. UV radiation from the sun breaks down CFCs which releases a Chlorine atom
2. The Chlorine atom breaks apart an ozone molecule
3. The reaction happens over and over
Extra info:
- CFCs from aerosols and refrigerants do not break down in the troposphere and float up to the stratosphere
Ozone Hole
an area where the average concentration of ozone is below 200 Dobson Units
Why has ozone depletion been the greatest over Antarctica?
- the polar vortex: strong winds encircle the poles during the long winter periods and the circular vortex this creates traps air movement into and out of the region for months
- polar stratospheric clouds (PSCs): special clouds formed in low temperatures (<-100F) and high altitudes (80,000 ft) that concentrate CFCs, speeding up ozone depletion
Impacts of Ozone Depletion
increase UV radiation leading to:
- human health issues (cataracts, skin cancer)
- decreased crop yields
- loss of biodiversity in terrestrial and aquatic ecosystems
- degradation of materials used in clothing and construction
International Agreements
The Montreal Protocol (1987) - The signed countries pledged to regulate their usage of ozone-depleting chemicals (It worked!)
HCFCs
a substitute for ozone-depleting substances
however, it has a global warming potential 1,430x that of CO2
F-gases
a substitute for ozone-depleting substances
however, it has a global warming potential 23,000x that of CO2
Rowland-Molina Ozone Destruction Hypothesis
Rowland and Molina discovered that CFCs were depleting the ozone layer but their hypothesis was originally not accepted.
However, further research and data was collected by others and the theory was confirmed.
Greenhouse Gases
gases in the atmosphere that absorb infrared radiation
- Carbon dioxide
- Water vapor
- Methane
Why are scientists more worried about CO2 than methane?
Methane is more potent but CO2 stays in the atmosphere for longer (about 100 years) and CO2 is more abundant.
Major Sources of Greenhouse Gases
- combustion of fossil fuels (CO2 and H2O)
- rice fields, livestock, landfill sites (methane)
How do greenhouse gases lead to global warming?
Shortwave UV radiation from the sun is absorbed by the Earth's surface and re-radiated out as longwave IR radiation. GHGs trap longwave IR radiation that would otherwise return to space. The GHGs then re-radiate this heat back into the troposphere.
Difficulties of Monitoring and Predicting Climate Change
- Climate change cannot be linked to a single events and therefore its monitoring and predicting is reliant on shifting probability curves and long term trends
- Models can vary and show a range of projections so predictions may differ (though they are fairly consistent in that things are pretty bad)
- Proxy tools need to be used to determine historical climate change (ex. tree rings, ice cores, and rock composition) but there is still limited historical data
- Political opinions vary
Impacts of Climate Change
- Temperature increase and changing rain patterns (droughts, coral bleaching, loss of biodiversity)
- Sea level rises due to meltwater and thermal expansion
- Ocean and wind currents can change due to temperature differences
- Melting sea ice, ice sheets, glaciers, and permafrost from the bottom up (habitat loss, sea level rise, loss of biodiversity, flooding)
- Less ice means the Earth absorbs more energy and heats faster (less albedo)
- Ice stores carbon that releases when it melts
- More extreme weather events (damage property and loss of life)
- Food insecurity (due to drought, increased food prices, less crop yield, etc.)
- Less food, energy, and water security
How does climate change impact human populations?
- forced migration (loss of homes and farmland)
- increased drought and desertification
- negative impacts of some economic activities (ex. tourism)
Strategies to reduce GHG Emissions
- fewer children per women
- plant-based diets!!
- energy-efficient lifestyles (ex. bikes, public transportation)
- reduce deforestation (trees are carbon stores)
- changing energy policies (less fossil fuels)
- better urban design policies (see notes)
- international agreements
Geo-Engineering Strategies to Counteract Climate Change
Solar Radiation Management (SRM)
a theoretical approach for reducing some of the impacts of climate change and involves reflecting a small amount of sunlight back out into space (albedo enhancement)
ex.
- spraying seawater into the lower atmosphere to brighten marine clouds
- spraying sulfate particles into the stratosphere to reflect sunlight
Population Density Formula
# of people/area
Growth Rate
% increase of population size over time; affected by (birth-death) and (immigration-emigration)
Crude Death/Birth Rate
# per 1,000 individuals
Dependency Ratio
- a measure of the ratio of the number of dependents to the total work-age population in a country or region
(dependents = people too young/old to work)
- increased ratio means financial problems for government (a ratio of 60 means that, for every 100 workers, 60 people depend on them)
DR = [(% of pop 0-14 + % of pop 65 +)/(% of pop 15-65)]x100
- example on Unit 3 Review Slide 12
- typically higher in LICs because there are more kids
Total Fertility Rate (TFR)
estimate of the average # of children one woman will have