Population Ecology
1/104
Earn XP
Name | Mastery | Learn | Test | Matching | Spaced | Call with Kai |
|---|
No analytics yet
Send a link to your students to track their progress
105 Terms
What are three different organizational levels in ecology?
1. Population ecology
2. Community ecology
3. Ecosystem ecology
What three things do dynamic biological processes influence?
1. Population density
2. Dispersion
3. Demographics
What two pieces of data are needed to mathemetically determine density?
1. Mass
2. Volume
density
the number of individuals per unit area or volume
dispersion
the pattern of spacing among individuals within the boundaries of a population
What is the difference between density and dispersion?
Density is the number of individuals per unit area or volume while dispersion is the pattern of spacing among individuals within the boundaries of a population
What does N mean in the following formula: N = sn|x
The estimated population size
What does the s mean in the following formula: N = sn|x?
The number of individuals marked and released in the first sampling
What does n mean in the following formula: N = sn|x?
The total number of individuals captured in the second sampling
What does x mean in the following formula: N = sn|x?
The number of marked individuals captured in the second sampling
A population ecologist wishes to determine the size of a population of white-footed deer mice, Peromyscus leucopus, in a 1-hectare field. Her first trapping yielded 80 mice, all of which were marked with a dab of purple hair due on the back of the neck. Two weeks later, the trapping was repeated. This time 75 mice were trapped, out of which 48 were marked. What is the population of mice in the field?
125 white-footed deer mice
Explain the impact of immigration and emigration on population density
Additions to populations occur through birth and immigration. Death and emigration remove individuals from a population.
immigration
the influx of new individuals into a population from other areas
emigration
the movement or exiting of individuals out of a population
What do dispersion patterns tell one about the population and its interactions?
Most populations show at least a tendency toward clumped distribution. Many animals group together where resources are abundant. Clumping may increase the effectiveness of predation or defense, and can also be associated with mating behavior. A uniform pattern of dispersion may result from direct interactions between individuals in the population. Some plants secrete chemicals that inhibit the germination and growth of nearby individuals that could compete for resources. Animals often exhibit uniform dispersion as a result of antagonistic social interactions, such as territoriality. In random dispersion, the position of each individual in a population is independent of other individuals. This pattern occurs in the absence of strong attractions or repulsions among individuals or where key physical or chemical factors are relatively constant across the study area.
In what population statistics do demographics have a particular interest?
Vital
Name three ways that vital statistics is presented.
1. Birth rates
2. Deaths
3. Life tables
demography
the study of changes over time in the vital statistics of populations, especially birth rates and deaths
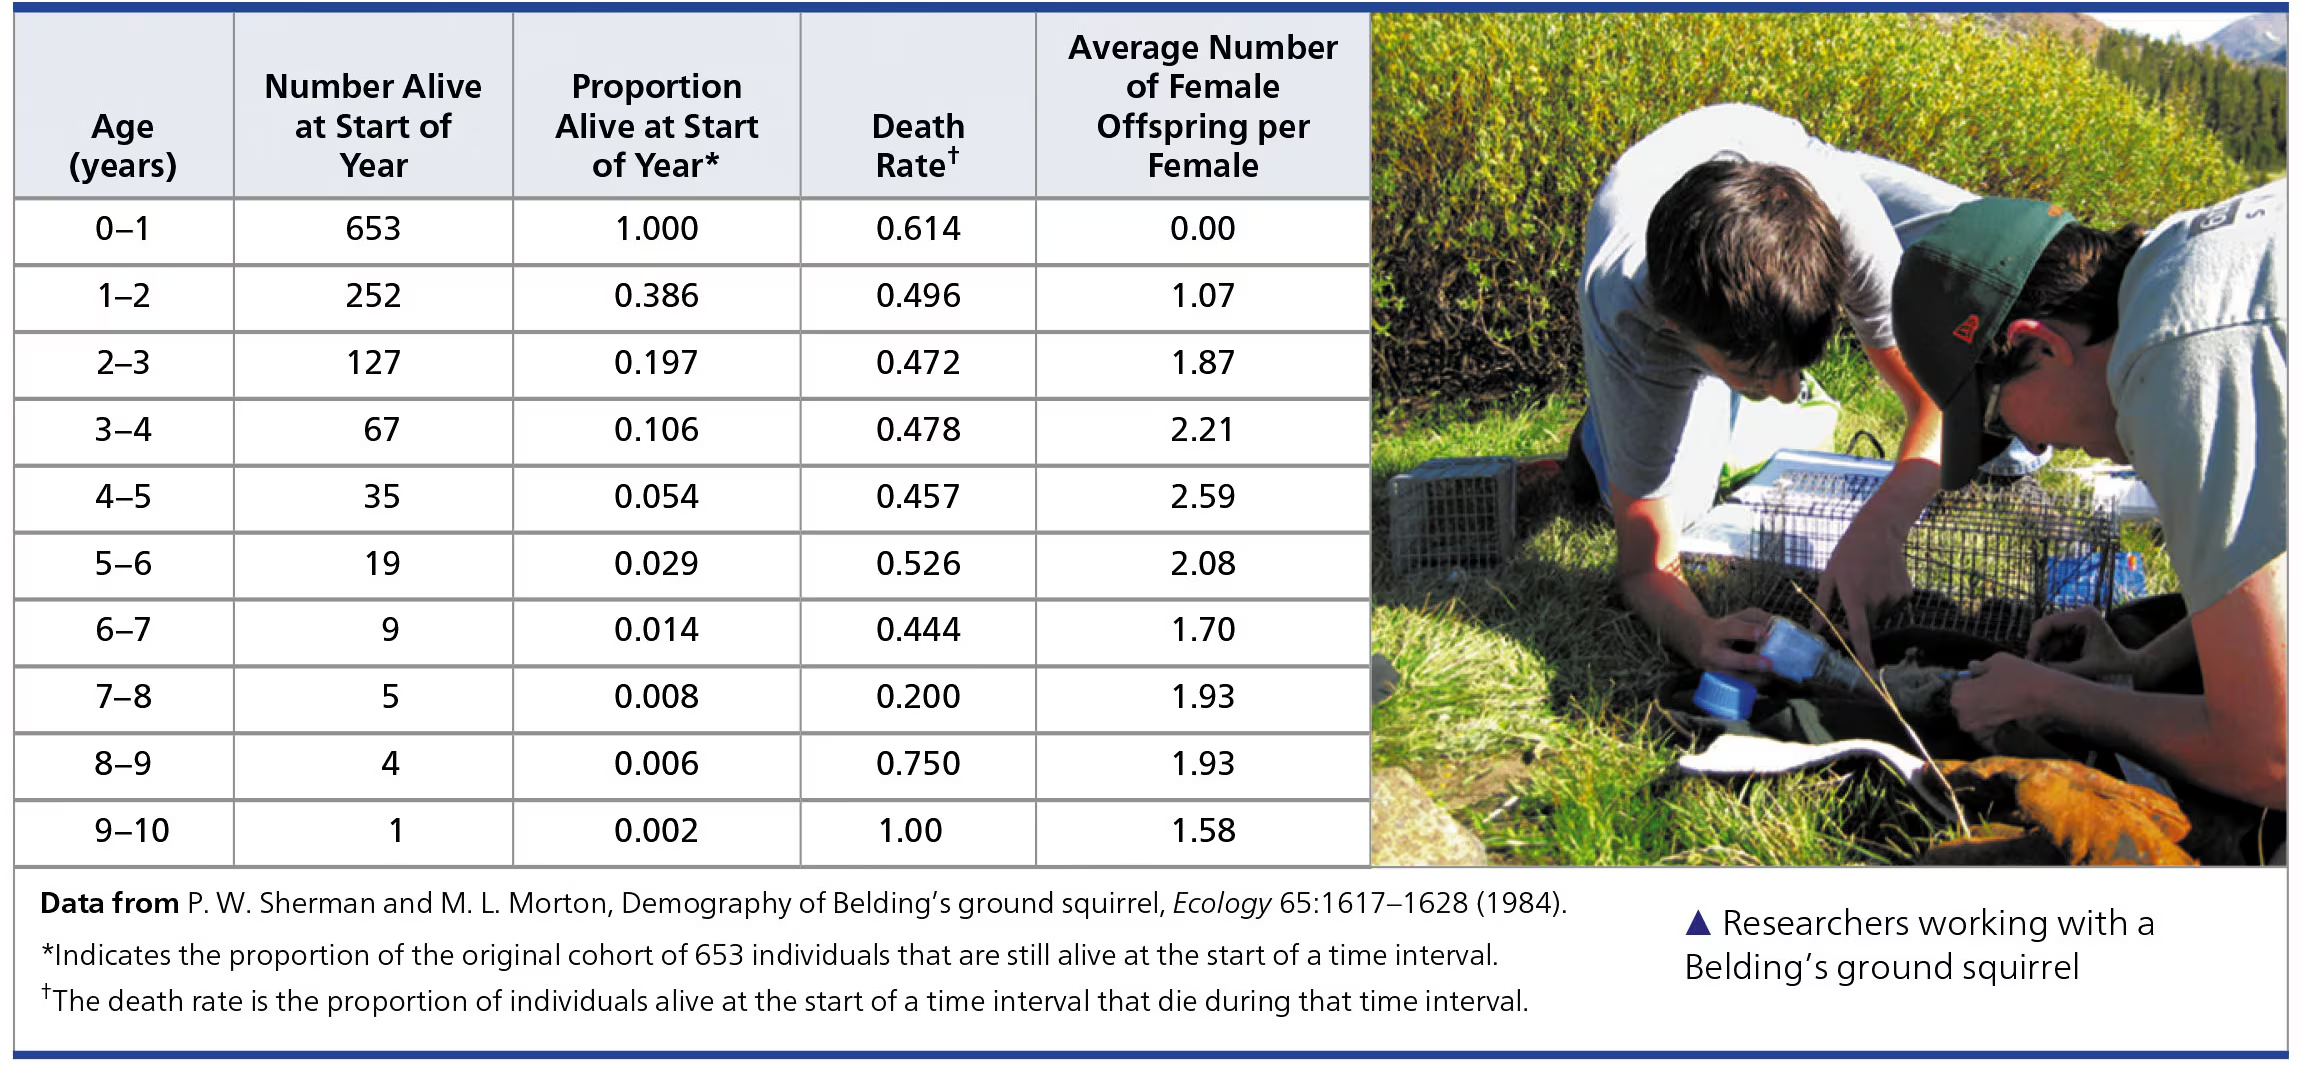
life table, reproductive table, fertility schedule
a summary of the age-specific survival and reproductive rates of individuals in a population
Is your AP BIO class a cohort? Explain
Not everyone is the same age. People are in different grades, so it is not a cohort.
cohort
a group of individuals of the same age in a population
Survivorship curves show patterns of survival. In general terms, survivorship curves can be classified into three types. Name the three idealized survivorship patterns
1. Type I
2. Type II
3. Type III
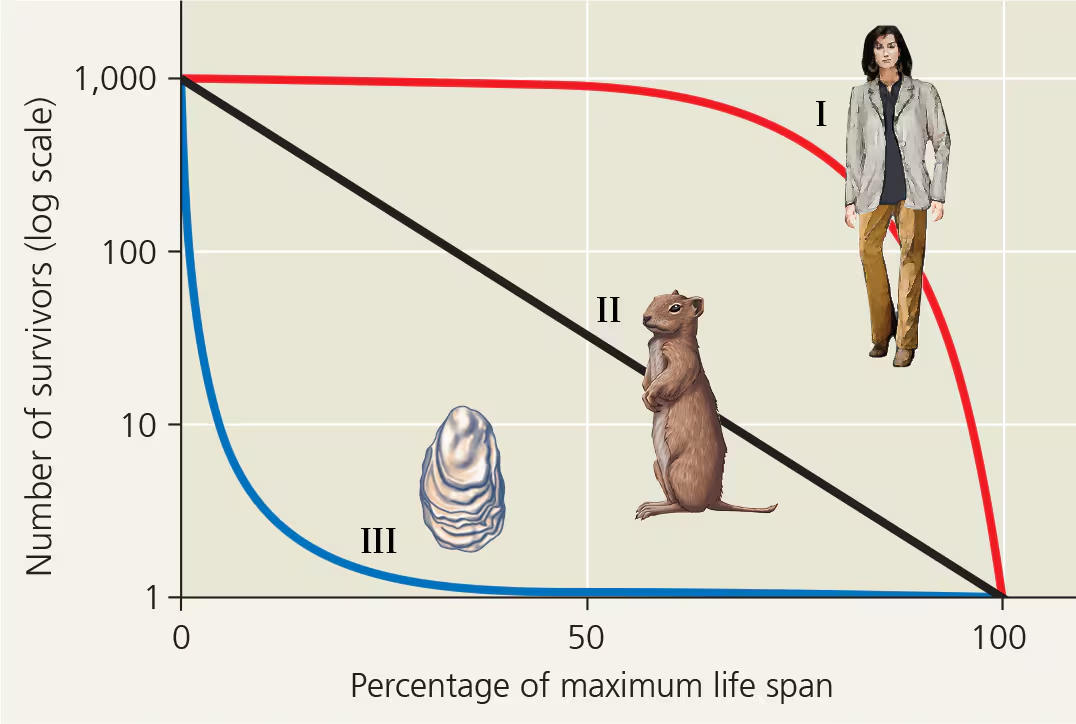
Describe Type I of an idealized survivorship pattern
It is a curve that is flat at the start, reflecting low deaths during early and middle life, then drops steeply as death rates increase among older-age groups.
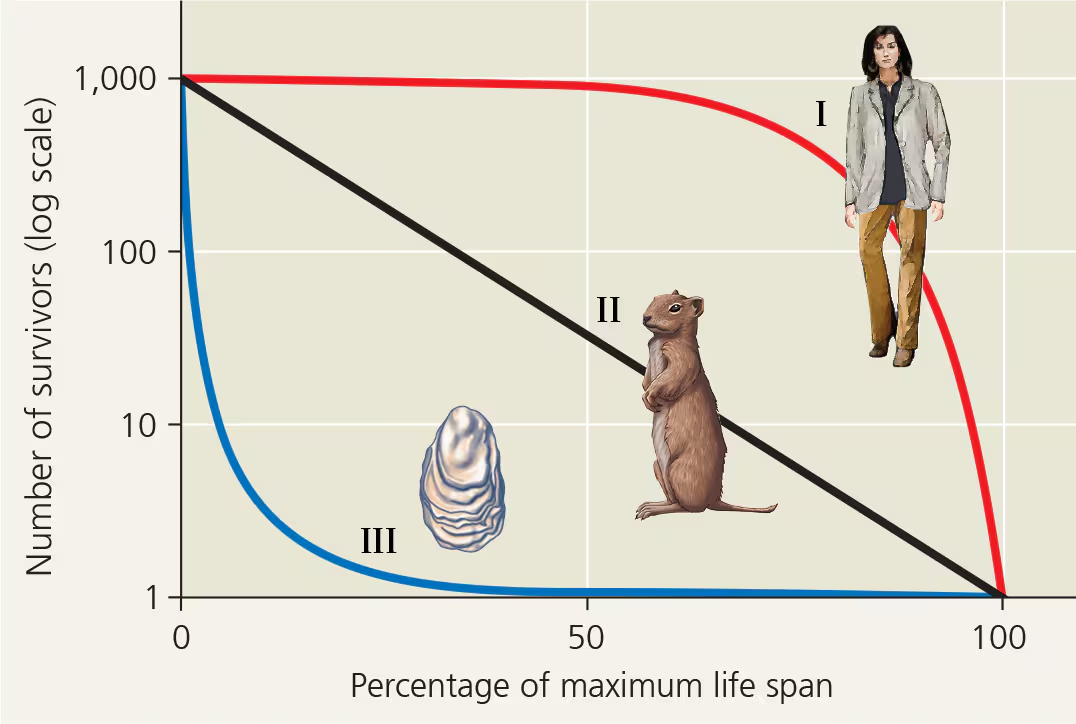
What organisms exhibit Type I of an idealized survivorship pattern?
Many large mammals, including humans, that produce few offspring but provide them with good care
Describe Type II of an idealized survivorship pattern
Its curves are intermediate, with a constant death rate over the organism’s life span.
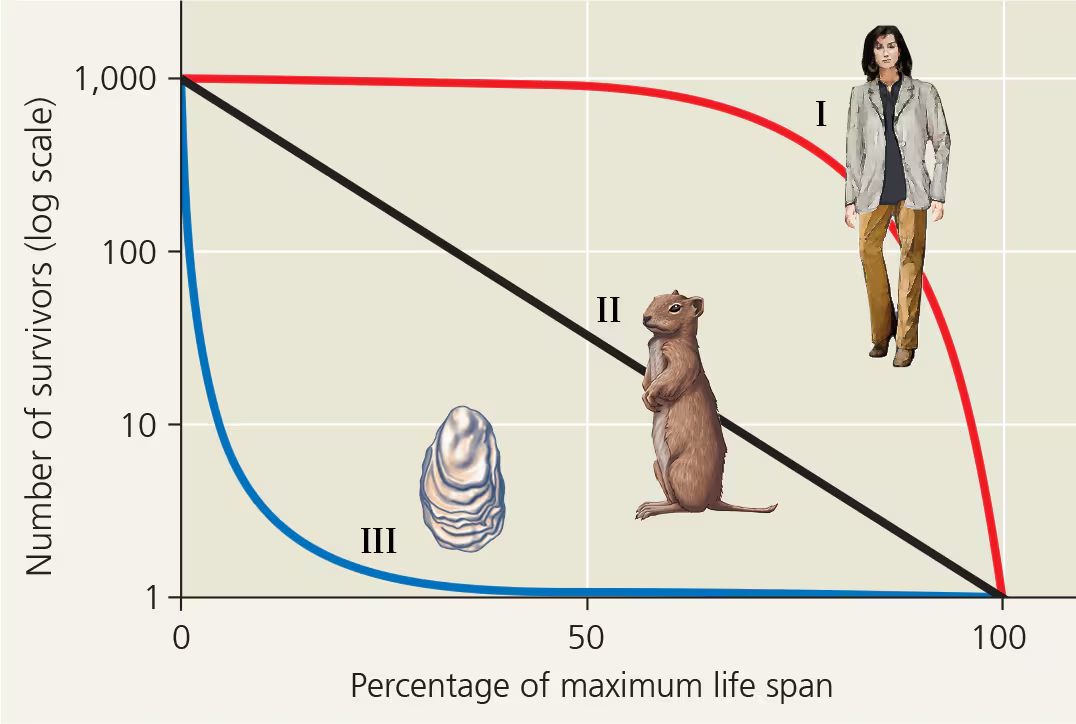
Name four types of organisms that Type II of an idealized survivorship pattern occurs in.
1. Rodents
2. Invertebrates
3. Lizards
4. Annual plants
Describe Type III of an idealized survivorship pattern
It is a curve that drops sharply at the start, reflecting very high death rates for the young, but flattens out as death rates decline for those few individuals that survive the early period of die-off.
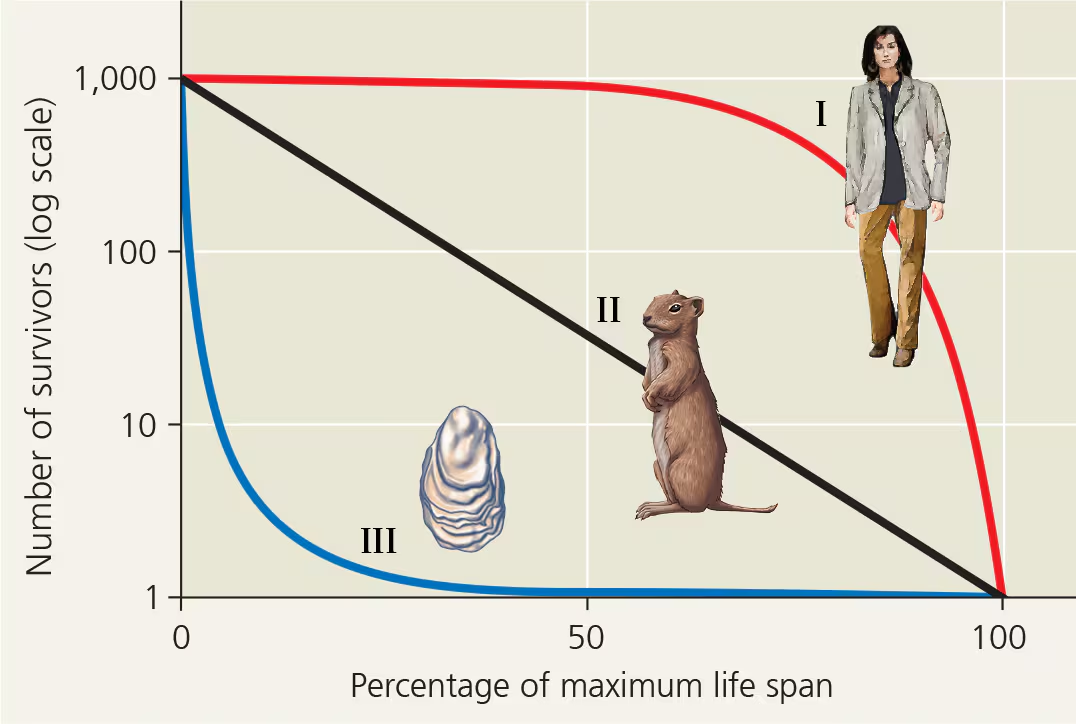
What king of organisms is Type III of an idealized survivorship pattern associated with?
Organisms that produce very large numbers of offspring but provide little or no care
Give three examples of the organisms that are associated with Type III of an idealized survivorship pattern
1. Long-lived plants
2. Fish
3. Marine invertebrates
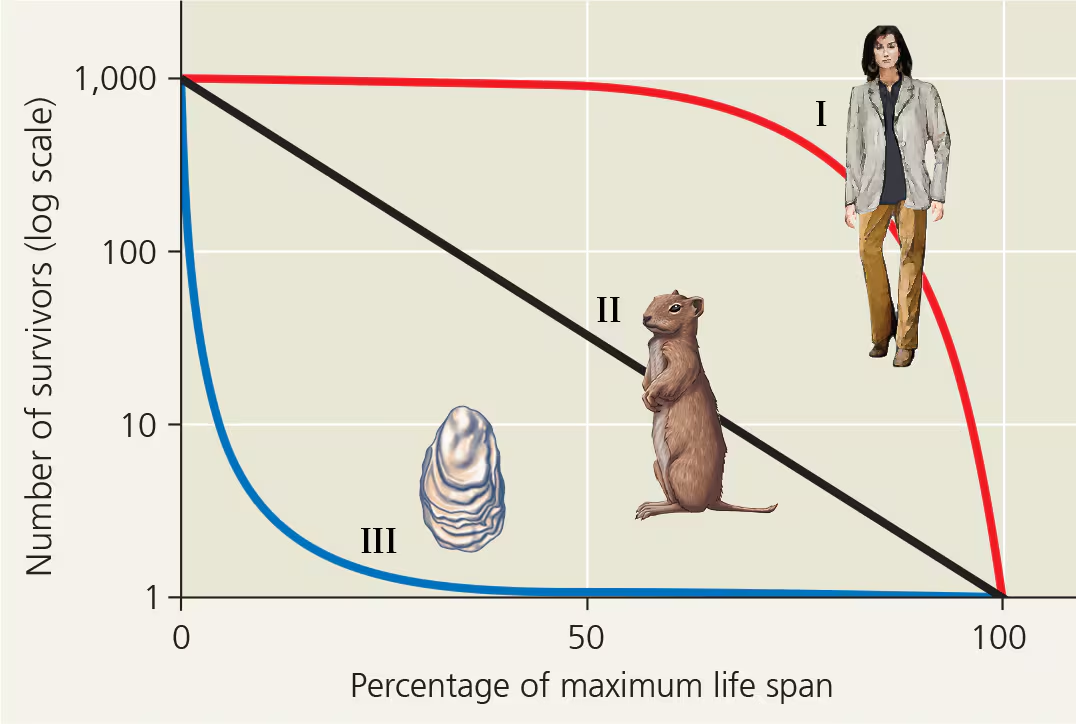
survivorship curve
a plot of the number of members of a cohort that are still alive at each age, a way to present age-specific mortality
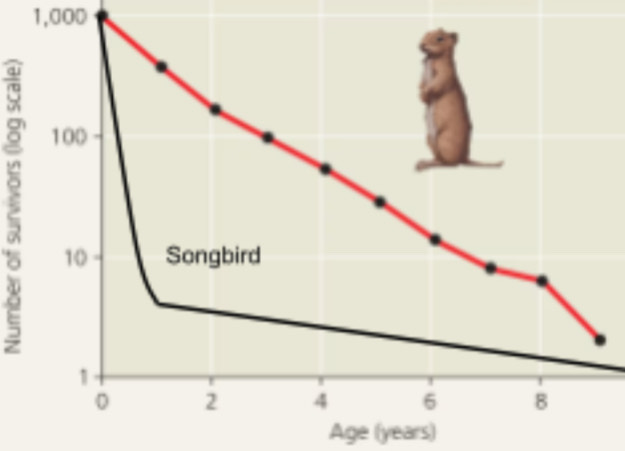
In the natural world, many species show survivorship curves that are combinations of the standard curves. How would an open nesting songbird’s survivorship curve appear if it was Type III for the first year and then Type II for the rest of its life?
The first part of the curve would fall sharply and then angle over
What does a reproductive table show?
It shows a summary of the reproductive rates in a population. It is constructed by measuring the reproductive output of a cohort from birth until death. For a sexual species, the reproductive table tallies the number of female offspring produced by each age-group.
reproductive output
the product of the proportion of females of a given age that are breeding and the number of female offspring of those breeding females in sexual organisms
What are the products of natural selection?
Life history traits
On what is the life history of an organism based?
The traits that affect an organism’s schedule of reproduction and survival
life history
the traits that affect an organism’s schedule of reproduction and survival
Name three variables that form the life history of a species
1. When reproduction begins
2. How often the organisms reproduce
3. How many offspring are produced per reproductive episode
Explain the difference between semelparity (big-band reproduction) and iteroparity (repeated reproduction) as life history strategies
Semelparity is a “one-shot” pattern of big-bang reproduction favored when the survival rate of offspring is low, typically in highly variable and unpredictable environments. Individuals typically die just after mass-producing eggs or sperm. In contrast, in iteroparity, organisms produce relatively few but large offspring each time they reproduce, and they provision the offspring better, a method that may be favored in more dependable environments, where adults are more likely to survive to breed again and competition for resources may be intense.
semelparity, big-bang reproduction
reproduction in which an organism produces all of its offspring in a single event
iteroparity, repeated reproduction
reproduction in which adults produce offspring over many years
What two critical factors influence whether a species will evolve toward semelparity or iteroparity?
1. The likelihood that the adult will survive to reproduce again
2. The survival rate of the offspring
Describe the two critical factors that influence whether a species will evolve toward semelparity or iteroparity
No organism can produce as many offspring as a semelparous species and provision them as well as an iteroparous species. There is a trade-off between reproduction and survival. Plants and animals whose young are subject to high mortality rates often produce large numbers of relatively small offspring. Small seeds can be carried longer distances to a broader range of habitats. In other organisms, extra investment on the part of the parent greatly increases the offspring’s chances of survival, especially in habitats with high population densities.
Explain the effect of offspring care on parental survival in kestrels
A study of European kestrels demonstrated a survival cost to parents that care for a large number of young
What does the exponential model do?
Describes population growth in an idealized, unlimited environment
Concentrate on the idea of exponential growth, how it is graphed, and what this type of growth indicates about a population when it comes to the math.
Concentrate on the idea of exponential growth, how it is graphed, and what this type of growth indicates about a population when it comes to the math
What is the advantage to using per capita birth and death rates rather than just raw numbers of births and deaths?
If one knows the annual per capita birth rate, one can calculate the number of births per year in a population of any size. Similarly, the per capita death rate allows one to calculate the expected number of deaths per unit time in a population of any size
per capita birth rate
the number of offspring produced per unit time by an average member of a population
per capita death rate
the number of offspring deaths per unit time of average members of a population
What will the per capita birth and death rates be if a population is demonstrating zero population growth?
They would be equal
zero population growth (ZPC)
when the per capita birth and death rates are equal
What does it mean for a population to be in exponential growth?
A population increases under ideal conditions in which the per capita rate of increase may assume the maximum rate for the species. The size of a population that is growing exponentially increases at a constant rate, resulting in a J shaped curve
exponential population growth, geometric population growth
the growth of a population in an ideal, unlimited environment, represented by a J-shaped curve when population size is plotted over time
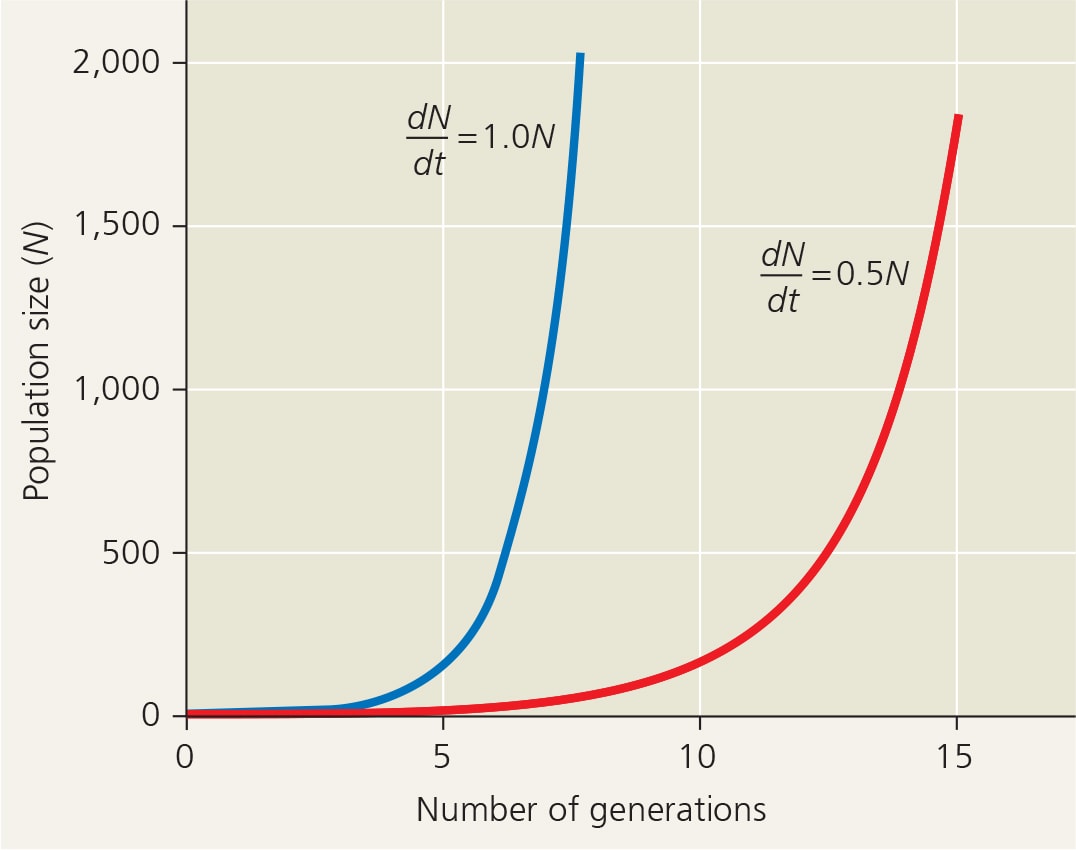
Explain why the line with the value of 1.0 shows a steeper slope that reaches exponential growth more quickly than does the line with the value 0.5.
Increasing the value of the maximum rate for the species from 0.5 to 1.0 increases the rate of rise in population size over time because the population accumulates more new individuals per unit of time when the rate is larger than when it is small.
Give two examples of conditions that might lead to exponential population growth in natural populations.
1. Population is introduced into a new environment
2. Population numbers have been drastically reduced by a catastrophic event and are rebounding
What does a logistic model describe?
How a population grows more slowly as it nears its carrying capacity
carrying capacity
the maximum population size that can be supported by the available resources, symbolized by K
Name six limiting resources or factors that can influence carrying capacity
1. Energy
2. Shelter
3. Refuge from predators
4. Nutrient availability
5. Water
6. Suitable nesting sites
In the logistic population growth model, the per capita rate of increase approaches zero as the ______ is reached
carrying capacity
logistic population growth
population growth that levels off as population size approaches carrying capacity
If K is 1,000 and N is 10, the term (K - N)|K is large. Explain why a large value for (K - N)|K predicts growth with close to the maximum rate of increase for this population.
When N is small compared to K, the term (K - N)|K is close to 1, and the per capita rate of increase approaches the maximum rate of increase. But when N is large and resources are limited, then (K - N)|K is close to 0, and the per capita rate of increase is small. When N = K, the population stops growing.
Explain the parts of the term (K - N)|K
K - N = the number of additional individuals the environment can support
(K - N)|K = the fraction of K that is still available for population growth
Explain why the logistic model predicts a sigmoid growth curve when the population density is plotted over time. The critical part of this answer concerns why growth slows as N approaches K.
The rate of population growth decreases as N approaches the K of the environment. New individuals are added to the population most rapidly at intermediate population sizes, when there is not only a breeding population of substantial size, but also lots of available space and other resources in the environment.
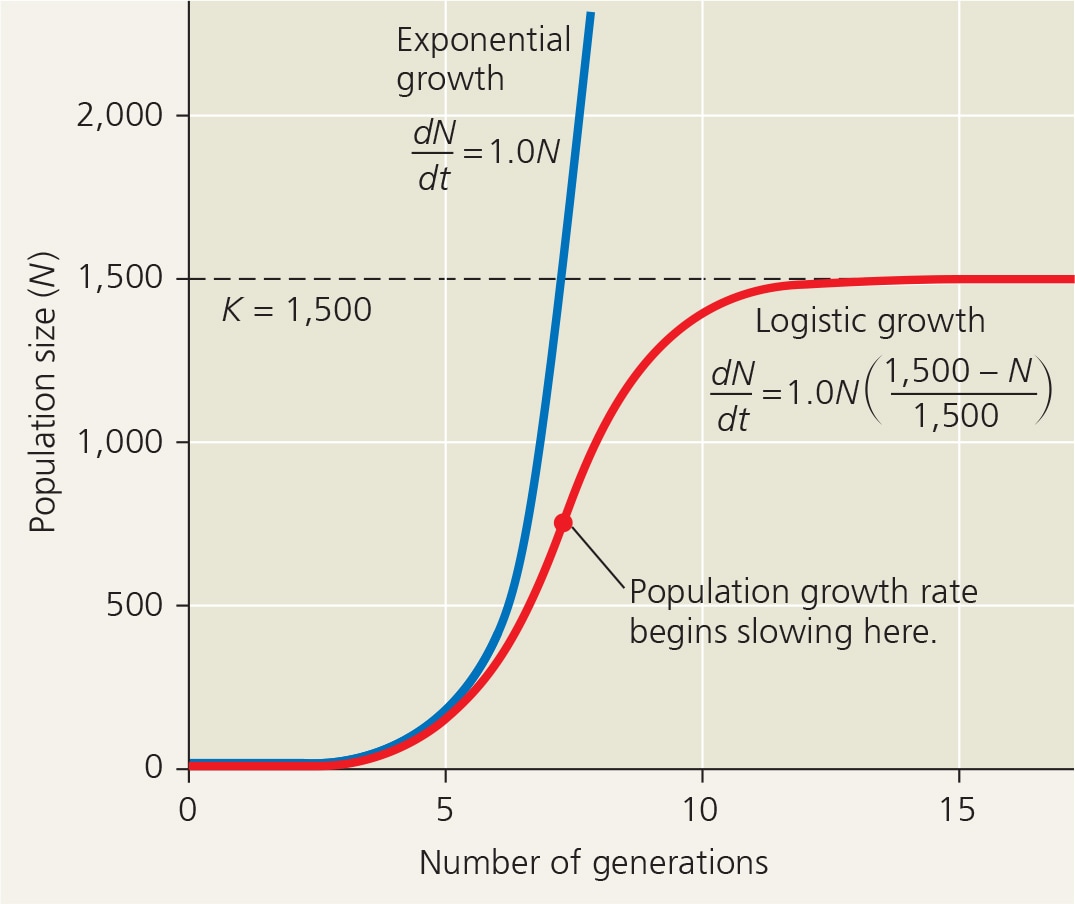
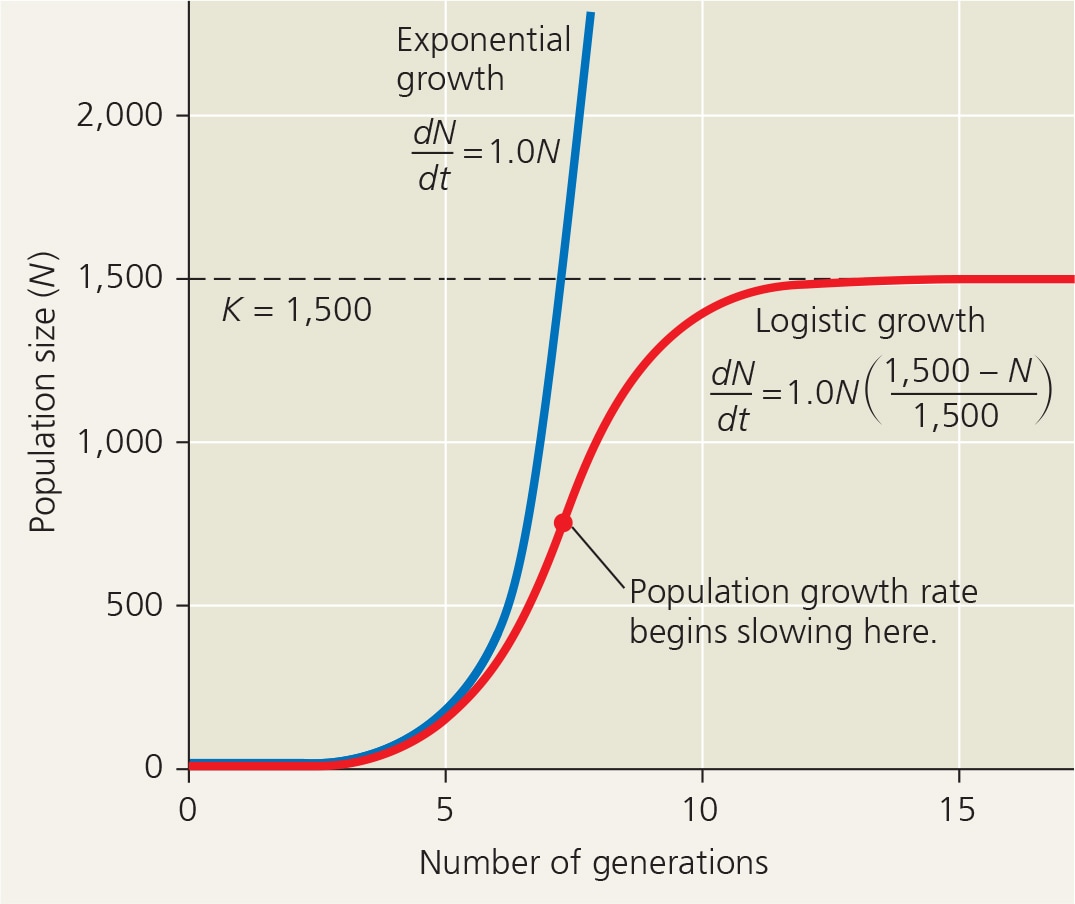
sigmond
S-shaped
Bring together life histories and growth models. Explain the ideas behind the creation of the terms K-selection and r-selection.
Selection for traits that are favored at high densities is known as K-selection. In contrast, r-selection occurs in low density environments. K-selection is said to operate in populations living at a density near the limit imposed by their resources, where competition among individuals is stronger, while r-selection is said to maximize r, the per capita rated increases, and occurs in environments in which population densities are well below carrying capacity or individuals face little competition. Such conditions are often found in disturbed habitats.
K-selection, density dependent selection
selection for life history traits that are sensitive to population density
r-selection, density-independent selection
selection for life history traits that maximize reproductive success in uncrowded environments
Compare and contrast density-independent and dependent regulation.
Density-independent regulation describes births and death rates that do not change with population density while density-dependent regulation describes birth and deaths rates that do change with population density
density-independent regulation
a term used to describe birth and death rates that do not change with population density
density-dependent regulation
a term used to describe death rates that rise as population density rise or birth rates that fall with rising density
Explain how negative feedback plays an essential role in the unifying theme of regulation of population
Without some type of negative feedback between population density and the rate of births and deaths, a population would never stop growing
Does negative feedback play a role in both density-dependent and density-independent regulation?
Density-dependent regulation provides that feedback, halting population growth through mechanisms that reduce birth births or increase death rates.
What are the six density-dependent regulation methods or negative feedback mechanisms for a population?
1. Competition for resources
2. Territoriality
3. Disease
4. Predation
5. Toxic waste
6. Intrinsic factor
Explain how competition for resources acts as a negative feedback mechanism that affects density-dependent regulation in populations
Increasing population density intensifies competition for nutrients and other resources, reducing reproductive rates
Give an example of how competition for resources acts as a negative feedback mechanism in density-dependent regulation for a population
It can cause nutrient limitations on crop yields
territoriality
a behavior in which an animal defends a bounded physical space against encroachment by other individuals, usually of its own species
Explain how territoriality acts as a negative feedback mechanism that affects density-dependent regulation in a population
If space becomes the resource for which individuals compete, reproductive rates reduce
Give an example of how territoriality acts as a negative feedback mechanism that affects density-dependent population regulation
Cheetahs use a chemical marker in urine to warn other cheetahs of their territorial boundaries
Explain how disease acts as a negative feedback mechanism that affects density-dependent population regulation
If transmission rate depends on a certain level of crowding in a population, reproductive rates reduce
Give an example of how disease acts as negative feedback mechanism that affects density-dependent population regulation
Influenza infects a greater percentage of human populations in density populated cities than in rural areas
predation
an interaction in which an individual of one species, the predator, kills and eats an individual of the other species, the prey
Explain how predation acts as a negative feedback mechanism in density-dependent population regulation
If predators capture more food as the population density of the increases o predators feel preferentially on the rapidly growing species, reproductive rates reduce
Give an example of how predation acts as a negative feedback mechanism in density-dependent population regulation
Cutthroat trout concentrate for a few days on a particular insect species emerging from its aquatic larval stage, than switch to another prey species when it becomes more abundant
Explain how toxic waste acts as a negative feedback mechanism in density-dependent population regulation
Individuals in the species die as their toxic waste builds up
Give an example of how toxic waste acts as a negative feedback mechanism in density-dependent population regulation
Alcohol content of wine is usually less than 13% because that is the maximum ethanol concentration most wine-producing yeast cells can tolerate
Explain how intrinsic factors act as a negative feedback mechanism in density-dependent population regulation
Intrinsic physiological factors can reduce reproductive rates
Give an example of how intrinsic factors act as a negative feedback mechanism in density-dependent population regulation
Aggressive interactions in hormonal changes in white-footed mice that delay sexual maturation and depress the immune system reduces reproductive rates.
Give both biotic and abiotic reasons for population fluctuations over the last 50 years in the moose population in Isle, Royale, based on population dynamics
The first population collapse coincided with a peak in the number of predatory wolves in 1975 to 1980. The second collapse, around 1995, coincided with the harsh winter weather, which increased the energy needs of the animals and made it harder for the moose to find food under the deep snow
population dynamics
the study of how complex interactions between biotic and abiotic factors influence variations in population size
Explain the importance of immigration and emigration in metapopulations
Immigration and emigration are particularly important when a number of local population are linked, forming a metapopulation. Local populations in a metapopulation can be thought of as occupying discrete patches of suitable habitat in a sea of otherwise unsuitable habitat. Patches with many individuals can supply more emigrants to other patches.
metapopulation
a group of spatially separated populations of one species that interact through immigration and emigration
Describe the growth of the human population
It is no longer growing exponentially but is still increasing rapidly
Summarize human population growth since 1650 through reported statistics
The global human population has steadily grown almost continuously throughout history, but skyrocketed after the Industrial Revolution. The rate of population growth has slowed in recent decades, mainly as a result of decreased birth rates worldwide.
demographic transition
a shift from high birth and death rates to low birth and deaths rates in a stable population
Explain the process of demographic transition in Sweden and Mexico
Demographic transition tends to accompany industrialization and improved living conditions. In Sweden, this transition took about 150 years, from 1810 to 1960, when birth rates finally approached death rates. In Mexico, where the human population is still growing rapidly, the transition is projected to take until at least 2050. Demographic transition is associated with an increase in the quality of healthcare and sanitation as well as improved access education, especially for women
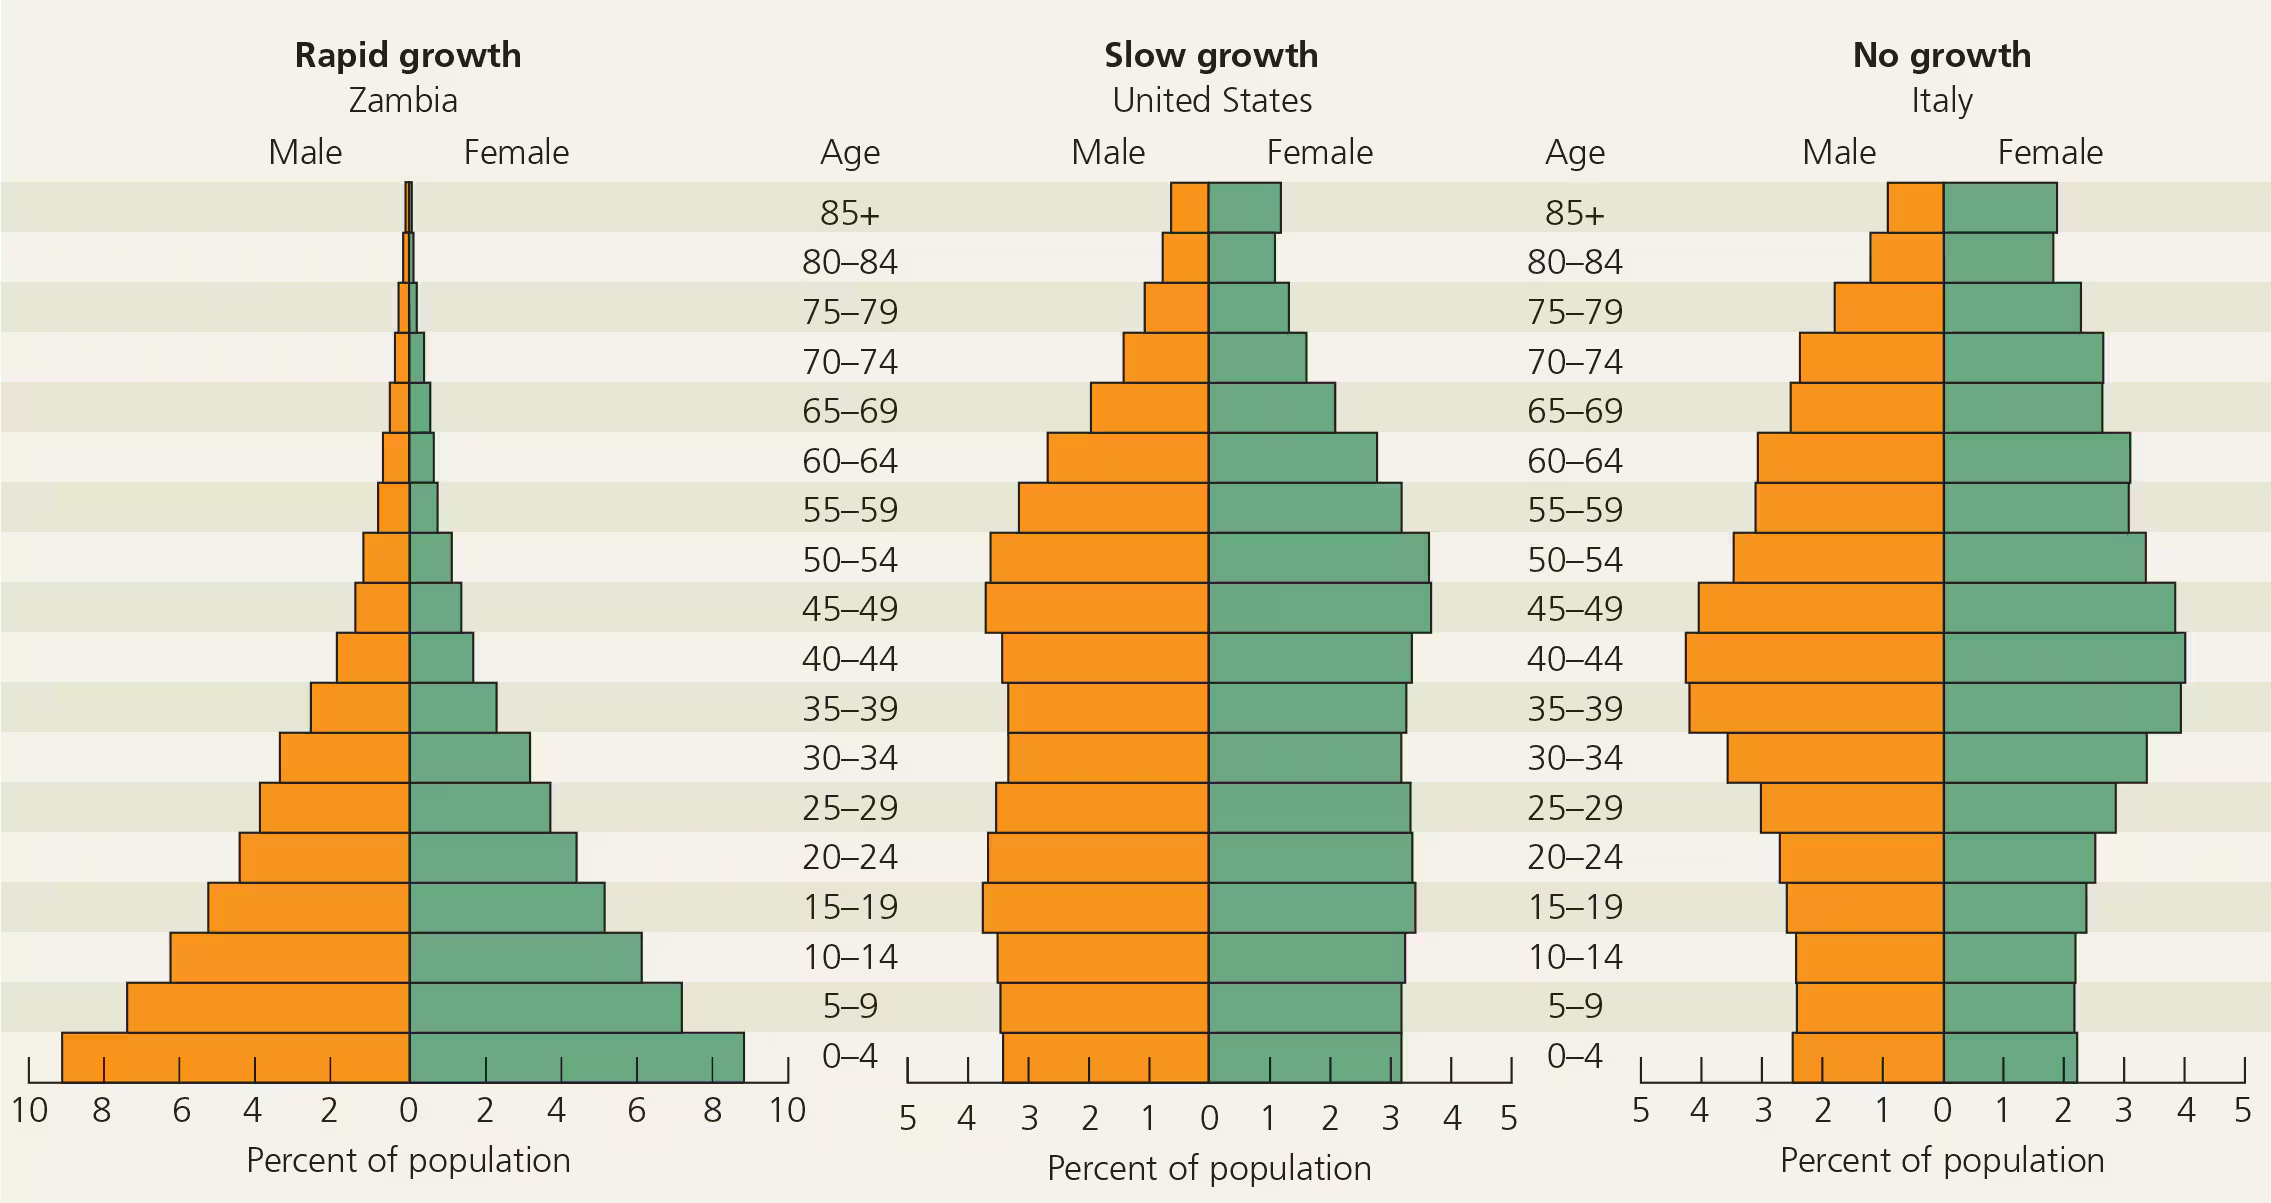
Look at the age-structure graph and describe the key features for Zambia
It is bottom heavy, skewed toward younger people who will perhaps sustain the explosive growth
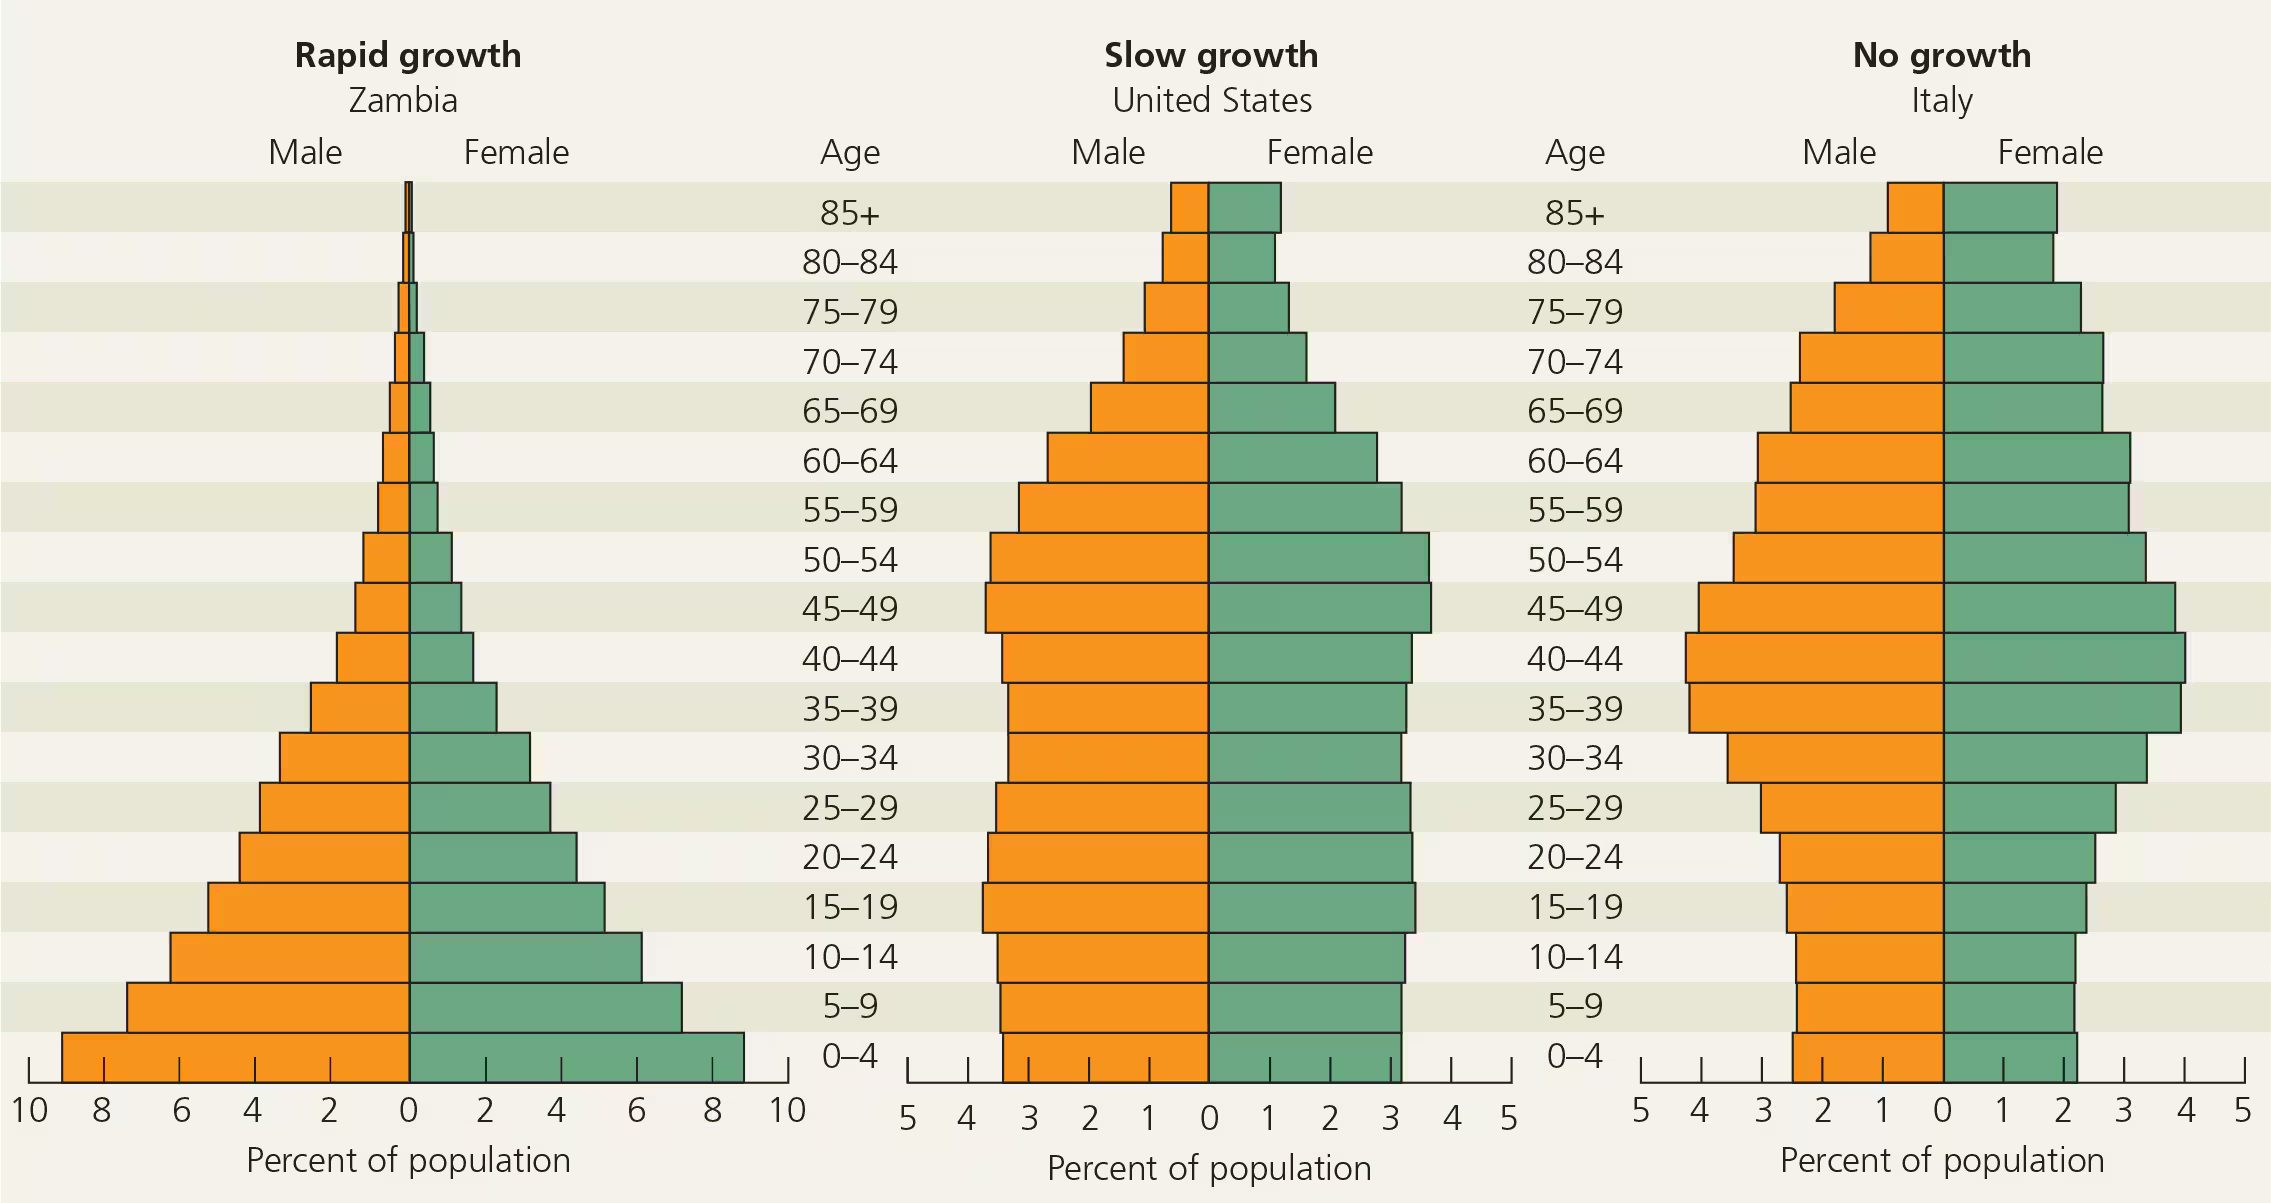
Look at the age-structure graph and predict how the population of Zambia will grow in the future
It will continue to grow
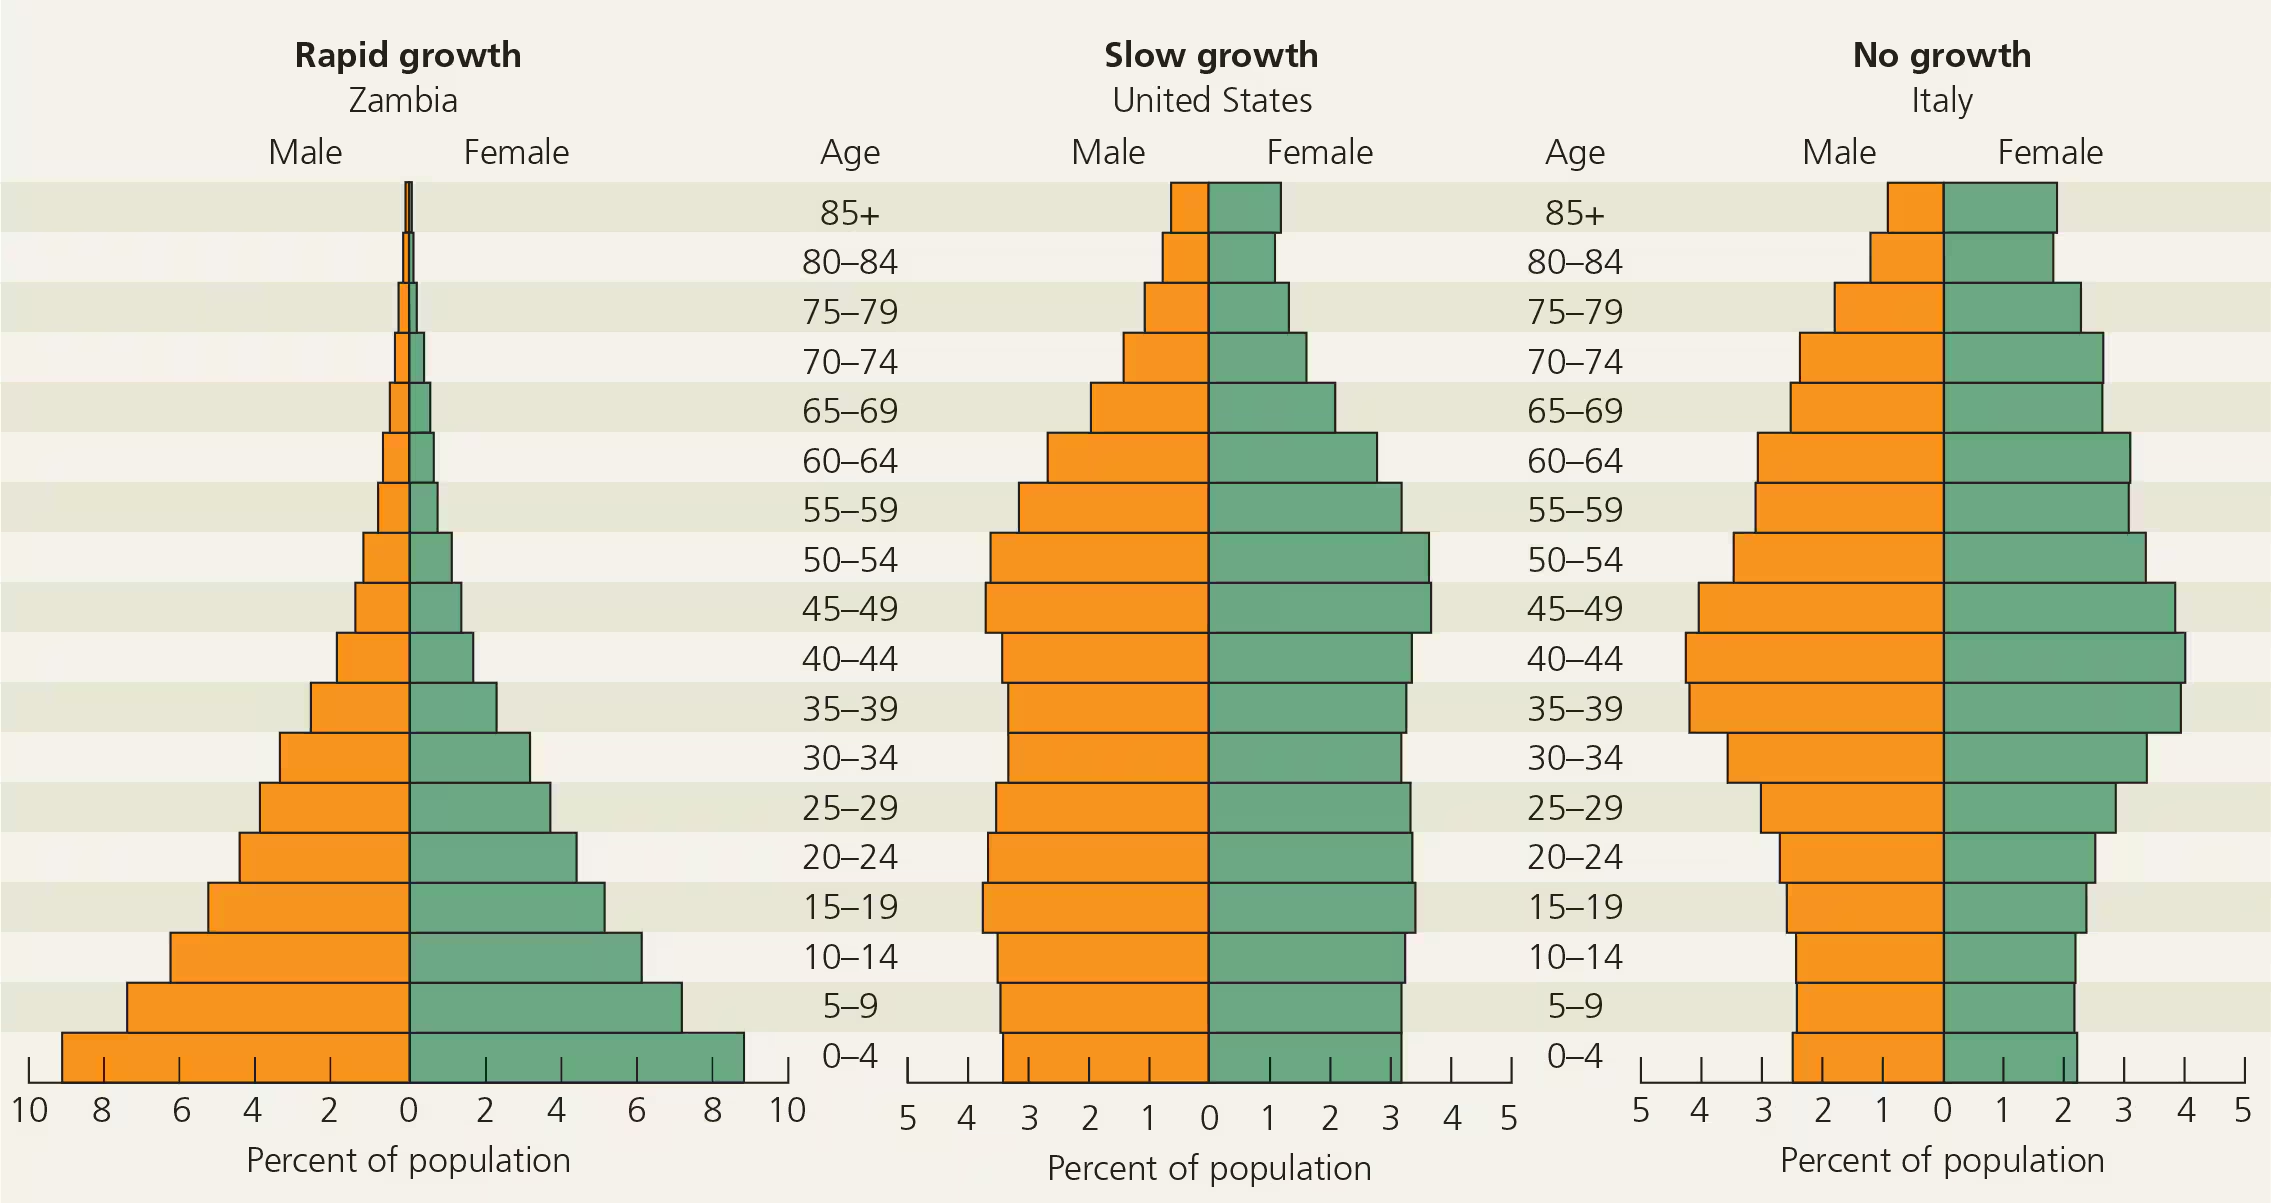
Look at the age-structure graph and describe the key features for the US
It is relatively even until the ages get into the older, reproductive ages, except for the bulge corresponding to the post-WWII “baby boom. The overall birth rate still exceeds death rates and the current total reproductive rate is 1.8 children per woman
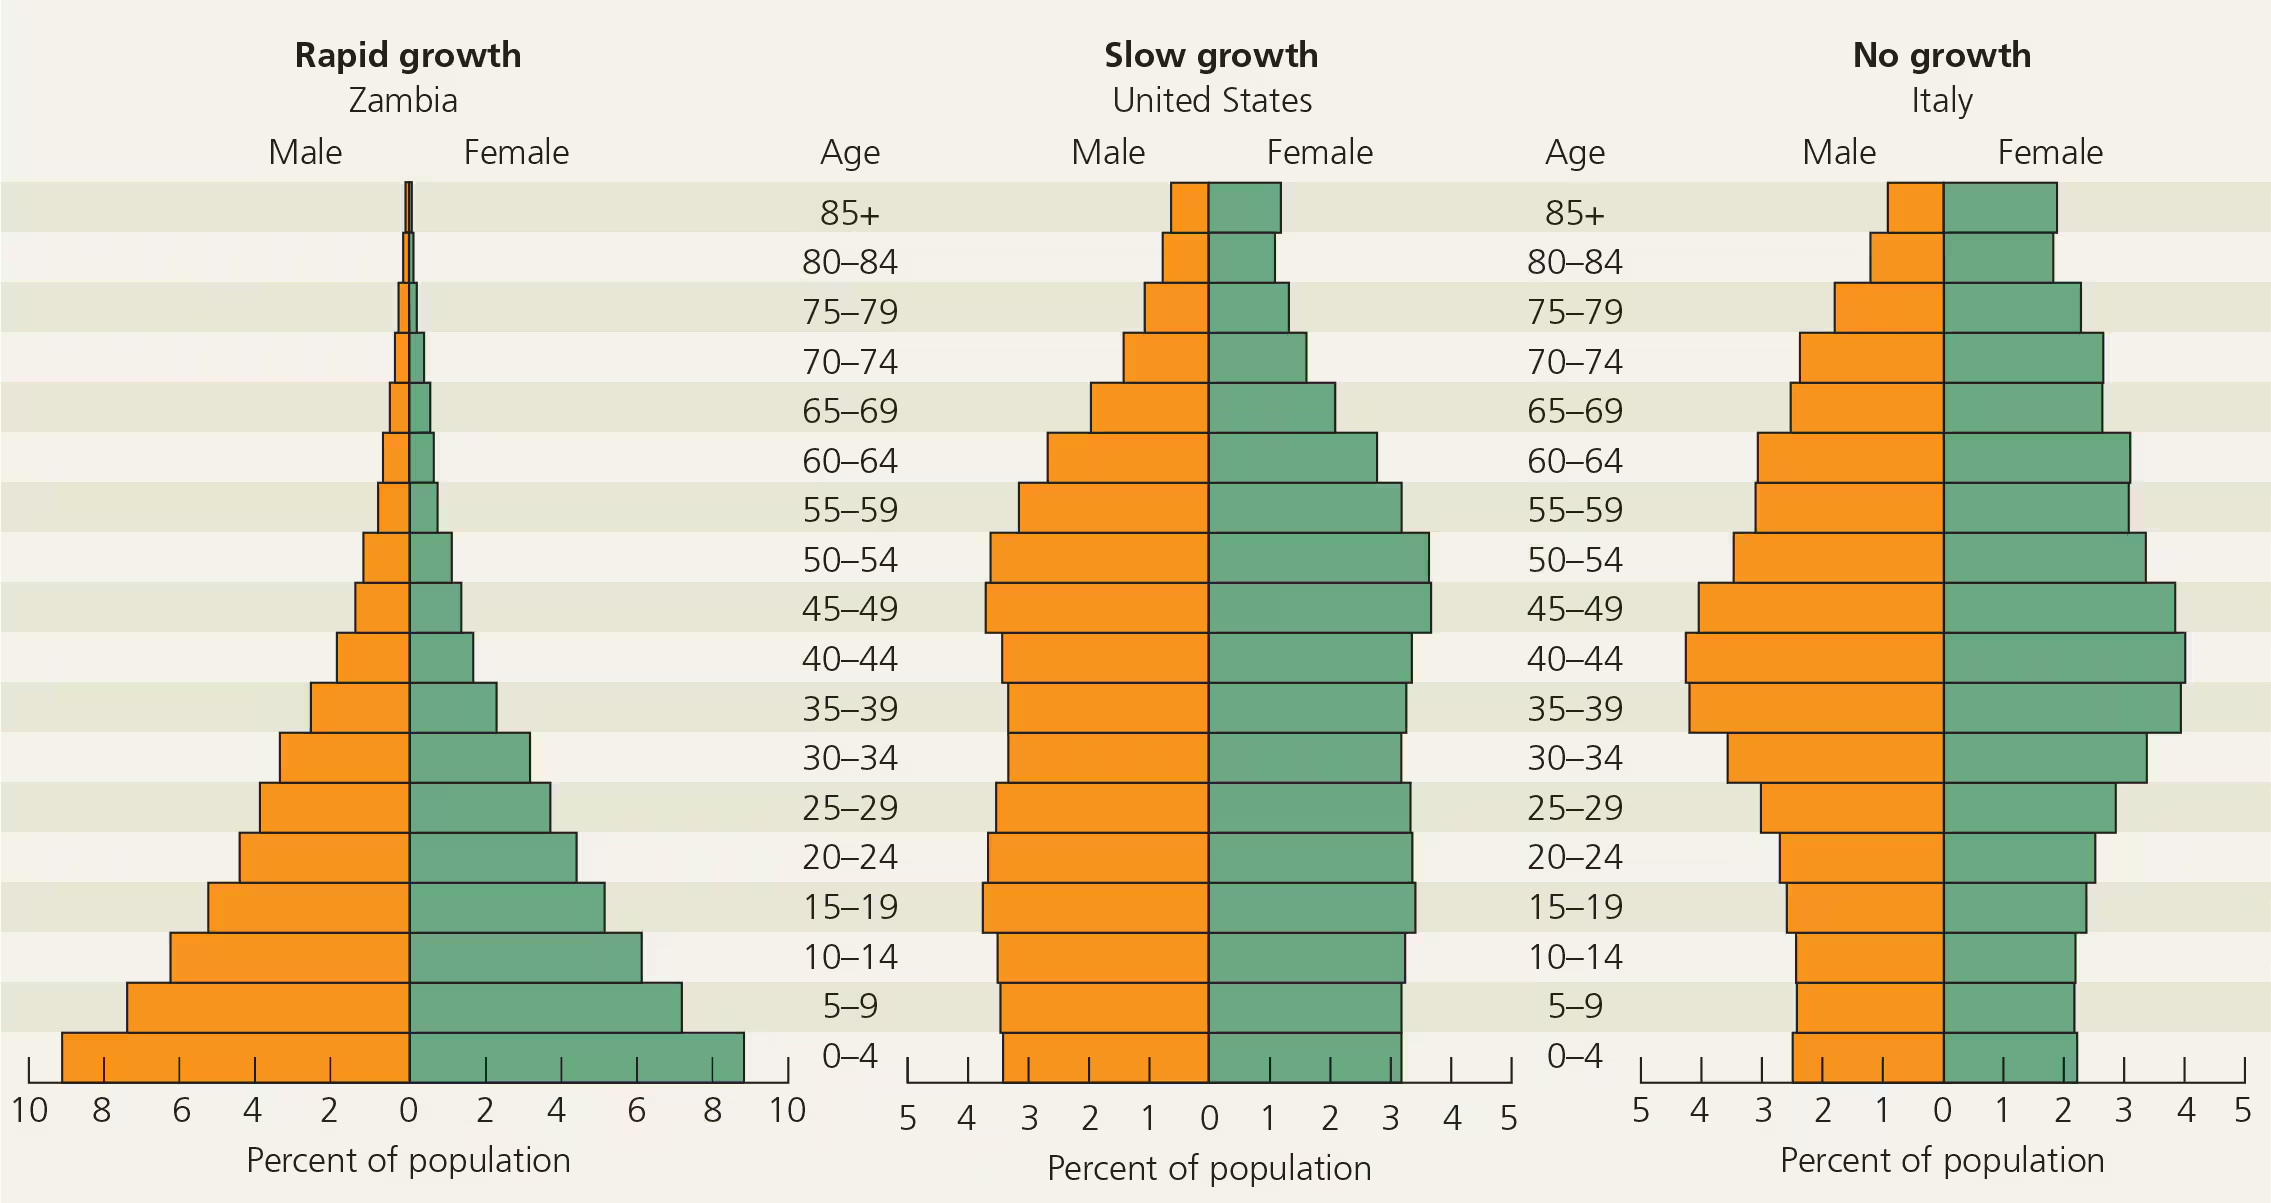
Look at the age-structure graph and predict how the population of the US will grow in the future
It will grow slowly through 2050 due to immigration
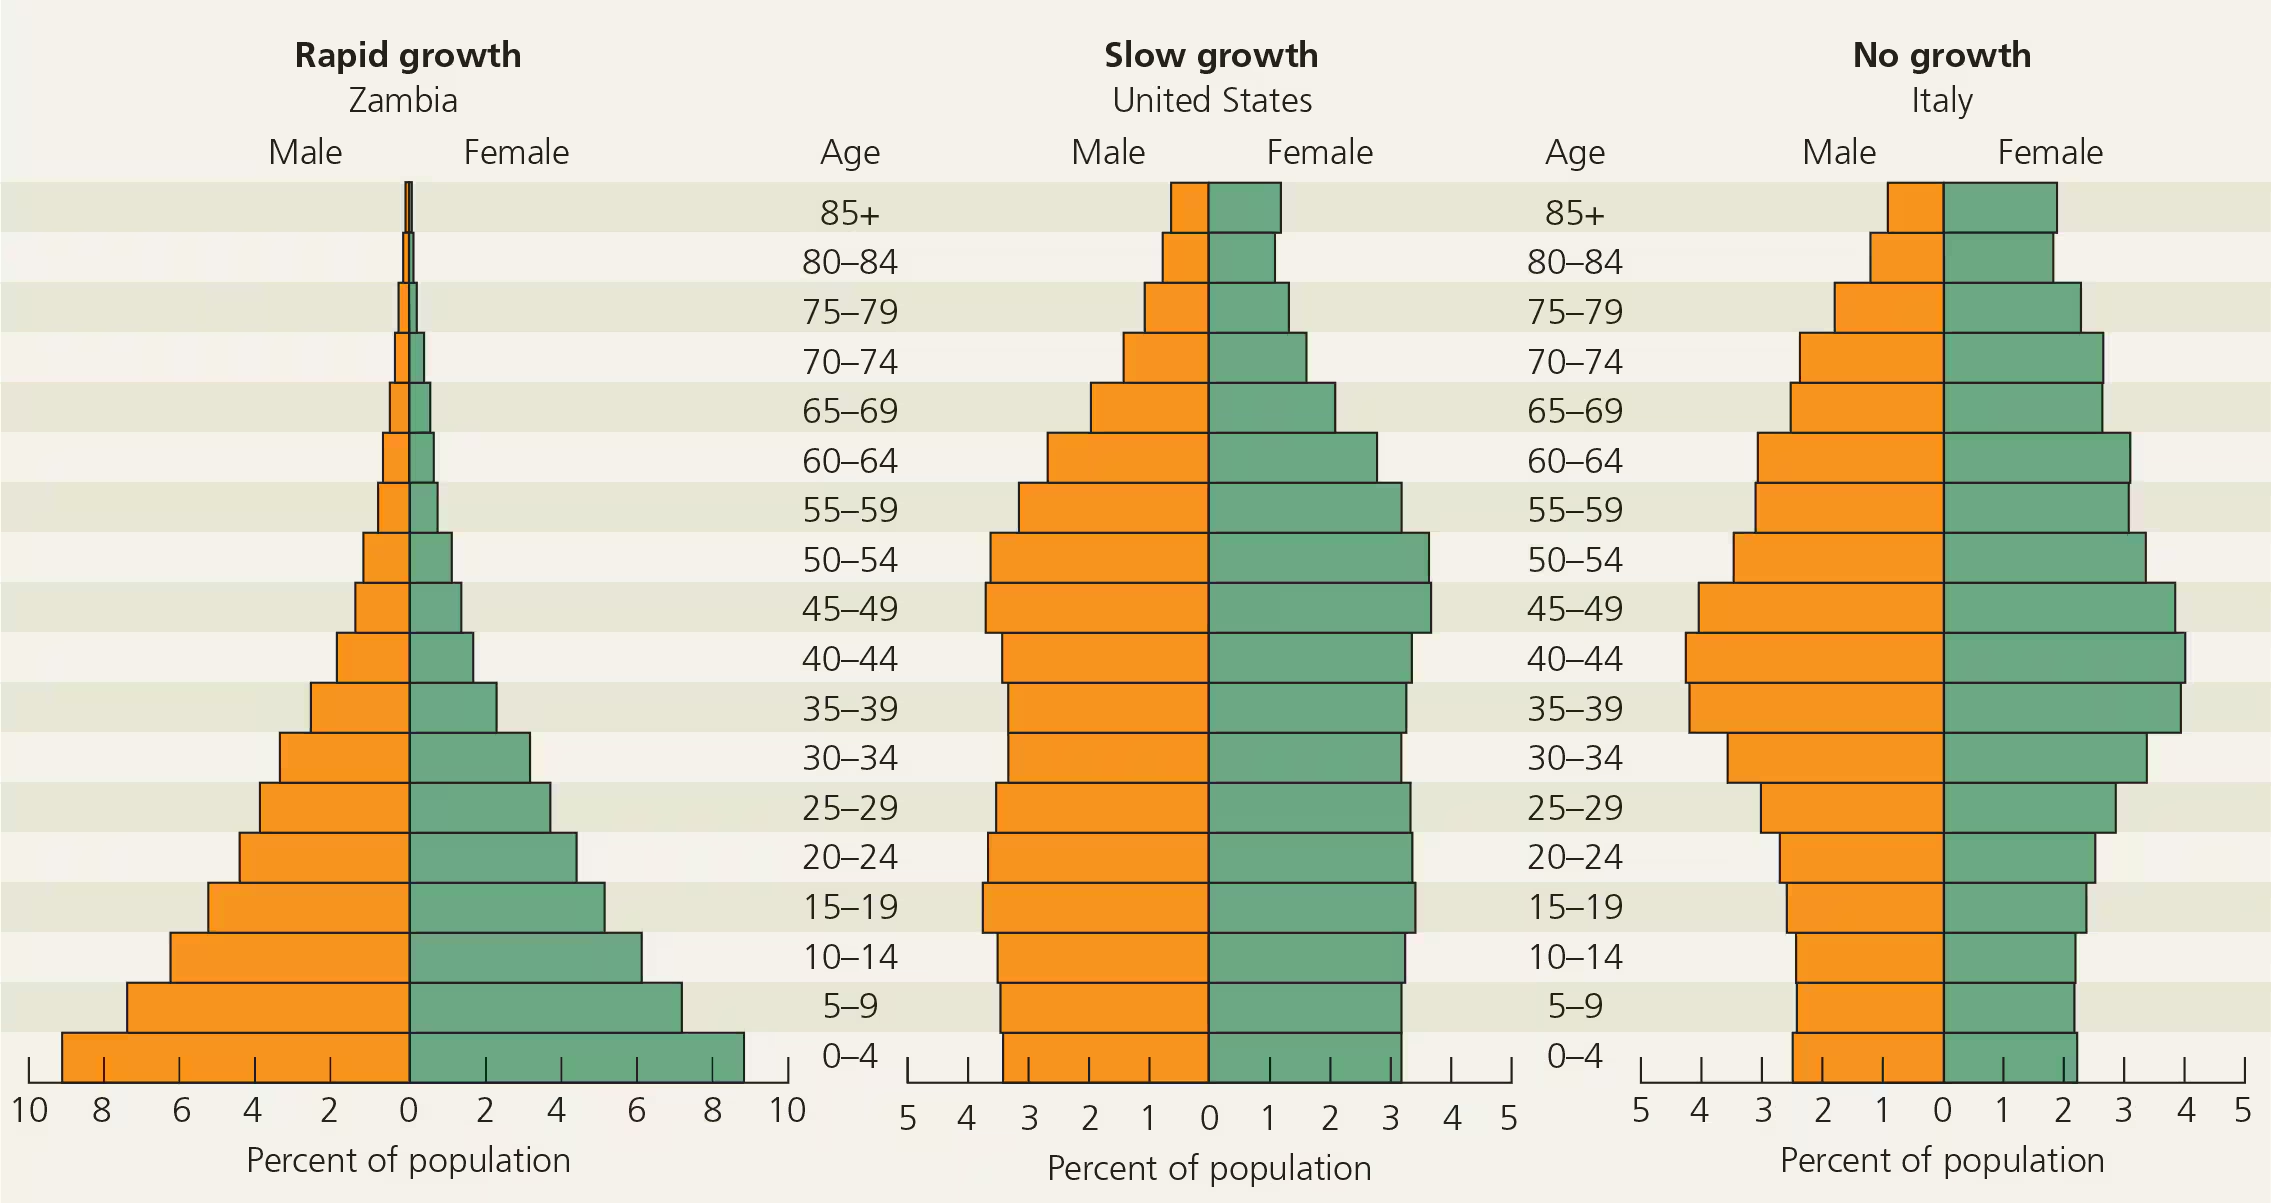
Look at the age-structure graph and describe the key features for Italy
Individuals younger than the reproductive age are relatively underrepresented in the population
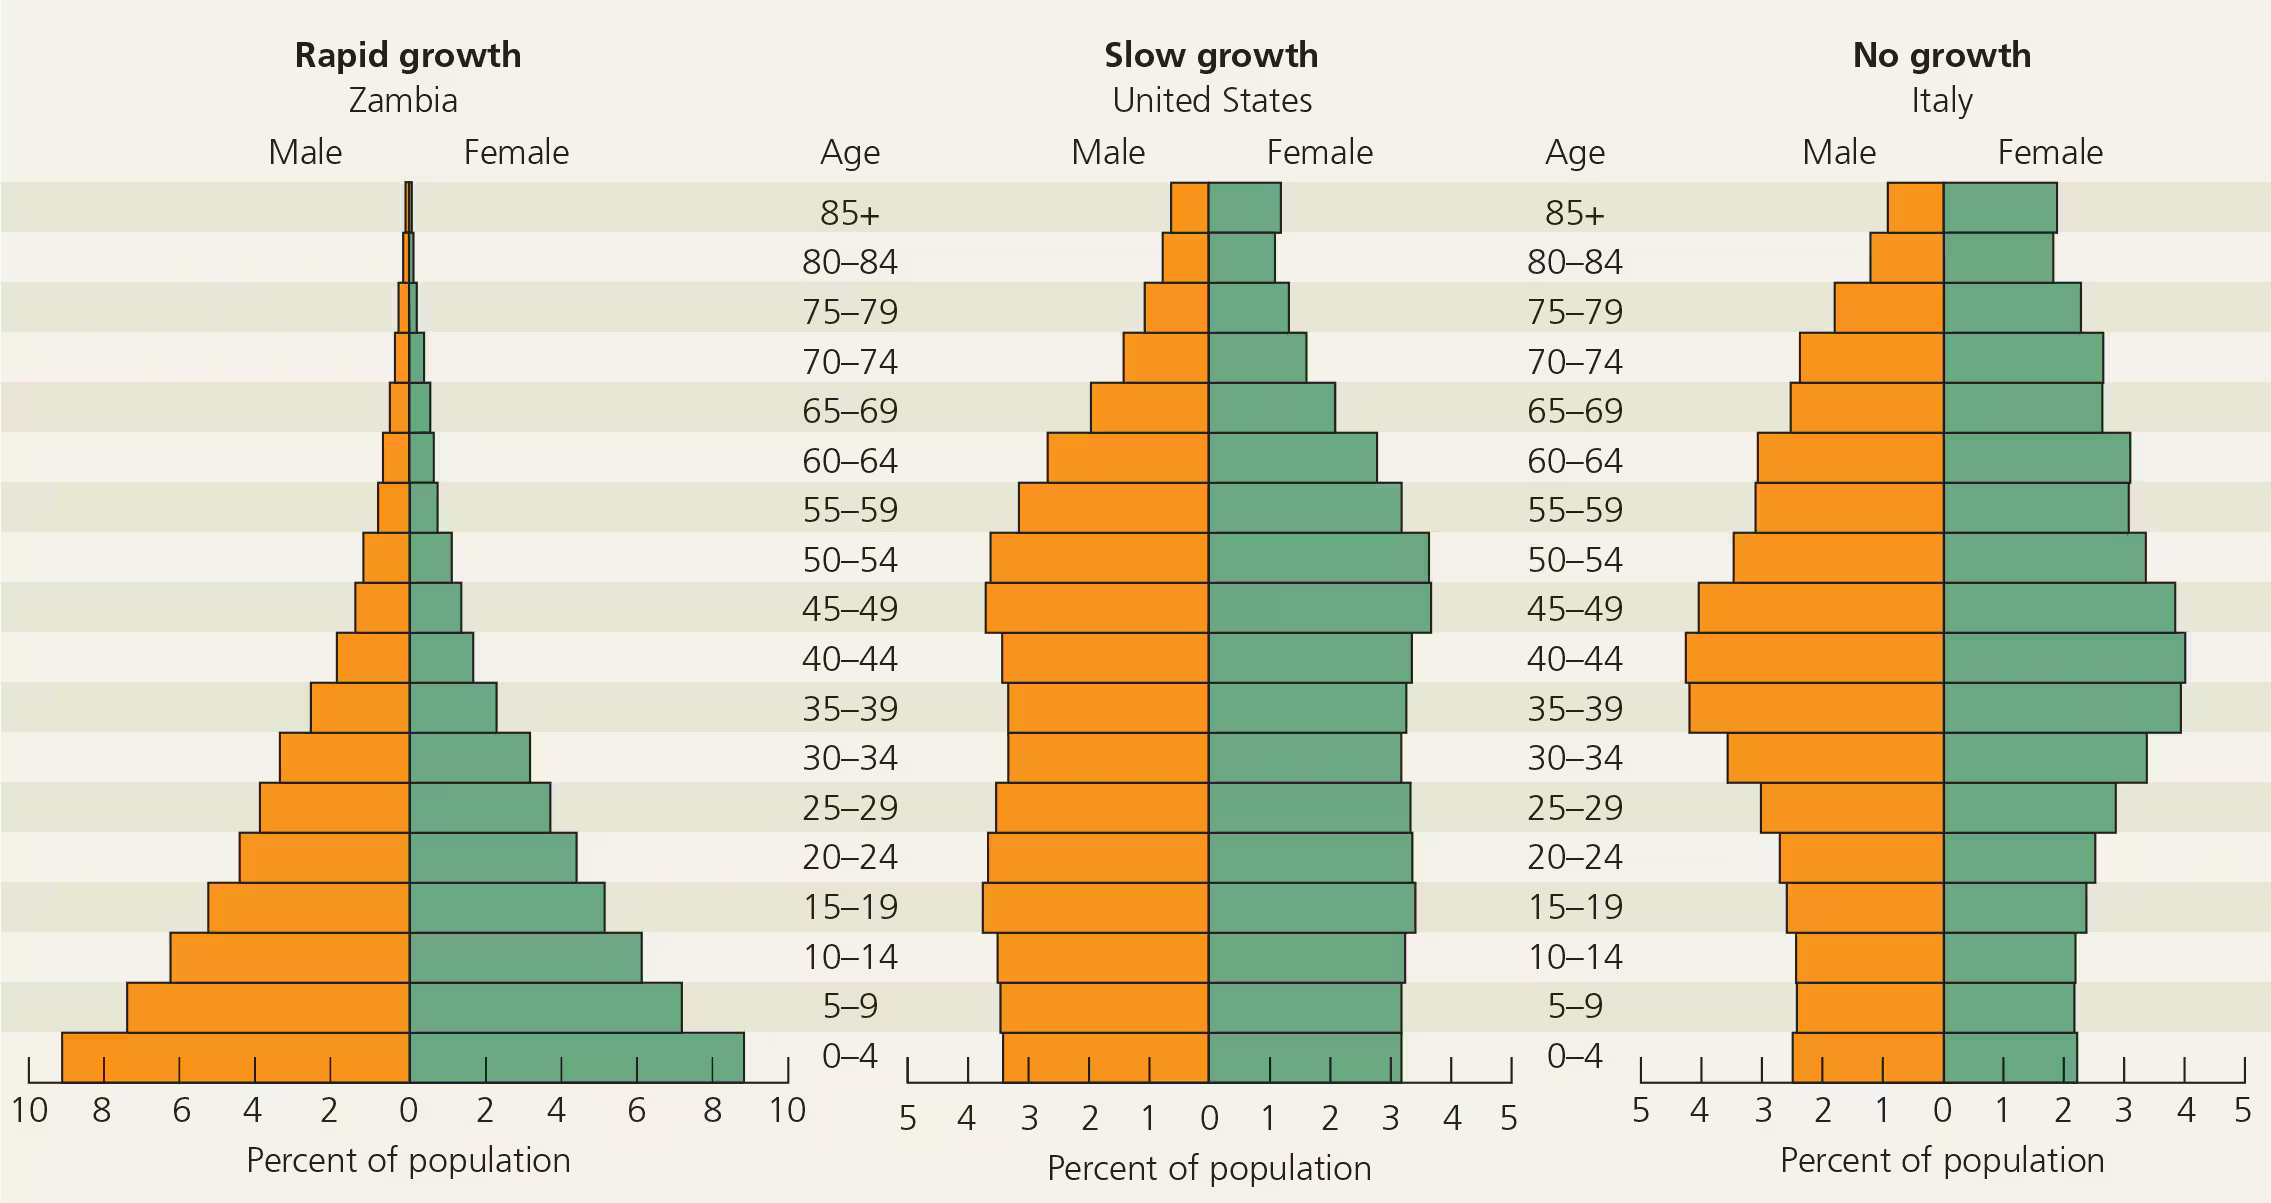
Look at the age-structure graph and predict how the population of Italy will grow in the future
The population size will decrease.
