PSY301 Lecture 4: Tests of association I: Simple and more complex correlation analyses
 Call Kai
 Learn
Learn Practice Test
 Spaced Repetition
 Match
Match Flashcards
 Knowt Play
1/22

There's no tags or description
Looks like no tags are added yet.
Name | Mastery | Learn | Test | Matching | Spaced | Call with Kai | Chat |
|---|
No analytics yet
Send a link to your students to track their progress
23 Terms
CORRELATIONAL DESIGN
Correlational design examines whether two variables move together. e.g., “When one changes, does the other change too?
Do values on one variable RELATE to values on another variable?
As study hours increase, does exam score increase?
As stress increase, does sleep quality decrease?
As temperature increases, do ice cream sales increase?
NOTE: Correlation doesn’t imply causation.
CORRELATION & COVARIANCE
Relationship between two variables If related:
they are ‘co-related’
they co-vary
However, covariance is “statistically” different concept from correlation.
Covariance tells us whether variables move together.
Correlation rescales covariance so it always falls between -1 and +1 making it easier to interpret.
Covariance is like measuring in random units, correlation converts it into a standard scale everyone understands.
What does r actually tell us?
1. The direction of the relationship Positive (r > 0) → As X ↑, Y ↑ Negative (r < 0) → As X ↑, Y ↓ Or Zero (r ≈ 0) → No linear relationship
2. The magnitude of the relationship (strength)

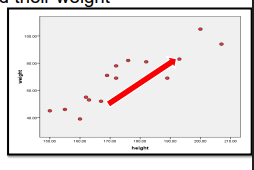
POSITIVE LINEAR RELATIONSHIPS (R > 0)
As scores on one variable increases, so too do the scores on the other… e.g. a person’s height and their weight
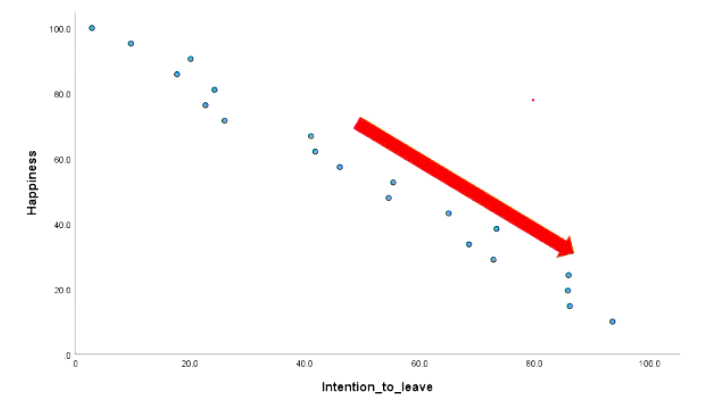
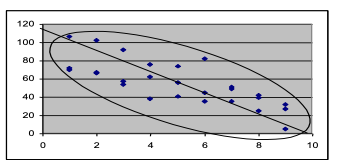
NEGATIVE LINEAR RELATIONSHIPS
As scores on one variable increase, on the other they decrease: e.g. happiness and intention to leave
NO RELATIONSHIP
As one variable increases, the other seems to behave in a random fashion.. e.g. hair length and mood

HOW TO CALCULATE THE CORRELATION
We have two variables.
Step 1. Compute the Means
Step 2. Compute the Deviations from the Mean
Step 3. Multiply the Deviations
Step 4. Sum the Products → This is Covariance
Step 5. Compute the Standard Deviations (square the Deviations, Sum, and square root)
Step 6. Divide the covariance by the Product of the Standard Deviations
HOW TO CALCULATE THE CORRELATION - HOW DOES IT DO THAT?

Put simply, all you are doing is seeing how much the pair of scores on each variable covary… i.e. synchronised changes
You then divide this by the combined standard deviation of the two variables… i.e. by how much scores differ within each variable
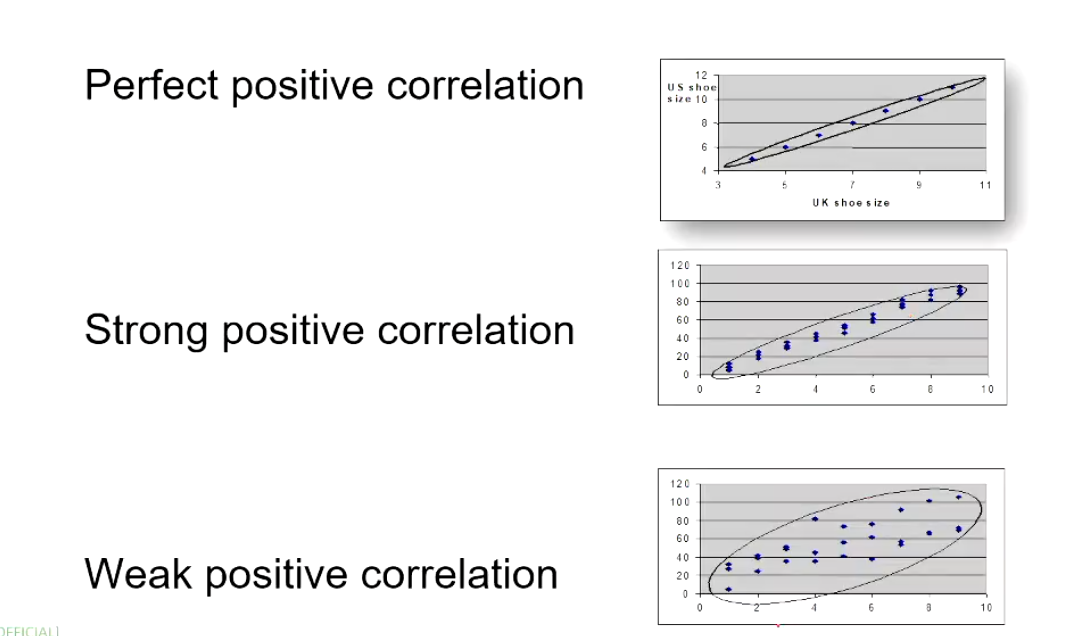
STRENGTH OF A CORRELATION
LINEAR RELATIONSHIPS
Correlation coefficient (r) actually represents the ‘line of best fit’
i.e. coefficient represents the slope of this line
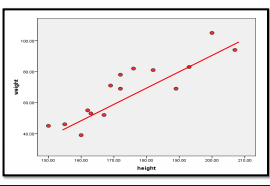
THE LINE OF BEST FIT
Least difference between scores on scatterplot
Can be used to predict the score of one variable when given the other (linear regression)
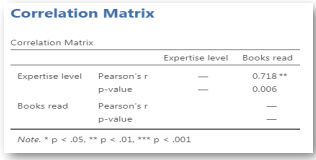
OUTPUT
The relationship between the number of statistics books read and statistical knowledge was found to be positively and strongly correlated (r =.72, p=.006)
EFFECT SIZE
Although we may have a significant relationship between books & stats knowledge – is the magnitude of this relevant?
Correlation coefficient = effect size!
So, in this case effect size is .72!
Classification: Cohen (1988)
± 0.1 = small effect ± 0.3 = moderate effect ± 0.5 = large effect
SQUARING THE COEFFICIENT
square the correlation coefficient:
measure of the overlap in variance of variables
‘shared variance’
if you have a correlation of .718
….square it to get r2=.515524
….multiply by 100 to get 51.5524%
Thus the number of books read explains 51.6% of the variance in statistical knowledge
OTHER VARIABLES
Bivariate correlations
So called because two variables… What happens if you have a 3rd variable?
PARTIAL CORRELATION

We want to examine the correlation between Working memory capacity (X) and Reading comprehension (Y).
We suspect that IQ score might influence both.
Zero order correlation (r) = .79
It seems strong, but IQ might be inflating this relationship, because it’s known to affect both.
Partial correlation (r) = .52
It means that working memory still predicts reading comprehension even after accounting for IQ score.
Interpretation: Working memory has an independent correlation with reading comprehension, not just because it overlaps with general intelligence (IQ).
Message: By partial correlation, we can effectively remove all the variance in the relationship between X and Y that is due to a third variable (confound). This allows us to examine the unique association between X and Y, independent of the influence that Z has on both.
Partial and Semi-partial (aka Part) correlations
Both correlations are used to understand relationships between variables while controlling for the influence of other variables.
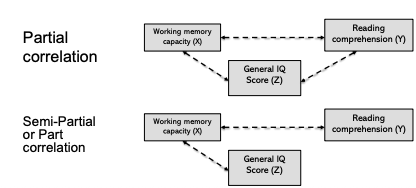
Partial correlation:
We remove (control for) the variance in both X and Y that is associated with Z.
Used when we want to know the pure association between X and Y, independent of Z.
Q → How strongly is working memory (X) associated with reading comprehension (Y) after removing the effects of IQ score (Z) from both?
Semi-Partial or Part correlation:
We remove (control for) the effect of Z from only one variable (typically X), and see how much it still explains in Y.
Typically used in regression (week 5) to assess how much unique variance an X contributes to Y
Q → How much the variance in reading comprehension (Y) is explained uniquely by working memory (X) after removing the shared influence of IQ score (Z) on working memory (X)
Correlation between a continuous and categorical variable
Point biserial Correlation: The point biserial correlation coefficient, (rpbi) is a special case of Pearson’s correlation coefficient. It measures the relationship between two variables:
One continuous variable (must be ratio scale or interval scale).
One naturally binary variable (dichotomous).
Many different situations call for analysing a link between a binary variable and a continuous variable. For example:
Does Drug A or Drug B improve depression?
Are women or men likely to earn more as nurses?
Is stress level associated with violent action?
Biserial Correlation
Almost the same as point biserial correlation, but one of the variables is ordinal data and has an underlying continuity.
For example:
depression level can be measured on a continuous scale, but can be classified dichotomously as “low”, and “high”.
Violent action can be measured and coded as Non-violent (1) vs 2 (Violent).
Bivariate regression
From correlation to prediction.
Bivariate regression models the linear relationship between one predictor (X) and one criterion/outcome (Y) as a straight line.
It enables us to predict Y values from X and to quantify how much variance in Y is explained by X.
Correlation VS Bivariate regression
Correlation:
Describe the strength and direction of a linear association (r)
Symmetric → r(X,Y) = r (Y,X)
No directional prediction: neither variable is ‘predictor’.
Bivariate regression:
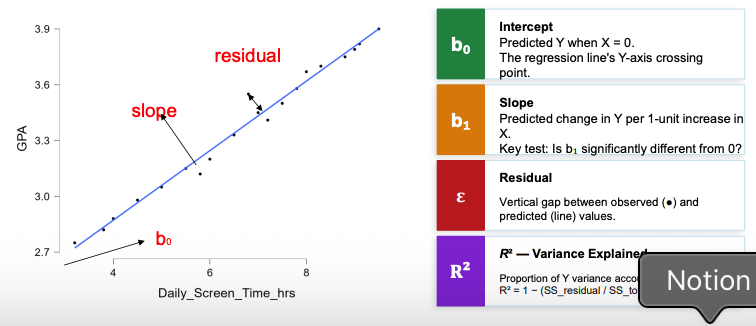
Uses X to predict specific Y values, Ŷ = b0 +b1X
Directional → X is the predictor, Y is the outcome.
Quantifies the rate of change in Y per unit of X (slope b1)
Regression equation
Ŷ = b₀ + b₁X

Regression equation - Slope, Intercept & Residuals