Aggregate Demand and Supply Analysis in Economics
1/65
There's no tags or description
Looks like no tags are added yet.
Name | Mastery | Learn | Test | Matching | Spaced |
|---|
No study sessions yet.
66 Terms
Aggregate Demand
Total demand for goods and services in an economy.
Consumption Expenditure
Total demand for consumer goods and services.
Planned Investment Spending
Business spending on capital goods and new homes.
Government Purchases
Spending by government on goods and services.
Net Exports
Foreign spending on domestic goods minus imports.
Downward Sloping Curve
Aggregate demand curve slopes down due to price level decrease.
Quantity Theory of Money
Money supply affects nominal aggregate spending at constant velocity.
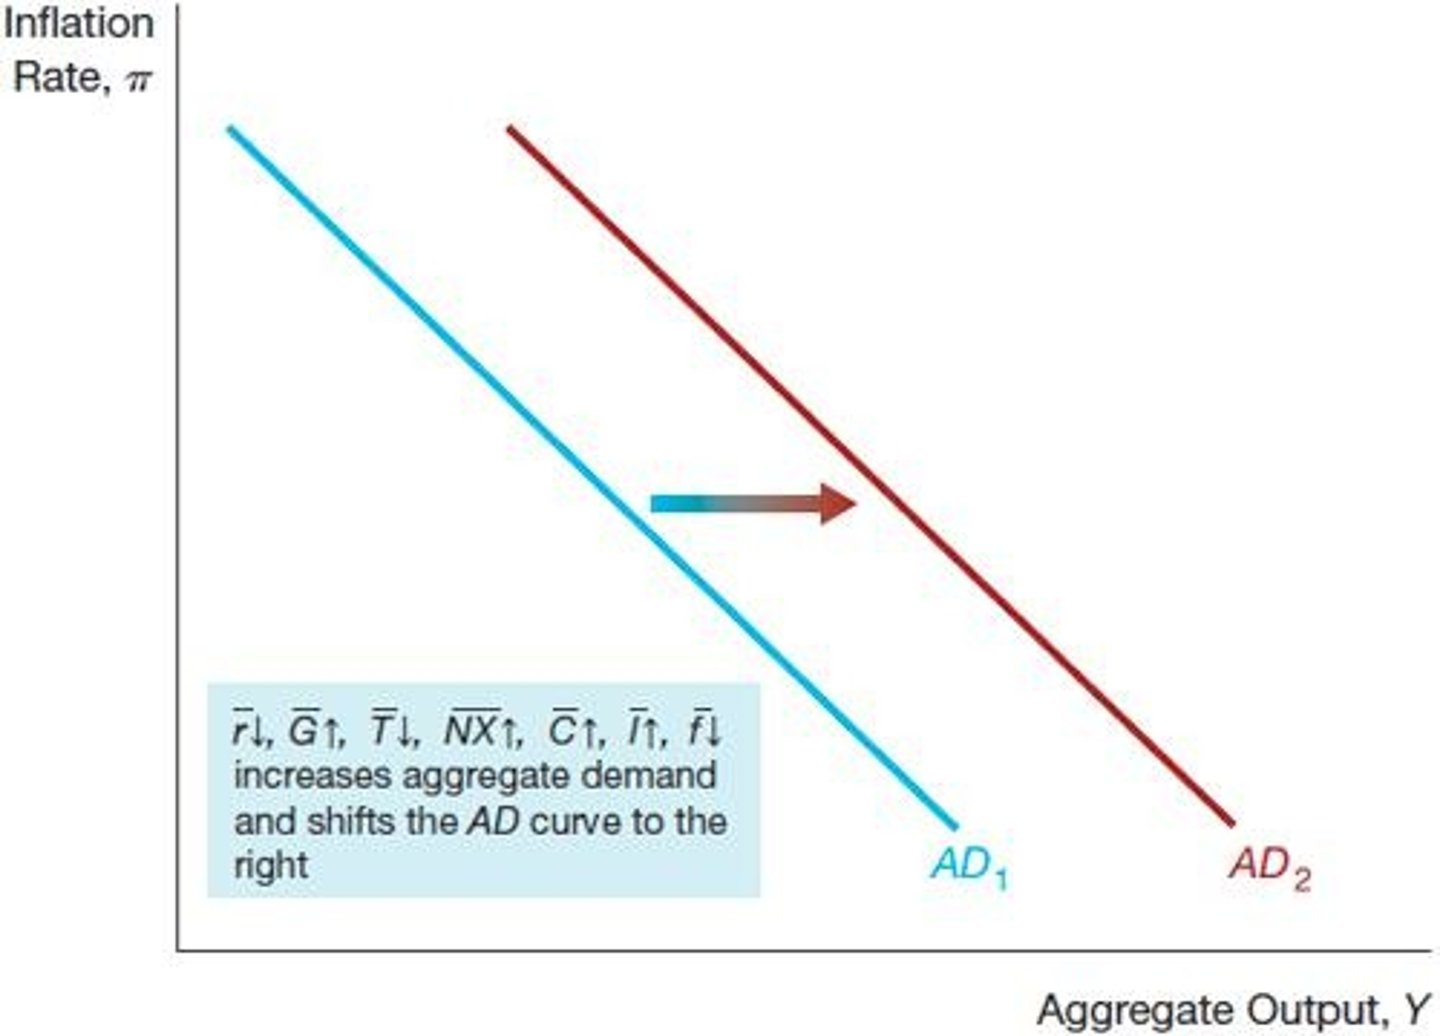
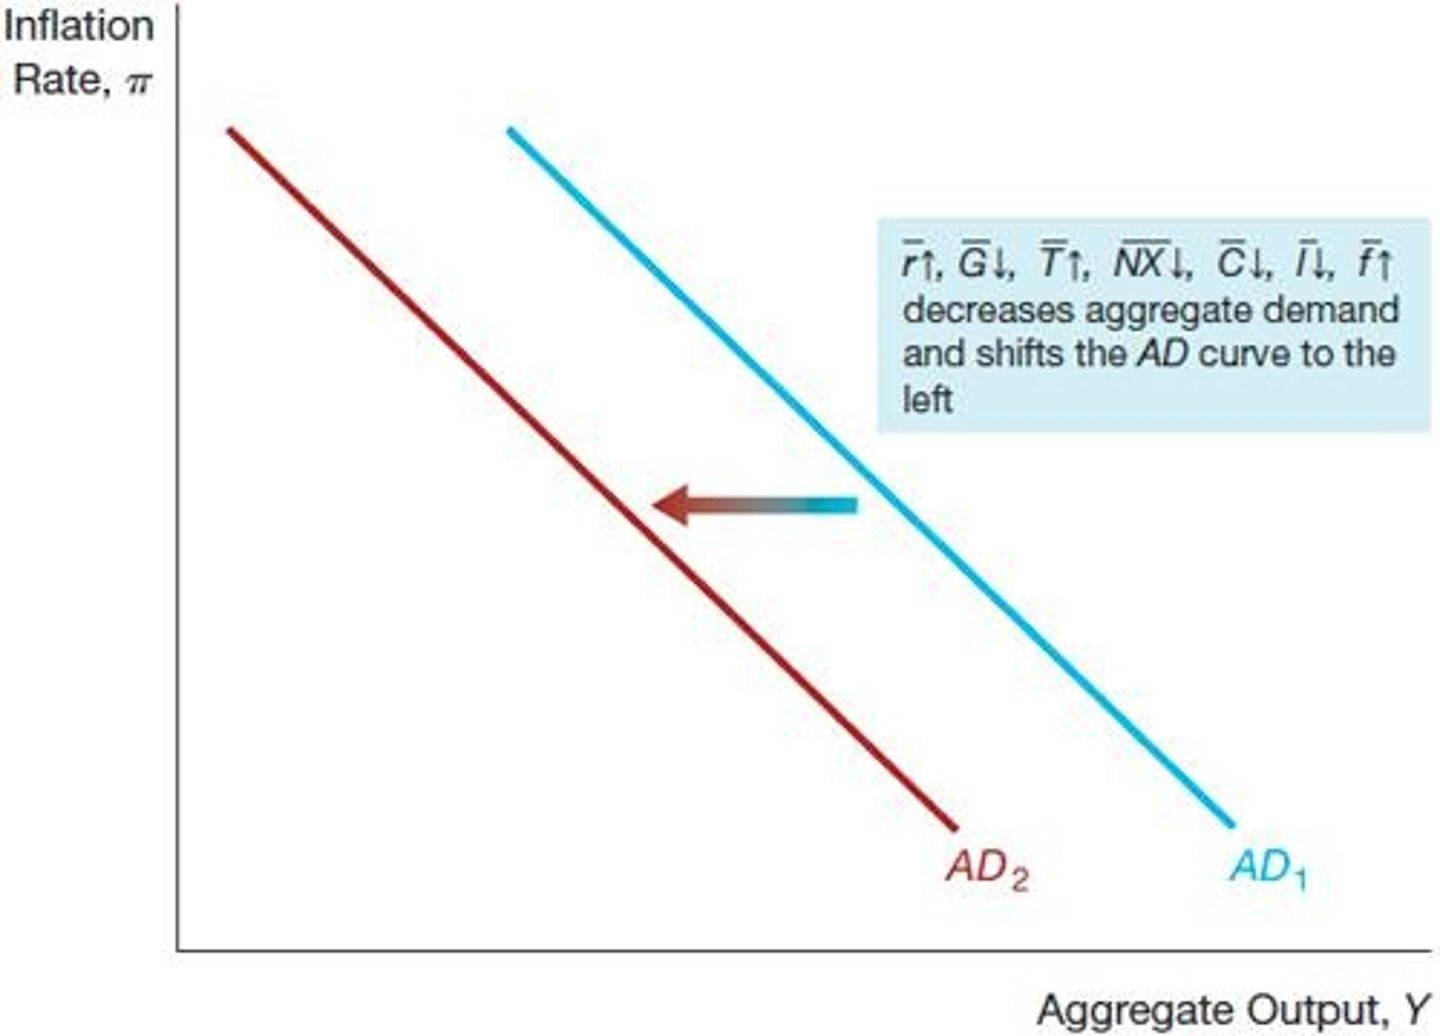
Factors Shifting Aggregate Demand
Changes in C, I, G, NX shift AD curve.
Increase in Money Supply
Shifts aggregate demand curve to the right.
Long-Run Aggregate Supply (LRAS)
Determined by capital, labor, and technology availability.
Natural Rate of Output
Output level at natural rate of unemployment.
Short-Run Aggregate Supply (SRAS)
Upward sloping due to sticky wages and prices.
Shifts in LRAS
Increased capital, labor, or technology shifts LRAS right.
Sticky Wages and Prices
Wages and prices adjust slowly to changes.
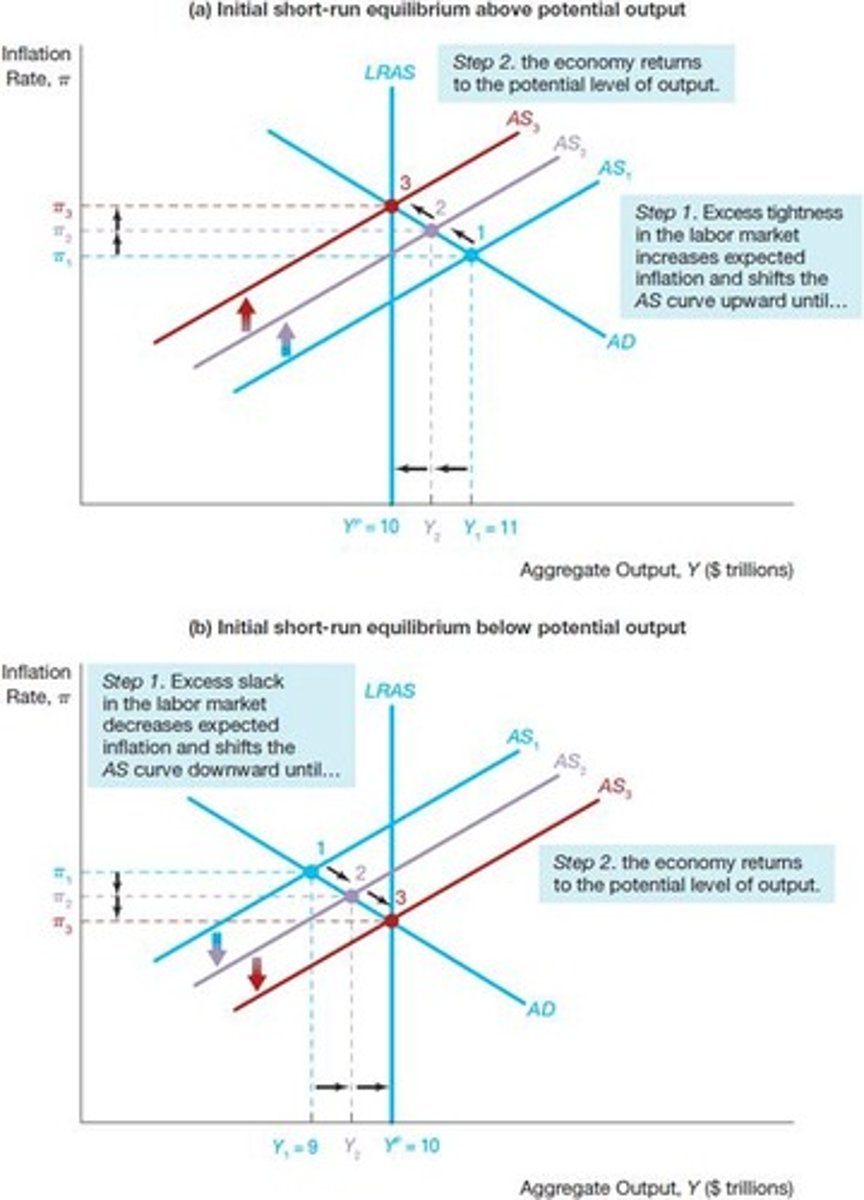
Self-Correcting Mechanism
Economy adjusts to return to long-run equilibrium.
Temporary Supply Shock
Short-term disruption affecting supply and prices.
Permanent Supply Shock
Long-term disruption affecting supply and prices.
Business Cycle Fluctuations
Economic ups and downs, like the 2007-2009 crisis.
Rightward Shift in AD Curve
Increased spending leads to higher aggregate demand.
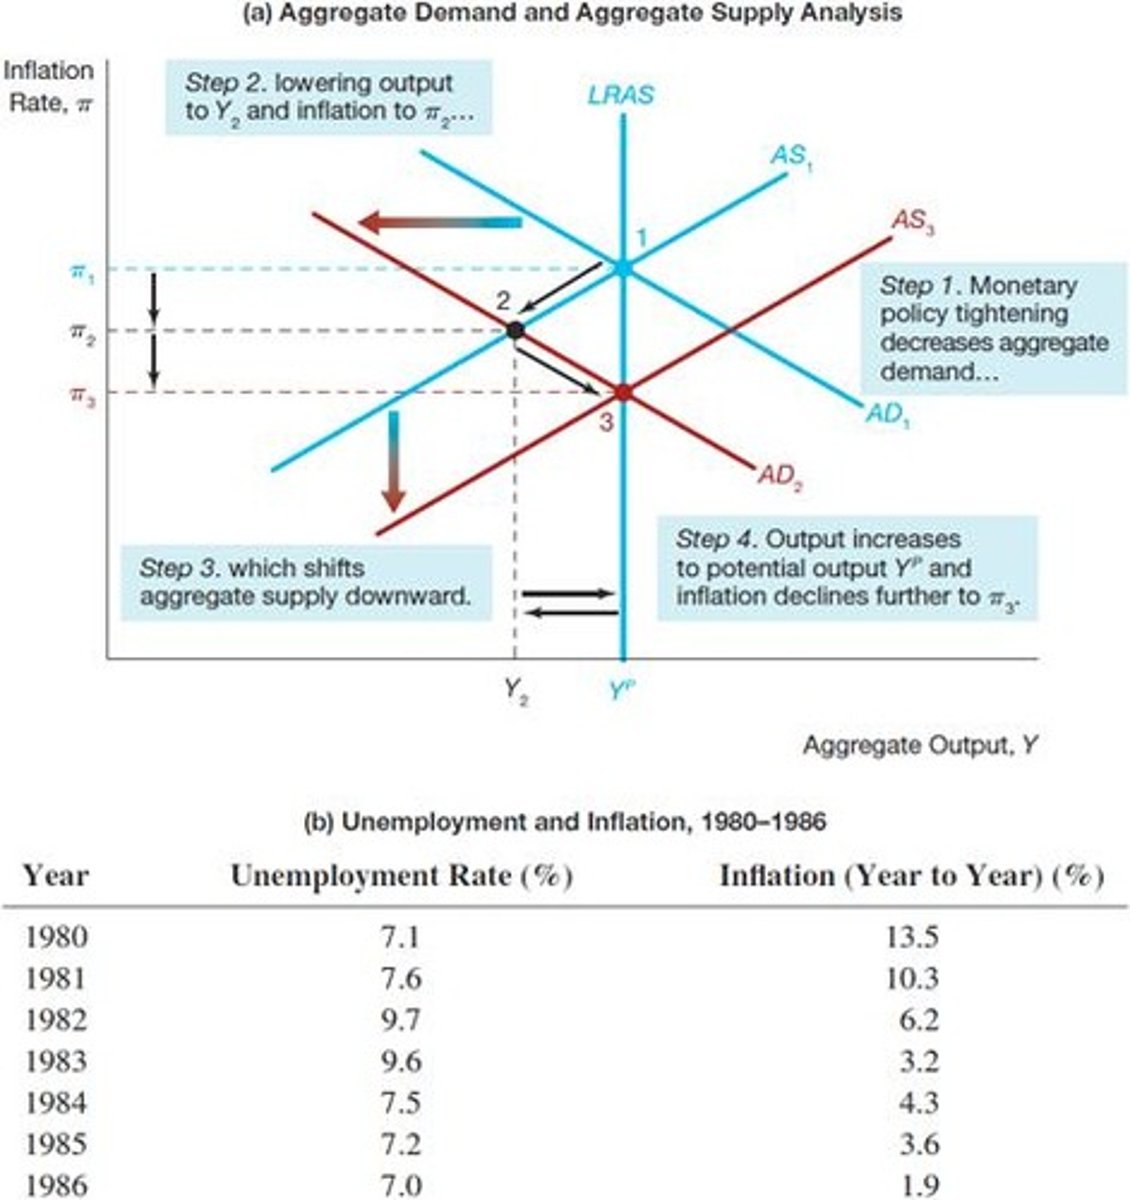
Leftward Shift in AD Curve
Decreased spending leads to lower aggregate demand.
Natural Rate of Unemployment
Unemployment rate when economy is at full employment.
Short-Run Aggregate Supply Curve
Shifts due to expected inflation, price shocks, output gaps.
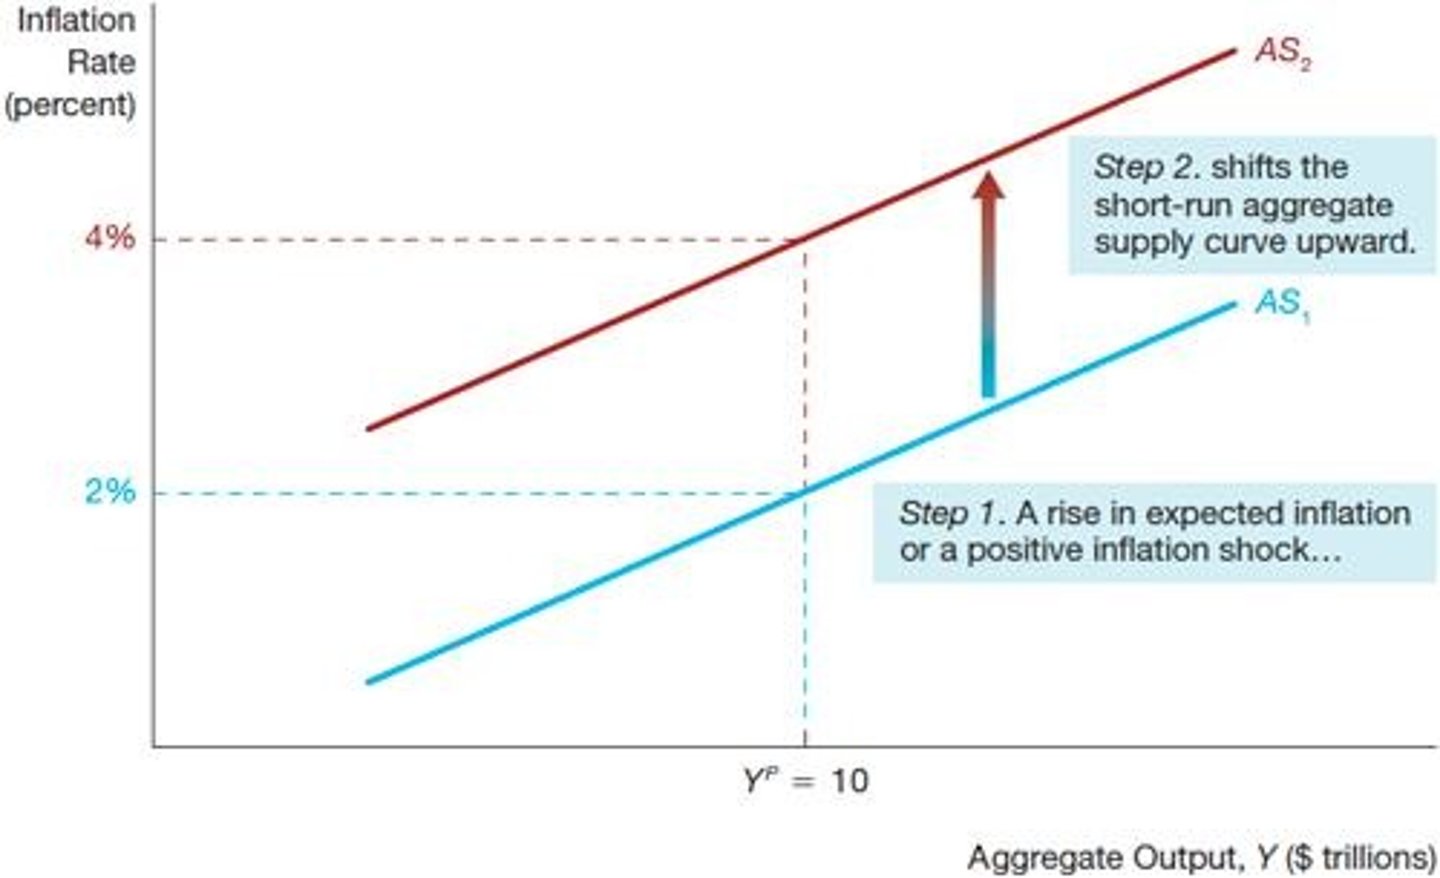
Expected Inflation
Anticipated increase in prices affecting supply decisions.
Price Shocks
Sudden changes in prices impacting supply dynamics.
Persistent Output Gap
Long-term difference between actual and potential output.
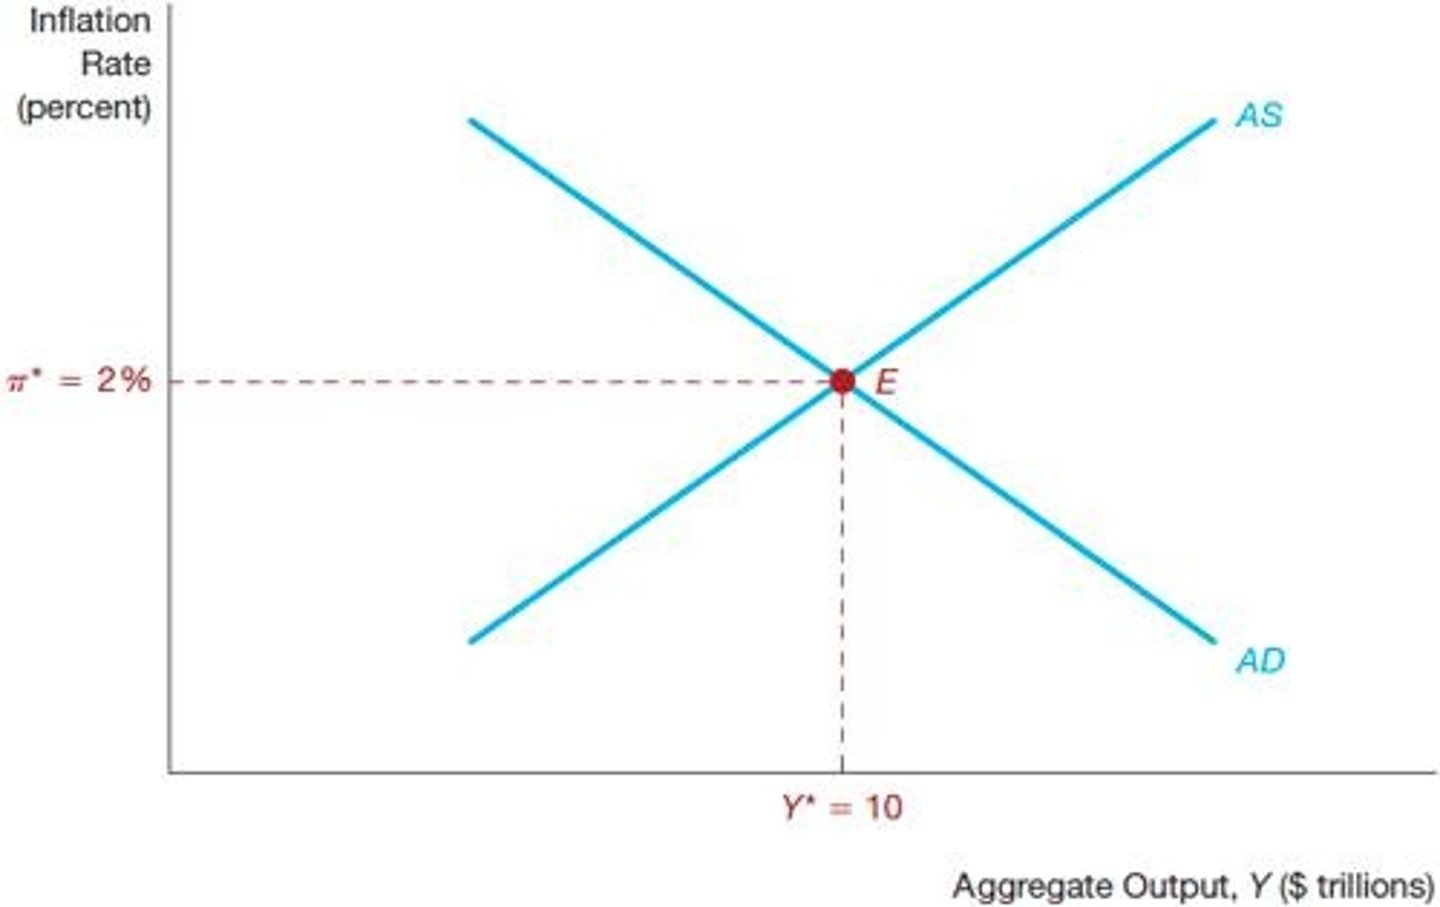
General Equilibrium
All markets in equilibrium simultaneously in the economy.
Short-Run Equilibrium
Aggregate output demanded equals aggregate output supplied.
Equilibrium Level of Output
Quantity of output at which demand equals supply.
Inflation Rate at Equilibrium
Rate of inflation at equilibrium output level.
Self-Correcting Mechanism
Economy returns to natural rate of output over time.
Wage Inflexibility
Wages do not adjust easily, especially downward.
Active Government Policy
Government intervention needed to stabilize the economy.
Flexible Wages and Prices
Wages and prices adjust quickly to economic changes.
Demand Shocks
Events causing shifts in the aggregate demand curve.
Temporary Supply Shocks
Short-term disruptions affecting supply without long-term shifts.
Negative Supply Shock
Supply restriction causing commodity prices to rise.
Positive Supply Shock
Supply increase leading to lower inflation and higher output.
Permanent Supply Shocks
Long-term disruptions that shift the long-run supply curve.
Real Business Cycle Theory
Economic fluctuations arise from permanent supply shocks.
Potential Output
Maximum sustainable output level of an economy.
Long-Run Aggregate Supply Curve
Represents economy's potential output at full employment.
Commodity Prices
Prices of goods that can be affected by supply shocks.
Aggregate Demand Curve
Represents total quantity of output demanded at various prices.
Aggregate Demand Curve
Represents total demand for goods/services in economy.
Short-Run Effects
Changes in output occur only temporarily.
Long-Run Effects
No change in output; economy self-corrects.
Temporary Supply Shock
Affects output and inflation temporarily.
Permanent Supply Shock
Affects output and inflation both short and long term.
Self-Correcting Mechanism
Economy returns to potential output over time.
Phillips Curve
Negative correlation between unemployment and inflation.
Short-Run Phillips Curve
Shows trade-off between unemployment and inflation temporarily.
Long-Run Phillips Curve
No trade-off between unemployment and inflation over time.
Expectations-Augmented Phillips Curve
Adjusts for inflation expectations affecting unemployment correlation.
Supply Shocks
Changes output capacity from existing resources.
Adaptive Expectations
Inflation expectations based on past inflation rates.
Short-Run Aggregate Supply Curve
Relationship between output quantity and inflation rate.
Output Gap
Difference between actual output and potential output.
Okun's Law
Describes relationship between unemployment gap and output gap.
Unemployment Gap
Difference between actual unemployment and natural rate.
Natural Rate of Unemployment
Long-term average unemployment rate in economy.
Inflation Shock
Rapid increase in inflation due to supply shocks.
Business Cycle Episodes
Fluctuations in economic activity over time.
UK Financial Crisis
Economic downturn in the UK, 2007-2009.
China Financial Crisis
Economic downturn in China, 2007-2009.
Inflation Rate
Percentage increase in price level over time.
Potential Output
Maximum sustainable output an economy can produce.