AP HUG unit 2

studied byStudied by 14 people
5.0(1)
learn
LearnA personalized and smart learning plan
exam
Practice TestTake a test on your terms and definitions
spaced repetition
Spaced RepetitionScientifically backed study method
heart puzzle
Matching GameHow quick can you match all your cards?
flashcards
FlashcardsStudy terms and definitions

1 / 119

flashcard set

Earn XP

Description and Tags

2.7, 2.6, 2.8, 2.10, ~2.11, 2.5, 2.3, NOT 2.12, 2.13, 2.2, 2.4

120 Terms

1
Demography/demographic
Study of population
New cards
2
Ecumene
Areas with permanent human settlements
New cards
3
Physical Factors that Influence Population Distribution
Climate, landforms, water bodies, soil, etc
New cards
4
Human Factors that Influence Population Distribution
Culture, economics, history, politics, etc
New cards
5
Population Density
Number of people in relation to space occupied
New cards
6
Arithmetic Density
Number of people per unit area of land

\- ex: 100 people per square kilometer
New cards
7
Physiological Density
Number of people per arable land

\- more arable = more people
New cards
8

Arable land

Agriculturally productive/fertile

New cards
9

Agricultural Density

Number of farmers per unit arable land

- more developed = lower agricultural density/less farmers

New cards
10
Carrying Capacity
Number of people that can survive in an area
New cards
11
Technology can increase or decrease population density?
Increase
New cards
12
Population Distribution and Density’s Effect on Politics
\- **Higher Population = more political sway** because there’s more voters

\- rural and urban areas have different political needs and often disagree
New cards
13
Population Distribution and Density’s Effect on Economic
\- **More jobs=higher population** because people need to work

\- urban areas have more jobs
New cards
14
Population Distribution and Density’s Effect on Social Processes
\- **Higher Population = more social needs**

\- social needs include healthcare, entertainment, education, etc.

\- urban areas can provide these better
New cards
15
Population Distribution and Density’s  Effect On the Environment and Natural Resources
**Higher Population=Less resources** because you’re sharing with more people and they get used faster.
New cards
16
Demographic Momentum
It’s harder to shrink a rapidly growing population
New cards
17

Consequences of Overpopulation

- Job shortages

- Housing shortages

- more schools needed

- more sick people, more babies, etc.

New cards
18
Consequences of Underpopulation
Labor shortages, loss of heritage
New cards
19
Fertility Indicators
Population’s ability to reproduce
New cards
20
Total Fertility Rate
Average number of children women have in the reproductive years
New cards
21
Replacement Fertility Rate
Number of births needed to keep a stable population
New cards
22

Crude Birth Rate

Number of live births per 1000 of population in a year

New cards
23
Natural Rate of Increase (RNI)
Crude birth rate - crude death rate
New cards
24
Distribution of Highest RNI
Sub-Saharan Africa has highest RNI
New cards
25
Zero Population Growth (ZPG)
Stable Population, doesn’t increase or decrease
New cards
26
Doubling Time
Projected amount of time it’ll take a population to double
New cards
27
Mortality Indicators
When/how societies approach death
New cards
28
Infant Mortality Rate
Number of deaths per 1000 live births of kids under 1

Ex: 10 infant deaths for every 1000 births
New cards
29
Child Mortality Rate 
Number of deaths per 1000 live births of kids under 5

Ex: 10 child deaths for every 1000 births
New cards
30
Crude Death Rate
Number of deaths in a specific area per 1000 people
New cards
31
Life Expectancy
Average number of years people expect to live

\- varies by region
New cards
32
Outward Migration Rates
People **leaving** an area

\- affects population and population structure
New cards
33
Inward Migration Rates
People **entering** an area

\- affects population and population structure
New cards
34

Social Effect on Fertility

- Women’s Role in Society

- Religious views on BC and abortion

- Elders wanting kids to take care of them

New cards
35
Political Effect on Fertility
Pro and Anti Natal Policies
New cards
36
Economic Effect on Fertility
\- Higher Economic Development=Lower BR

\- Kids are seen and work assets in Agrarian Society

\- Kids are seen as economic liabilities in developed countries
New cards
37
Educations Effect on Fertility
**More educated women=lower BR** bc women are more financially independent
New cards
38
Healthcares Effect on Fertility
**Better healthcare=lower BR**

\- parents in LDC have 7 kids with the expectation of 2 dying bc of poor healthcare, so they have more kids to counter act that. With better healthcare, parents don’t have to worry about their kids dying and have.
New cards
39
Malthusian Theory
World population grows exponentially while resource supplies grow arithmetically leading to a lack of resources.

His solution: don’t assist poor people as they’re the cause of overpopulation.
New cards
40
Malthusian Theory Criticisms
\- didn’t account for technological advances

\- didn’t consider how migration would redistribute the population
New cards
41
Neo-Malthusians
believe the population will outstrip resources and that overpopulation needs to be addressed now

\- survival of the fittest, social Darwinism, lifeboat ethics, cutting aid and restricting resource from LDCs
New cards
42
Cornucopians
Believe humans will solve any problem with human ingenuity

\- increased population will motivate scientific development
New cards
43
Ester Boserup
Founded Cornucopian Theory
New cards
44

Pro-Natal Policies

Encourage pregnancy to increase population growth.

- baby schemes

- parental leave

- childcare costs offsets

New cards
45
Anti-Natal Policies
Discourage pregnancy to control/slow population growth.
New cards
46
Global Replacement Rate
2\.1 births per woman
New cards
47
Ways to INCREASE population
\- increase immigration

\- Increase women’s access to healthcare

\- financial incentives for giving birth

\- parental leave policies
New cards
48
Ways to DECREASE population
\- Improve women’s educational, political, social, etc. status

\- Implement laws to regulate the number of kids
New cards
49
Baby Bonus Schemes
Financial incentive to have kids

\- pro-natal policy
New cards
50
Parental Leave
time off work after having a kid

\- pro-natal policy
New cards
51
Offsetting Childcare Costs
government assists with childcare costs

\- pro-natal policy
New cards
52
Consequences of an Aging Population
\- worker shortage

\- cost of caring for the elderly (retirement homes, etc)
New cards
53
Consequences of Young Population
\- Future Job shortage

\- Need more Education infrastructure

\- Stress on prenatal/child Health Care

\- Housing shortage
New cards
54
Dependency Ratio
Comparison of Old and Young Dependents to Working-Age Independents

\- More dependents=more support needed
New cards
55
Birth Restrictions
Laws that restrict to number of kids a family can have

\- anti-natal policy
New cards
56
Biggest Cause of Immigration
Economic Opportunities
New cards
57
Push Factor
Factors that impel/push people **AWAY** from an area
New cards
58
Pull Factor
Factors that compel/pull people **TO** an area
New cards
59

Cultural Push Factors

Changes or lack thereof of societal norms

New cards
60

Demographic Push Factors

When the push factor only affects a certain demographic.

New cards
61
Economic Push Factors
Lack of economic opportunities (jobs)
New cards
62
Environmental Push Factors
Natural Disasters
New cards
63
Political Push Factors
war, conflict, oppressive government, fear of persecution, etc.
New cards
64
Environmental Pull Factors
Favorable Climate
New cards
65
Cultural Pull Factors
Religious freedom, similar ethnic groups, language, education, entertainment
New cards
66
Economic Pull Factors
\- New job opportunity

\- Lower Cost of Living

\- Higher Salary
New cards
67
Demographic Pull Factors
when the pull factor relates to the push factor

ex: refugees fleeing war are pulled to peaceful places
New cards
68
Political Pull Factors
Political freedom, stable govt, more favorable laws, fewer restrictions
New cards
69
Migration
The long-term relocation of an individual/group to another area
New cards
70
Internal Migration
Migration within an area
New cards
71
The Gravity Model
Denser and closer places have more pull on migrants than smaller and distant places

ex: Mexican migrants moving to the USA would go to San Antonio rather than Iowa
New cards
72

Step Migration

long-distance migration i done in steps

New cards
73
Intervening Opportunities
\- Assistance with the migration/transition process

ex: job opportunities, assistance programs, positive perception of immigrants, etc.
New cards
74
Intervening Obstacles
\- Hinders the migration/transition process

ex: challenging physical geography, restrictive immigration policies, cultural/language barrier, negative perception of immigrants, etc.
New cards
75
Counter/Return Migration
return of migrants to their original area

\- every migration wave triggers counter migration
New cards
76
Cyclical Movement
movement on a closed route that happens on a regular basis.
New cards
77
Activity Space
\- Area in which you go about your daily routine

\- Type of Cyclical Movement

ex: commuting
New cards
78
Pastoral Nomadism
\- Purposeful movement along specific routes

\- Type of Cyclical Movement

ex: pastoral nomads move their animals to water sources and pastures an a regular basis
New cards
79
Compelled Voluntary Migration
Someone choosing to move because of pull factors
New cards
80
Periodic Movements
ex: transhumance, seasonal movement, college students
New cards
81
Transhumance Movement
Moving animals up mountains in summer and back down in winter
New cards
82
Seasonal Movement
Seasonal movement for work
New cards
83
Chain Migration/Kinship Links
domino effect of one person migrating influencing others to migrate
New cards
84
Guest Worker
LEGAL immigrant who has a work visa

\- short-term migration
New cards
85
Remittances
\- money sent to relatives in other country

\- important part of economy for LDCs
New cards
86

Rural to Urban Migration

Migration to rural/suburban areas to urban areas

New cards
87

Forced Migration

When people are forced to migrate

New cards
88
Impelled Voluntary Migration
When people choose to leave an area due to push factors and probably won’t survive if they stay
New cards
89
Asylum Seeker
Refugee seeking legal protection
New cards
90
Refugee
\- impelled migrant

\- crosses borders
New cards
91
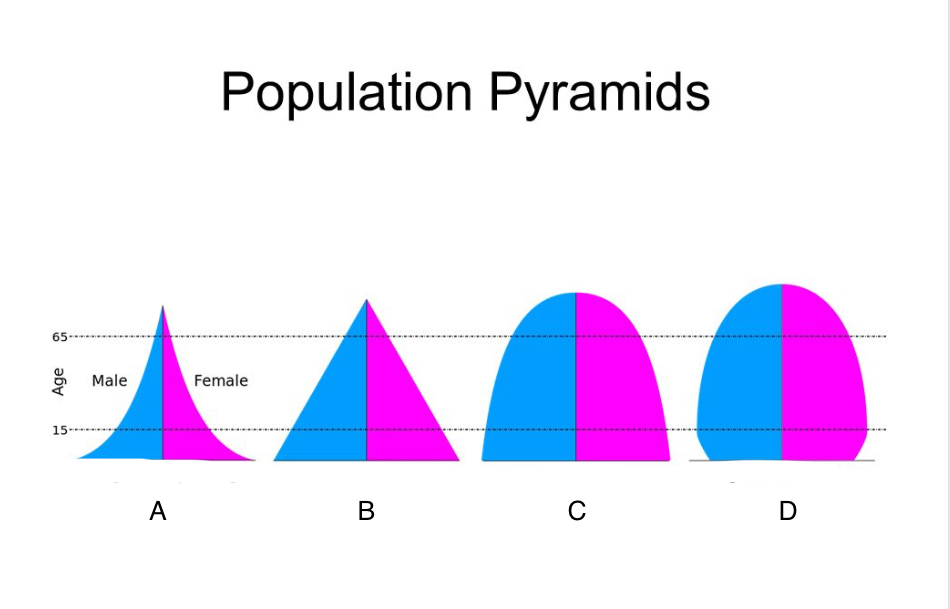
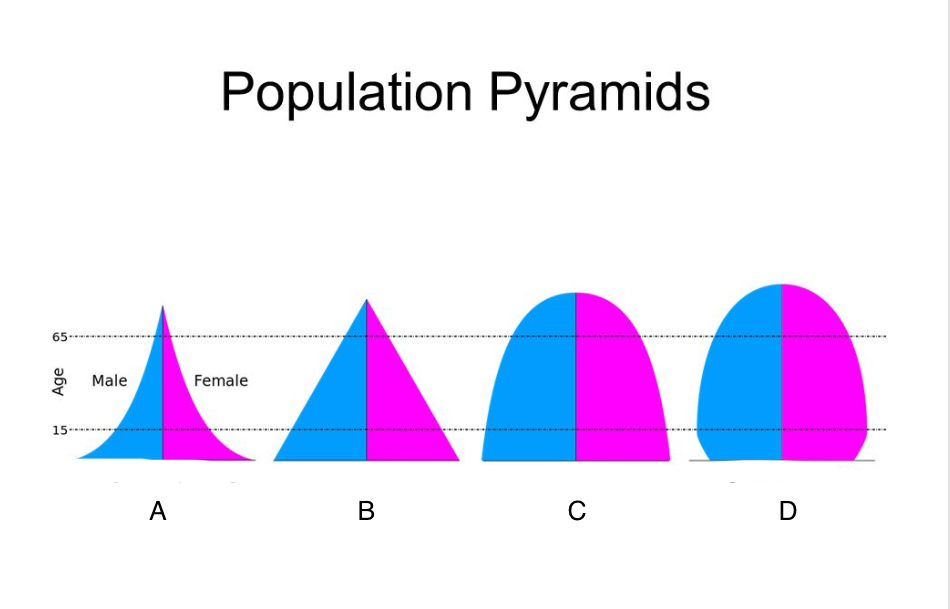
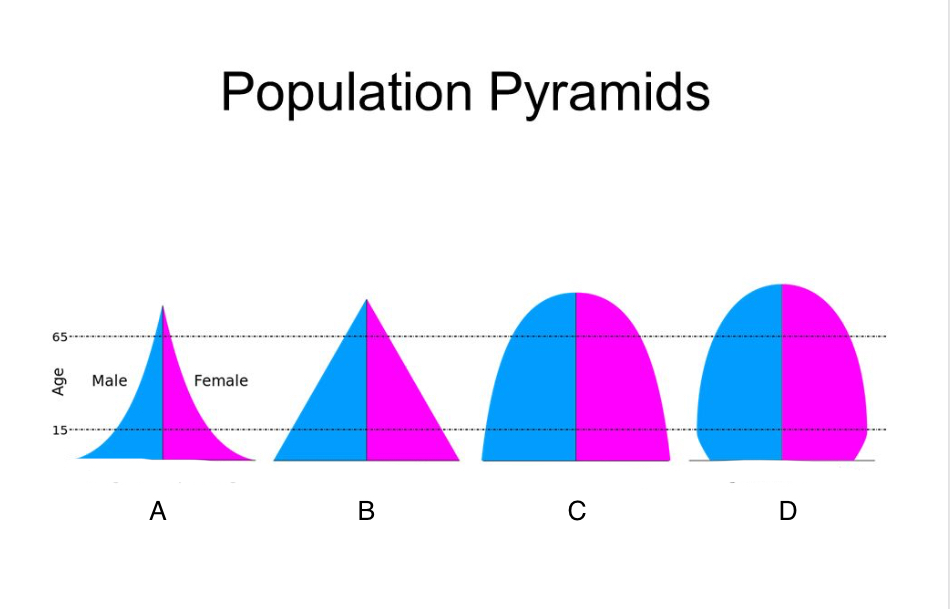
What Population Pyramid shows **Rapid** Growth?
A
New cards
92
What Population Pyramid shows **Moderate/Medium** Growth?
B
New cards
93
What Population Pyramid shows **Slow** Growth?
C
New cards
94
What Population Pyramid shows **Negative** Growth?
D
New cards
95
Population Pyramid
Bar graph that shows age-sex population distribution
New cards
96
DTM: Billy White loses his job as a gravedigger.
2
New cards
97
DTM: Parents start to think more about family planning.
3
New cards
98
DTM: Regional migration from rural areas to large urban areas.
2/3
New cards
99
DTM: Children are warmer in bed at night because they have more brothers and sisters.
2
New cards
100
DTM: There are more golden wedding anniversaries (50 year anniversary)
4/5
New cards
robot