Genetics, populations, evolution and ecosystems
1/34
There's no tags or description
Looks like no tags are added yet.
Name | Mastery | Learn | Test | Matching | Spaced | Call with Kai |
|---|
No analytics yet
Send a link to your students to track their progress
35 Terms
ecosystem
= natural unit of biotic components, together with the abiotic components through which energy flows and nutrients cycle
can range from very small (e.g. rockpool) to very large (African grassland)
simple e.g. desert, complex e.g. tropical rainforest
ecology
study of inter-relationships between organisms and their environment
abiotic factors
non-living
biotic factors
living
carrying capacity
certain size of population ecosystem can support
populations
group of individuals of one species that occupy same habitat at same time and are potentially able to interbreed
community
all populations of all different species living and interacting in a particular place at same time
habitat
place an organism normally lives, (characterised by the physical conditions and the other types of organisms present)
e.g. stream: flowing water → aquatic animals, plants, water beetles
Microhabitat
Smaller units within each habitat within own microclimate
Niche
How organism fits into environment (where it lives, what it does, adaptations to biotic and abiotic factors)
i.e. role of organism in ecosystem
Competitive exclusion principle
No 2 species occupy exactly the same niche
when 2 species competing for limited resources, one that uses resources most effectively will eliminate the other
e.g. 2 species of Paramecium
when both grown together with sufficient resources, pop density of both increases
as resources become limited, pop of P. aurelia increases and P. caudatum decreases, as P. aurelia outcompetes P. caudatum
Predator
Organism that feeds on another organism/ consumer(prey)
Not herbivore
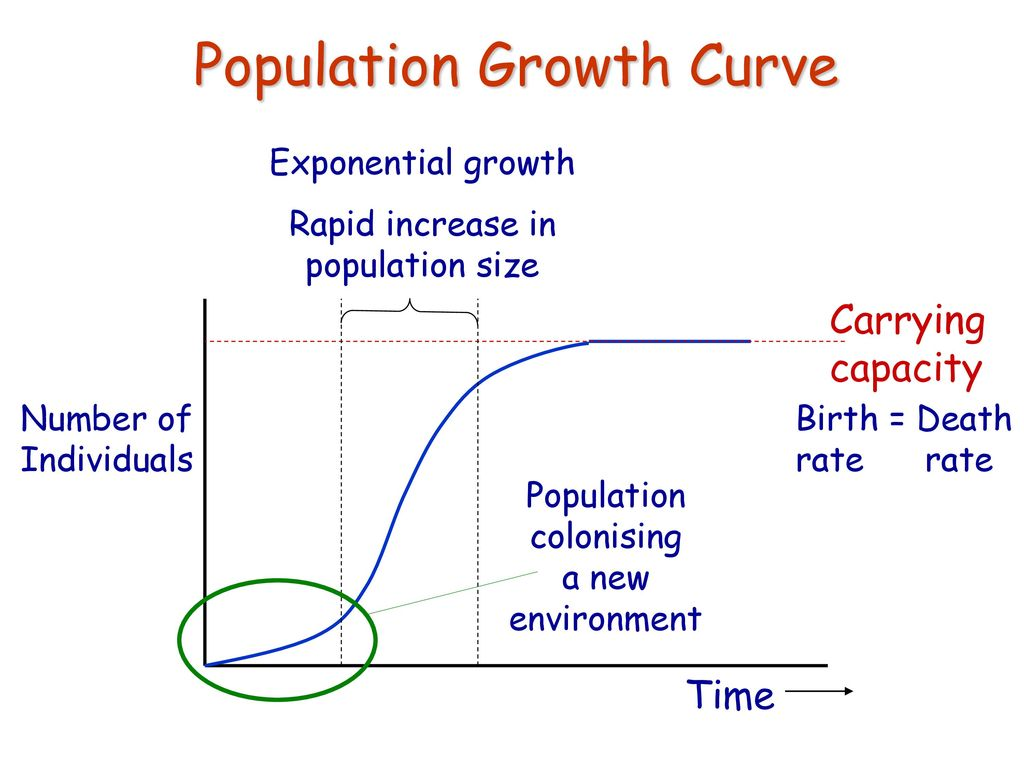
growth curves
lag phase
no increase in pop size
adjusting to environment
synthesis of enzymes (gene expression regulation)
exponential growth phase
rapid pop growth (binary fission)
plenty of nutrients (space)
low levels of (toxic) waste
(transitional phase)
plateau/ stationary phase
birth rate = death rate
resources limiting pop growth
competition for nutrition
carrying capacity (k)
max pop size supported by resources in ecosystem
decline phase (if closed culture)
pop decrease, death > birth rate
resources depleted
build up of waste products
why use log scale
display large range of values e.g. exponential graph
e.g. bacterial growth (to show rate decreasing)
carrying capacity
= max stable pop size of species that ecosystem can support
every individual within species pop has potential to reproduce and have offspring which contribute to pop growth
but abiotic and biotic factors prevent individuals reaching adulthood and reproducing
graph plateaus
abiotic factors affecting carrying capacity
e.g.
light availability
water supply
temp
amount of space available
soil pH
e.g. mammals: if temp of surrounding significantly lower/ higher than optimum body temp, will have to use significant energy to maintain optimum body temp (homeostasis)
= less energy for growth and reproduction
< individuals reach reproductive age and successfully reproduce
biotic factors affecting carrying capacity
interspecific competition
intraspecific competition
predation
interspecific competition
between individuals of different species
e.g. grey squirrels out-competed red squirrels in UK for habitat, nesting sites and food resources
grey had competitive advantage over other, so pop increased while red pop decreased
better adapted
some cases, both pop sizes limited
both have access to fewer resources and so < chance to survive and reproduce
usually occurs if 2 species similarly well-adapted to habitat
intraspecific competition
between individuals of same species
availability of resources e.g. food, water, breading sites
e.g.when resources are plentiful, pop of grey squirrels increase
as pop increase, there are > individuals competing for these resources e.g. food and shelter
at some point, resources become limiting and pop can no longer grow in size → carrying capacity reached
predation
predator and prey species have evolved alongside each other so neither become extinct
= evolutionary arms race
predator species adaptions e.g.
speed
night vision
eye sight
camouflage
prey species adaptations e.g.
toxins/ poisonous
tough skin/ shells
group protection (of vulnerable)
in stable community, number of predators and prey rise and fall in cycles, limiting pop sizes of BOTH predator ad prey
predator-prey cycles
no. of predators increase as > prey/ food available
no. of prey decrease as > predators so > are killed
no. of predators decrease as < prey available
no. of prey increase as < predators
predator-prey cycle repeats
fluctuations in pop size often < severe as food webs mean that predator may eat > 1 prey, so can eat another species
disease and climatic factors may also cause periodic pop crashes
important as create strong selection pressures
succession
ecosystems are dynamic = constantly changing
sometimes simple → complex
= succession
during succession, biotic and abiotic conditions change over time
primary succession
occurs on bare rock/ any barren terrain
no organic soil present
pioneer species colonies bare rock
pioneers break up rock surface
organic material (soil) accumulates with broken rock as beginnings of soil
soil enables seeds of small, shallow rooted plants to establish
no. of niches and species richness increases
seeds from larger taller plants appear
compete with plants already present and community changes
trees dominate community
climax community dependent on environmental conditions
species depend on those arriving by wind/ migration
secondary succession
bare soil
seeds
minerals water retention
grasses (1st species = rooted plants)
shrubs
trees
large trees
(no pioneer species)
primary and secondary succession
biodiversity increases with time (more niches)
unless dominant species in climax community
biomass increases
climax community depends on abiotic factors
changes in environment during succession
at each stage, certain species gradually change local environment so that becomes > suitable for other species (with diff adaptations) that haven’t colonised new land yet
e.g. pioneer species make abiotic conditions < hostile for new colonising species
random sampling
no bias
systematic sampling
chosen sampling points (possibility of bias)
can be unrepresentative of whole area
distribution
how species spread throughout ecosystem
abundance
no. of individuals of that species
can be measured by frequency
= likelihood of species occurring in quadrat
helpful for species difficult to count e.g. grass, but doesn’t give info on density and distribution
% cover
faster but > subjective
plants in flower often overestimated while low-growing plants underestimated
frame quadrats
quadrats laid randomly to avoid sampling bias
e.g. grid system, labelling each square with number and using random number generator
can be used to measure
no. of individuals of one species
species richness
% cover
belt transects
looking at how distribution/ abundance changes in physical conditions/ abiotic factors
systematic sampling
transect line represented by measuring tape, along which samples taken
quadrats placed at regular intervals along tape and record abundance of each species within each quadrat
produces quantitative data
mark-release-recapture
used for mobile organisms
for single species in area
1st large sample taken
as many individuals as possible caught, counted and marked
in way won’t affect their survival
returned to habitat and randomly mixes with rest of population
after sufficient period of time, another large sample captured
no. of unmarked and marked individuals within sample counted
proportion of marked to unmarked individuals, used to calculate estimate for population size
population estimate equation
N = (n1xn2)/m2
n1 = no. marked and released
n2 = no. in 2nd sample (marked + unmarked)
m2 = no. marked in 2nd sample
limitations and assumptions of m-r-r
proportion of marked to unmarked same in 1st and 2nd samples
have been no births/ deaths/ migrations over sampling period
individuals redistribute themselves evenly after 1st catch
marking doesn’t decrease individual’s chance of survival
due to increased visibility, decreased movement, toxicity etc.
mark rubbed off
individuals all equally likely to be caught
not trap-happy / trap-shy