Chapter 5 Discrete Probability Distributions
1/32
There's no tags or description
Looks like no tags are added yet.
Name | Mastery | Learn | Test | Matching | Spaced | Call with Kai | Chat |
|---|
No analytics yet
Send a link to your students to track their progress
33 Terms
A random variable is
a function that assigns numerical values to the outcomes of an experiment
Capturing uncertainty
Summarizing outcomes of an experiment
Using uppercase letter X to denote a random variable
Using lowercase letter x to denote a numerical value that X may assume
two types of random variable
Discrete random variable
Continuous random variable
Discrete random variable:
Assuming a countable number of distinct values
Continuous random variable:
Assuming uncountable values within any interval
A discrete probability distribution is
a table, formula, or graph that describes the values of a discrete random variable and the probability associated with these values
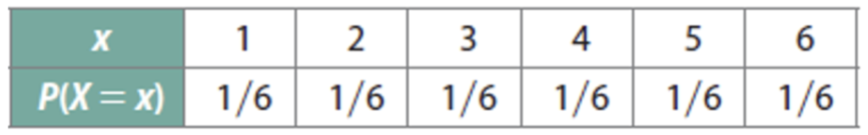
Consider the experiment of rolling a die
The probability distribution for rolling a die is:
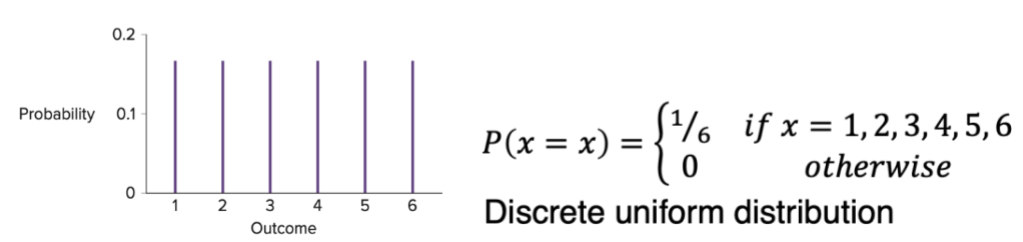
Each outcome has equally likely probability of 1/6
Graphically depict the probability distribution
The cumulative probability distribution provides
the probability that X is less than or equal to x: 𝑃(𝑋≤𝑥)
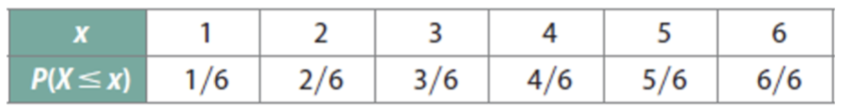
Consider the experiment of rolling a die
The cumulative probability distribution for rolling a die is:
The probability of getting a four or less:
P(X ≤4) = 4/6 = 2/3
P(X=3) = P(X ≤3) – P(X ≤2) = 3/6 – 2/6 = 1/6
Two key properties of discrete probability distributions
The probability of each value x is a value between 0 and 1
0 ≤ P(X=𝑥)≤ 1
The sum of the probabilities equals 1
∑P(X=𝑥)=1
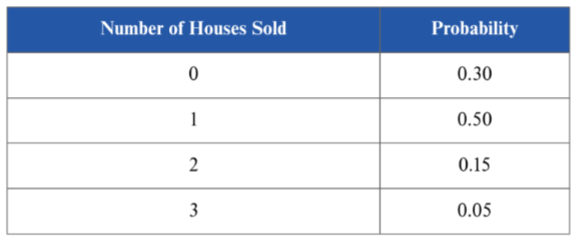
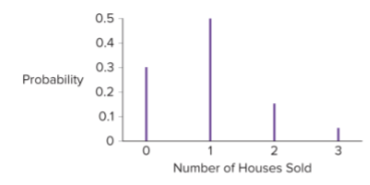
The number of homes that a realtor sells over a one-month period has the probability distribution shown in the table
What is the probability that the realtor sells at most one house in a one-month period?
What is the probability that the realtor sells at least two houses in a one-month period?
Graphically depict the probability distribution and comment on its symmetry/skewness.
What is the probability that the realtor sells at most one house in a one-month period?
P(X ≤ 1) = P(X = 0) + P(X = 1) = 0.3 + 0.5 = 0.8
What is the probability that the realtor sells at least two houses in a one-month period?
P(X ≥ 2) = P(X = 2) + P(X = 3) = 0.15 + 0.05 = 0.2
Graphically depict the probability distribution and comment on its symmetry/skewness.
The probability distribution shows not symmetric, but it is positively skewed
Three summary measures for a random variable
Mean (Expected Value)
Variance
Standard Deviation
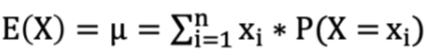
The expected value of the discrete random variable X is
a weighted average of all possible values of X
Providing a measure of the central location of the distribution X
Calculated as E(X)=μ=∑_(i=1)^n x_i∗P(X= x_i)
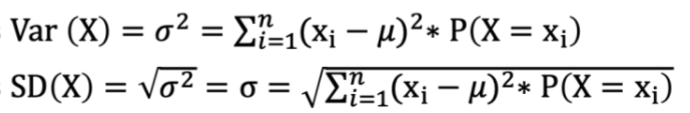
The measures of variance and standard deviation indicate
whether the values of X widely scattered from μ
Providing measures of dispersion of the distribution X
Calculated as Var (X)=𝜎^2=∑_(𝑖=1)^𝑛 (x_i−𝜇)^2 ∗P(X=x_i )
Calculated as SD(X)=√(𝜎^2 )=σ=√(∑_(𝑖=1)^𝑛 (x_i−𝜇)^2 ∗P(X=x_i ) )
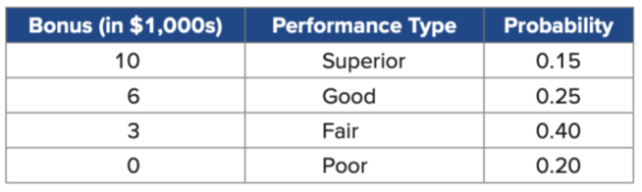
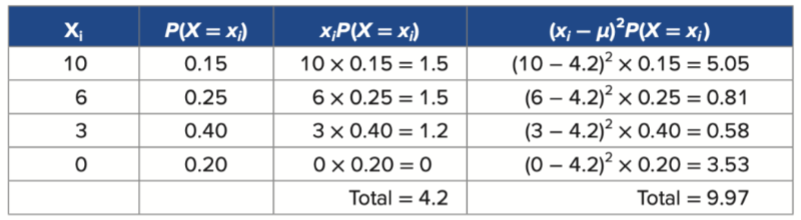
Brad Williams is the owner of a large car dealership in Chicago. Brad decides to construct an incentive compensation program that equitably and consistently compensates employees on the basis of their performance. (Using E(X)=∑_(i=1)^n x_i∗P(X= x_i))
Calculate the expected value of the annual bonus amount
Calculate the variance and standard deviation of the annual bonus amount (Using Var (X)=∑_(𝑖=1)^𝑛 (x_i−𝜇)^2 ∗P(X=x_i ) )
What is the total annual amount that Brad can expect to pay in bonuses if he has 25 employees
Calculate the expected value of the annual bonus amount
𝐸(𝑋)=𝜇=∑𝑥_𝑖∗𝑃(𝑋=𝑥_𝑖 ) =4.2 or $4,200
Calculate the variance and standard deviation of the annual bonus amount (Using Var (X)=∑_(𝑖=1)^𝑛 (x_i−𝜇)^2 ∗P(X=x_i ) )
𝑉𝑎𝑟(𝑋)=𝜎^2=∑(𝑥_𝑖−𝜇)^2 𝑃(𝑋=𝑥_𝑖 )=9.97 (in ($1,000s)^2)
𝑆𝐷(𝑋)=𝜎=√(𝜎^2 )=√9.97=3.158 or $3,158
What is the total annual amount that Brad can expect to pay in bonuses if he has 25 employees
If Brad has 25 employees, we can expect to pay
$4,200*25 = $105,000 in bonuses
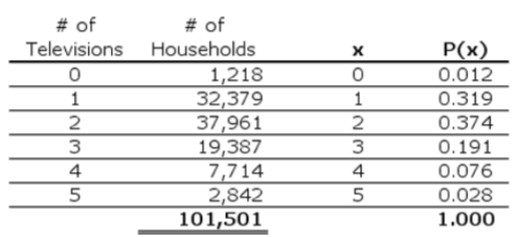
Suppose the table shows the probability distribution for the number of televisions in given household
Calculate the expected value (Using E(X)=∑_(i=1)^n x_i∗P(X= x_i))
Calculate the variance (Using Var (X)=∑_(𝑖=1)^𝑛 (x_i−𝜇)^2∗P(X=x_i ) )
Calculate the standard deviation
Calculate the expected value (Using E(X)=∑_(i=1)^n x_i∗P(X= x_i))
E(X)=𝜇=∑_(all x x∗P(X)=0∗P(0)+1∗P(1)+2∗P(2)+
3∗P(3)+4∗P(4)+5∗P(5)=0∗0.012+1∗0.319+2∗0.374+3∗0.191+4∗0.076+
5∗0.028=2.084
Calculate the variance (Using Var (X)=∑_(𝑖=1)^𝑛 (x_i−𝜇)^2∗P(X=x_i ) )
Var(X)=𝜎^2=∑_(all x) (𝑥−𝜇)^2∗P(X)=(0−2.084)^2∗0.012+
(1−2.084)^2∗0.319+(2−2.084)^2∗0.374+ (3−2.084)^2∗0.191+(4−2.084)^2∗0.076+(5−2.084)^2∗0.028=1.107
Calculate the standard deviation
σ=√(𝜎^2 )=√1.107=1.052
Let X be
a random variable
Let c be
a constant
Laws of Expected Value
E(c)=c
E(X+c)=E(X)+c
E(X∗c)=c∗E(X)
Laws of Variance
Var(c)=0
Var(X+c)=Var(X)
Var(X∗c)=c^2∗Var(X)
Suppose the average score on the first test is 80, and the variance is 10. If a professor decided to add 5 points to each student’s grade.
Calculate the new average score
Calculate the new variance
Calculate the new average score
E(X+c)=E(X)+c=80+5=85
Calculate the new variance
Var(X+𝑐)=Var(X)=10
Suppose the average score on the first test is 80, and the variance is 10. If a professor decided to multiply by 1.1 to each student’s grade.
Calculate the new average score
Calculate the new variance
Calculate the new average score
E(c∗𝑋)=𝑐∗𝐸(𝑋)=1.1∗80=88
Calculate the new variance
Var(c∗X)=𝑐^2∗Var(X)=1.1^2∗10=12.1
Different types of experiments generate different probability distributions
The Binomial Distribution
The Poisson Distribution
The Hypergeometric Distribution
A binomial random variable X is defined as
the number of successes achieved in the n trials of a Bernoulli process of an experiment
A Bernoulli process consists of a series of n independent and identical trials of an experiment
(Only two possible outcomes: success (p) and failure (1 - p))
The possible values (X) include 0, 1,…, n
Binomial Experiment
Fixed number (n) of trials
Two possible outcomes for each trial (“success” and “failure”)
P(success) = p, P(failure) = 1 − p
Trials are independent: outcome of one trial does not affect the outcomes of any other trials
Binomial Experiment Examples
A customer defaults or does not default on a loan
The number of heads in ten tosses of a fair coin
A drug is either effective or ineffective
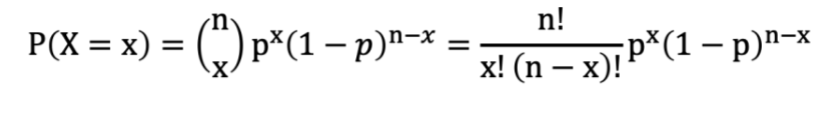
For a binomial random variable X, the probability of x successes in n Bernoulli trials is

Example question: Find the probability of getting 2 times of head when flipping a coin 5 times (p = 0.5, x = 2, n = 5)
(5! / (2!(5-2)!)) (.5)² ((1-.5)^(5-2))= .3125
Factorial of a non-negative integer n, denoted by n!
n!=n ×(𝑛−1)×(𝑛−2)×… ×2×1
5!=5×4×3×2×1=120
0!=1 (by definition)
Pat is a student who is taking a test and his exam strategy is guessing the answers. There are 10 multiple choice questions with five possible answers in the exam. If there is only one answer for each question,
What is the probability that Pat gets no answers correct?
What is the probability that the Pat gets two answers correct?
What is the probability that Pat gets no answers correct?
P(X=0)=10!/0!(10−0)! 0.2^0 (1−0.2)^(10−0)=1∗1∗(0.8)^10≈0.1074
What is the probability that the Pat gets two answers correct?
P(X=2)=10!/2!(10−2)! 0.2^2 (1−0.2)^(10−2)=45∗0.04∗(0.8)^8≈0.302
For a binomial random variable X, the probability of x successes in n Bernoulli trials
Expected Value
E(X)=μ=n∗p
Variance
Var(X)=σ^2=npq=np∗(1−p)
Standard Deviation
SD(X)=σ=√(np∗(1−P))
Pat is a student who is taking a test and his exam strategy is guessing the answers. There are 10 multiple choice questions with five possible answers in the exam. If there is only one answer for each question,
Expected value:E(X)=μ=np
Variance:Var(X)=σ^2=npq=np∗(1−p)
Calculate the expected mean, variance, and standard deviation.
n=10, p=0.2
E(X)=μ=np=10∗0.2=2
Var(X)=σ^2=np∗(1−p)=10∗0.2∗0.8=1.6
SD(X)=σ=√(np∗(1−P))=√1.6=1.26
In the U.S., about 30% of adults have four-year college degrees (U.S. Census Bureau, 2018). Suppose five adults are randomly selected P(X=x)=n!/x!(n−x)! p^x (1−p)^(n−x),E(X)=np,Var(X)=npq=np∗(1−p)
Find the probability that none of adults has a college degree?
Find the probability that no more than two of the adults have a college degree?
Find the probability at least two of adults have a college degree?
Calculate the expected value, variance, and standard deviation
Find the probability that none of adults has a college degree?
P(X=0)=5!/0!(5−0)! 0.3^0 (1−0.3)^(5−0)=1∗1∗(0.7)^5≈0.1681
Find the probability that no more than two of the adults have a college degree?
P(X≤2)= P(X=0)+P(X=1)+P(X=2)
P(X=1)=5!/1!(5−1)! 〖0.3〗^1 (1−0.3)^(5−1)=5∗0.3∗(0.7)^4≈0.3602
P(X=2)=5!/2!(5−2)! 〖0.3〗^2 (1−0.3)^(5−2)=10∗0.09∗(0.7)^3≈0.3087
P(X≤2)=0.1681+0.3602+0.3087=0.8307
Find the probability at least two of adults have a college degree?
P(X≥2)=1−[P(X=0)+P(X=1)]=1−(0.1681+0.3602)
= 0.4717
Calculate the expected value, variance, and standard deviation
E(X)=μ=np=5∗0.3=1.5 adults
Var(X)=σ^2=np∗(1−p)=5∗0.3∗0.7=1.05
SD(X)=σ=√(np∗(1−P))=√1.05=1.02
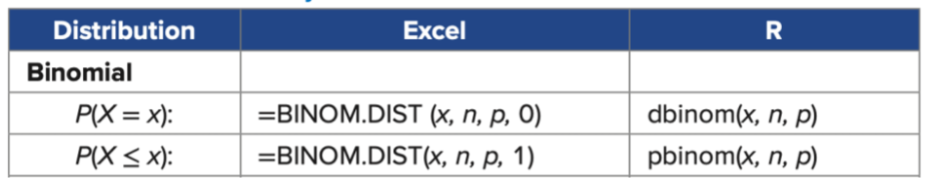
Excel and R functionality
Example question 1: Find the probability of getting 5 times of head when flipping a coin for 10 times
Example question 2: Find the probability of getting 4 times of head or less when flipping a coin for 10 times
(x = 5 , n = 10, p = 0.5) 𝑃(𝑋=5)=BINOM.DIST (5, 10, 0.5, 0)≈0.2461
𝑃(𝑋≤4)=BINOM.DIST (4, 10, 0.5, 1)≈0.377