ECN 104
0.0(0)
0.0(0)
Card Sorting
1/143
Earn XP
Study Analytics
Name | Mastery | Learn | Test | Matching | Spaced |
|---|
No study sessions yet.
144 Terms
1
New cards
Scarcity
We can’t have everything because everything is limited money, time and energy
2
New cards
Oppourtunity Cost
The cost of the best alternative given up
(Give up/Get)
(Give up/Get)
3
New cards
Smart choice (Voluntary Trade)
The value of what you get must be greater than the value of what you give up
4
New cards
Absolute Advantage
The ability to produce a product/service at a lower absolute cost than another producer
No basis for trade
No basis for trade
5
New cards
Comparative Advantage
The ability to produce a product/service at a lower Oppourtunity cost than another producer (more efficiently)
Basis for trade
Basis for trade
6
New cards
Trades
Make induviduals better off when each specializes in producing a product/service with comparative advantage
7
New cards
Production Possibility Frontier
A graph that shows the maximum combinations of products/services that can be produced with existing inputs
8
New cards
Points Above the PPF
Not attainable and not efficient
9
New cards
Points Under the PPF
Attainable but not efficient (all resources are not being used)
10
New cards
Points on The PPF
Attainable and efficient (all resources are being used)
11
New cards
Economic Model (Circular Flow Model)
Consists of 3 players-Consumers, producers and the government who interact in 2 markets-Input and Output
In input markets, households are sellers, businesses are buyers
In output markets, households are buyers, businesses are sellers
In input markets, households are sellers, businesses are buyers
In output markets, households are buyers, businesses are sellers
12
New cards
Inputs
Productive resources-labour, natural resources, capital equipment and entrepreneurial ability used to produce products and services
13
New cards
Marginal
‘’Additional” benefits from the next choice
Marginal Benefits= Δ Total benefit/ Δ Total quantity
Marginal Benefits= Δ Total benefit/ Δ Total quantity
14
New cards
Marginal Opportunity Cost
‘’Additional” Oppourtunity costs from the next choice
Marginal Opportunity cost= Δ Opportunity cost/ Δ Total quantity
Marginal Opportunity cost= Δ Opportunity cost/ Δ Total quantity
15
New cards
Implicit Cost
Opportunity costs of investing your own money/time
16
New cards
When marginal benefit is larger than marginal opportunity cost (MB>MOC)
Consume or produce more (wanted)
17
New cards
When marginal opportunity cost is larger than marginal benefit (MB
Consume or produce less (not wanted)
18
New cards
When Marginal benefit equals marginal oppourtunity cost (MB=MOC)
Indifference-consume or produce more (wanted)
19
New cards
The Law of Demand
If the price of a product/service rises, quantity demanded decreases (all other factors remaining the same)
20
New cards
Quantity demanded
The amount you actually plan to buy at a given price
21
New cards
Market demand
The sum of demands of all induviduals willing/able to buy a particular product/service
22
New cards
Demand curve
Illustrates the relationship between price and quantity demanded (all other factors remaining the same)
23
New cards
To read a demand curve
Read over and down
24
New cards
To read a marginal benefit curve
Read up and over
25
New cards
Change in Quantity Demanded
An increase in quantity demanded is a movement down the demand curve
A decrease in quantity demanded is a movement up along the demand curve
A decrease in quantity demanded is a movement up along the demand curve
26
New cards
Increase in demand
Increase in consumers willingness/ability to pay-rightwards shift of the demand curve
27
New cards
Decrease in demand
Decrease in consumers willingness/ability to pay-leftward shift of the demand curve
28
New cards
Substitutes
Prouducts/Service used in -lace of each other to satisfy the same want
29
New cards
Complements
Products/Services used together to satisfy the same want
30
New cards
Substitutes and Demand
As the price for one substitute increases, the demand for the other substitute will increase
As the price for one substitute decreases, the demand for the other substitute will decrease
As the demand for one substitute increases, the demand for the other substitute will decrease
As the demand for one substitute decreases, the demand for the other substitute will increase
As the price for one substitute decreases, the demand for the other substitute will decrease
As the demand for one substitute increases, the demand for the other substitute will decrease
As the demand for one substitute decreases, the demand for the other substitute will increase
31
New cards
Complements and Demand
As the price for one complement increases, the demand for the other complement will decrease
As the price for one complement decreases, the demand for the other complement will increase
As the demand for one complement increases, the demand for the other complement will increase
As the demand for one complement decreases, the demand for the other complement will decrease
As the price for one complement decreases, the demand for the other complement will increase
As the demand for one complement increases, the demand for the other complement will increase
As the demand for one complement decreases, the demand for the other complement will decrease
32
New cards
Normal Goods
Products/services you buy more of when your income
33
New cards
Inferior Goods
Products/Services you buy less of when your income increases
34
New cards
Normal goods and Demand
As income increases, demand increases
As income decreases, demand decreases
As income decreases, demand decreases
35
New cards
Inferior Goods and Demand
As income increases, demand decreases
As income decreases, demand increases
As income decreases, demand increases
36
New cards
Future Prices and Demand
As the expected future price increases, the demand today increases
As the expected future price decreases, demand today decreases
As the expected future price decreases, demand today decreases
37
New cards
Marginal Cost
Additional opportunity cost of increasing quantity supplied
Marginal Cost= Δ Total cost/ Δ Quantity
Marginal Cost= Δ Total cost/ Δ Quantity
38
New cards
Marginal Cost for Supply
Marginal cost is the opportunity cost of time
Marginal cost increases as your quantity supplied increase
Marginal benefit is measured in ($)
Marginal cost increases as your quantity supplied increase
Marginal benefit is measured in ($)
39
New cards
Marginal Benefit for Demand
Marginal benefit is the satisfaction you get
Marginal benefit decreases as your quantity demanded increases
Marginal cost is measured in ($)
Marginal benefit decreases as your quantity demanded increases
Marginal cost is measured in ($)
40
New cards
Supply
Businesses willingness to produce a particular product/service because price covers all opportunity costs
41
New cards
Quantity Supplied
The quantity you actually plan to supply at a given price
42
New cards
Market Supply
Sum of supplies of all business willing to produce a particular product/service
43
New cards
Law of Supply
If the price of a product/service increases, quantity supplied increases
44
New cards
Supply curve
Illustrates the relationship between price/quantity supplied (other things remaining the same)
45
New cards
Change in Quantity
An increase in quantity supplied is a movement up along a supply curve
A decrease in quantity supplied is a movement down along a supply curves
A decrease in quantity supplied is a movement down along a supply curves
46
New cards
Change in Supply
An Increase in supply is a rightwards shift of the supply curve
A decrease in supply is a leftwards shift of the supply curve
A decrease in supply is a leftwards shift of the supply curve
47
New cards
Future Price and Supply
As the expected future price increases, supply now decreases
As the expected future price decreases, supply now increases
As the expected future price decreases, supply now increases
48
New cards
Input Price and Supply
As the price of an input increases, the supply decreases
As the price of an input decreases, the supply increases
As the price of an input decreases, the supply increases
49
New cards
Market
The interactions between buyers and sellers
50
New cards
Shortage (excess demand)
When quantity demanded exceeds quantity supplied
Shortages create pressure for prices to rise
Rising prices provide signals to business to increase quantity supplied and for consumers to decrease quantity demanded, elimating the shortage
Shortages create pressure for prices to rise
Rising prices provide signals to business to increase quantity supplied and for consumers to decrease quantity demanded, elimating the shortage
51
New cards
Frustrated Buyers
Market price too low
52
New cards
Frustrated Sellers
Market price too high
53
New cards
Surplus (excess supply)
Where quantity supplied exceeds quantity demanded
Surpluses create pressure for prices to fall
Falling prices provide signals to business to decrease quantity supplied and for consumers to increase quantity demanded, eliminating the surplus
Surpluses create pressure for prices to fall
Falling prices provide signals to business to decrease quantity supplied and for consumers to increase quantity demanded, eliminating the surplus
54
New cards
Market Clearing Price
The price that equalizes quantity demanded and quantity supplied
55
New cards
Equilibrium Price
The price that balances forces of competition and cooperation, there is no tendency for change
56
New cards
Effect of Demand on Quantity Supplied
As demand increases, equilibrium price increases and quantity supplied increases
As demand decreases, equilibrium price decreases and quantity supplied decreases
As demand decreases, equilibrium price decreases and quantity supplied decreases
57
New cards
Effect of Supply on Quantity Demanded
As supply increases, the equilibrium price decreases and quantity demanded increases
As supply decreases, the equilibrium price increases and quantity demanded decreases
As supply decreases, the equilibrium price increases and quantity demanded decreases
58
New cards
Increase in both demand and supply
Quantity increases
Price is ambiguous
Price is ambiguous
59
New cards
Decrease in both demand and supply
Quantity decreases
Price is ambiguous
Price is ambiguous
60
New cards
Increase in demand and decrease in supply
Price increases
Quantity is ambiguous
Quantity is ambiguous
61
New cards
Increase in supply and decrease in demand
Price decreases
Quantity is ambiguous
Quantity is ambiguous
62
New cards
Consumer Surplus
The difference between the amount a consumer is willing and able to pay and the price actually paid-the area under the marginal benefit curve but above market price
CS=(Willing-Actual)xQunantity
CS=(Willing-Actual)xQunantity
63
New cards
Producer Surplus
The difference between the amount a producer is willing to accept and the price actually received-the area below market price but above the marginal cost curve
PS=(Equilibrium price-marginal cost)
PS=(Equilibrium price-marginal cost)
64
New cards
Efficient Market Outcome
Consumers only buy products/services where marginal benefit is greater than price
Products and services are produced at the lowest cost-prices just cover all opportunity costs of production
Marginal benefit=Marginal cost
Total surplus is at a maximum
Products and services are produced at the lowest cost-prices just cover all opportunity costs of production
Marginal benefit=Marginal cost
Total surplus is at a maximum
65
New cards
Deadweight Loss
Decrease in total surplus compared to an economically efficient outcome
Deadweight Loss= loss of CS+loss of PS
Deadweight Loss= loss of CS+loss of PS
66
New cards
Elasticity (price elasticity of demand)
m= % change in quantity demanded/ % change in price
67
New cards
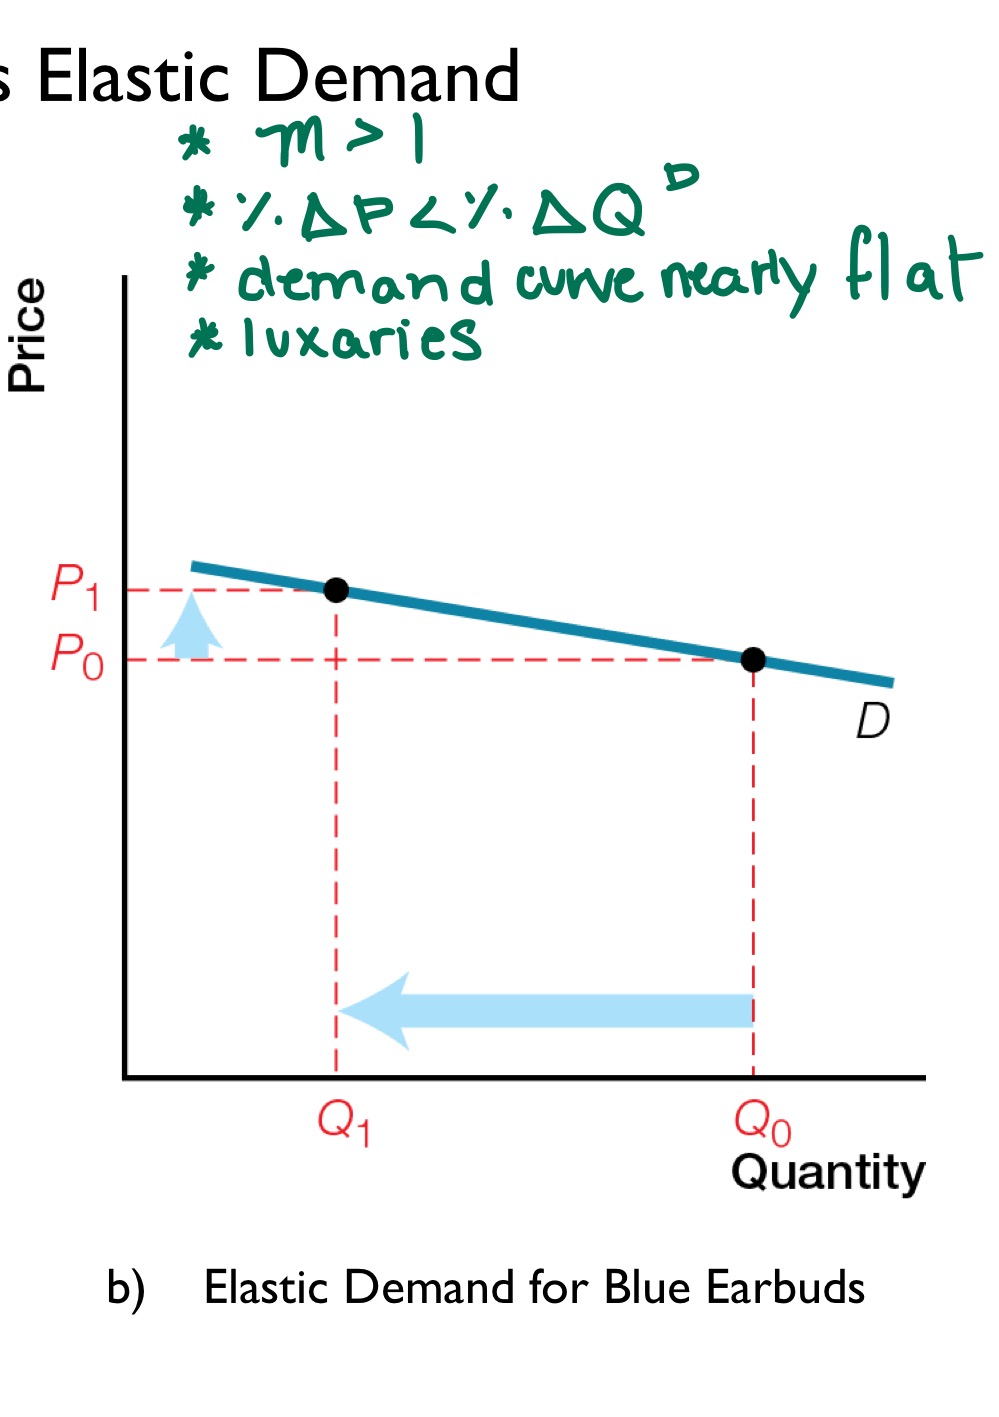
Elastic Demand
Large response in quantity demanded when prices increase
Where m>1 (larger than 1)
Demand curve is nearly flat
Usually for Luxury items Thant are not necessary to buy perfectly inelastic\
Where m>1 (larger than 1)
Demand curve is nearly flat
Usually for Luxury items Thant are not necessary to buy perfectly inelastic\
68
New cards
Inelastic Demand
Small response to quantity demanded when prices increase
Where 0
Where 0
69
New cards
Perfectly Inelastic Demand
Quantity demanded does not respond to change in price
Where m=0
Demand curve is vertical
Completely unresponsive to price changes
Where m=0
Demand curve is vertical
Completely unresponsive to price changes
70
New cards
Perfectly Elastic Demand
Quantity demanded has infinite response to change in price
Where m=infinity
Demand curve is horizontal
Completely responsive to price changes
Where m=infinity
Demand curve is horizontal
Completely responsive to price changes
71
New cards
Influences on Elasticity
Available substitutes-more substitutes mean more elastic demand
Time to adjust-longer time to adjust means more elastic demand
Proportion of Income Spent-greater proportion of income spent on a product/service means more elastic demand
Time to adjust-longer time to adjust means more elastic demand
Proportion of Income Spent-greater proportion of income spent on a product/service means more elastic demand
72
New cards
Total Revenue (TR)
All money a business receives form sales
For businesses facing elastic demand (m>1), price cuts increase total revenue
For business facing Inelastic demand (m
For businesses facing elastic demand (m>1), price cuts increase total revenue
For business facing Inelastic demand (m
73
New cards
Elasticity of Supply
Measures by how much quantity supplied responds to a change in price
m= % change in quantity supplied/ % change in price
m= % change in quantity supplied/ % change in price
74
New cards
Inelastic Supply
Small response in quantity supplied when prices rise
Where m
Where m
75
New cards
Elastic Supply
Large response in quantity supplied when prices rise
Where m>1
Easy and inexpensive to increase production
Where m>1
Easy and inexpensive to increase production
76
New cards
Perfectly Inelastic Supply
Quantity Supplied does not respond to change in price
Where m=0
Supply curve is vertical
Where m=0
Supply curve is vertical
77
New cards
Perfectly Elastic Supply
Quantity supplied has infinite response to change in price
Where m=infinity
Supply curve is horizontal
Where m=infinity
Supply curve is horizontal
78
New cards
Influences on Elasticity of supply
Availability of additional inputs-more available inputs men more elastic supply
Time production takes-less time means more elastic supply
Time production takes-less time means more elastic supply
79
New cards
Cross elasticity of demand
Measures responsiveness of the demand for a product/service to a change in price of a substitute/complement
m= % change in quantity demanded/ % change in price of substitute/complement
m= % change in quantity demanded/ % change in price of substitute/complement
80
New cards
Cross elasticity of Demand Substitutes
Cross elasticity of demand is a positive number for substitutes
The larger the number, the larger the change in demand, the larger the shift of the demand curve and the closer the products/services are to perfect substitutes
The larger the number, the larger the change in demand, the larger the shift of the demand curve and the closer the products/services are to perfect substitutes
81
New cards
Cross elasticity of demand complements
Cross elasticity of demand is a negative number for complements
The larger the number, the larger the change in demand, the larger the shift of the demand curve and the closer the products/services are to perfect complements
The larger the number, the larger the change in demand, the larger the shift of the demand curve and the closer the products/services are to perfect complements
82
New cards
Income elasticity of demand
Measures responsiveness of the demand for a product/service to a change in income
m= % change in quantity demanded/ % change in income
m= % change in quantity demanded/ % change in income
83
New cards
Income elasticity of demand for Normal goods
Positive for normal goods-increase in income increases demand for normal goods
84
New cards
Income elasticity of demand for Inferior goods
Negative for inferior goods-increase in income decreases demand for inferior goods
85
New cards
Income Inelastic Demand
% change in quantity is less than the % change in price
Where 0
Where 0
86
New cards
Income Elastic Demand
% change in quantity is greater than % change in price
Where m>1
Normal goods that are luxuries
Where m>1
Normal goods that are luxuries
87
New cards
Tax Incidnece
The division of a tax between buyers and sellers-depends on elasticities of demand and supply
88
New cards
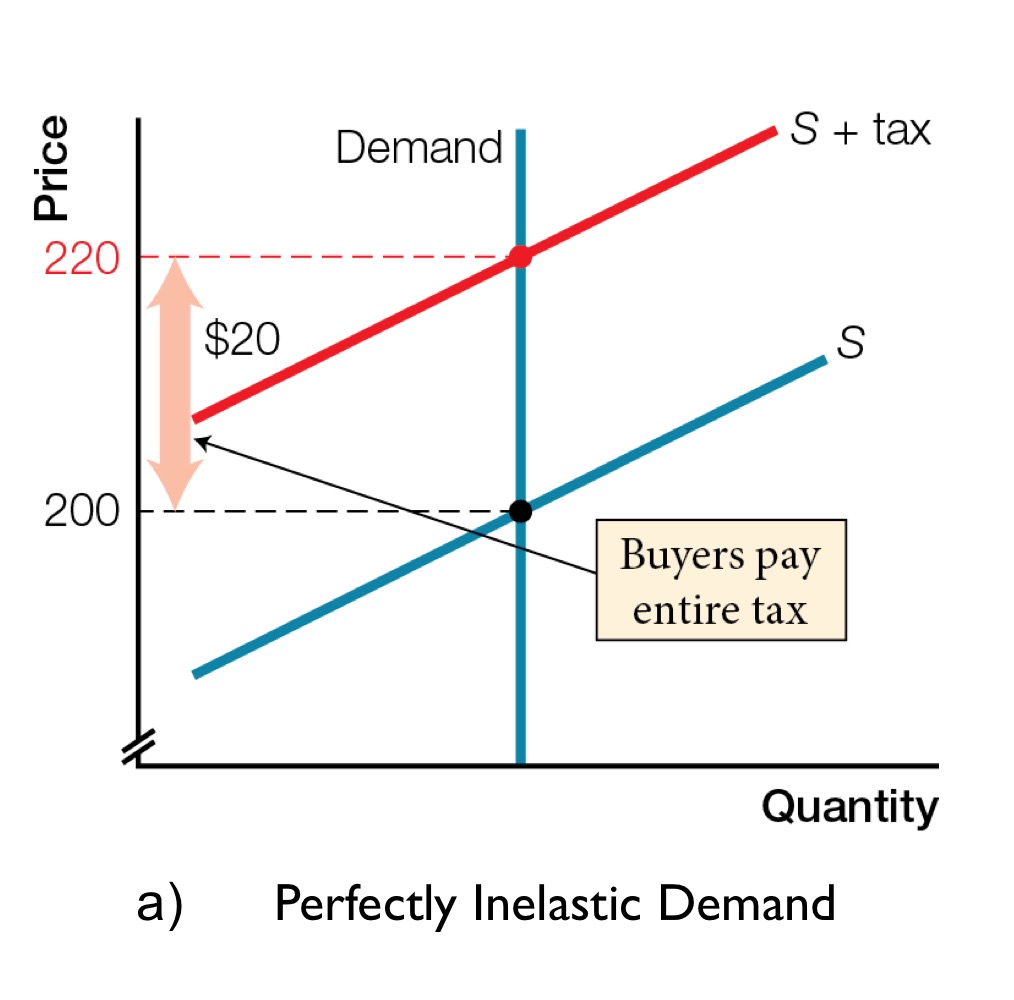
Tax Incidence of Perfectly Inelastic Demand
Buyers Pay all
89
New cards
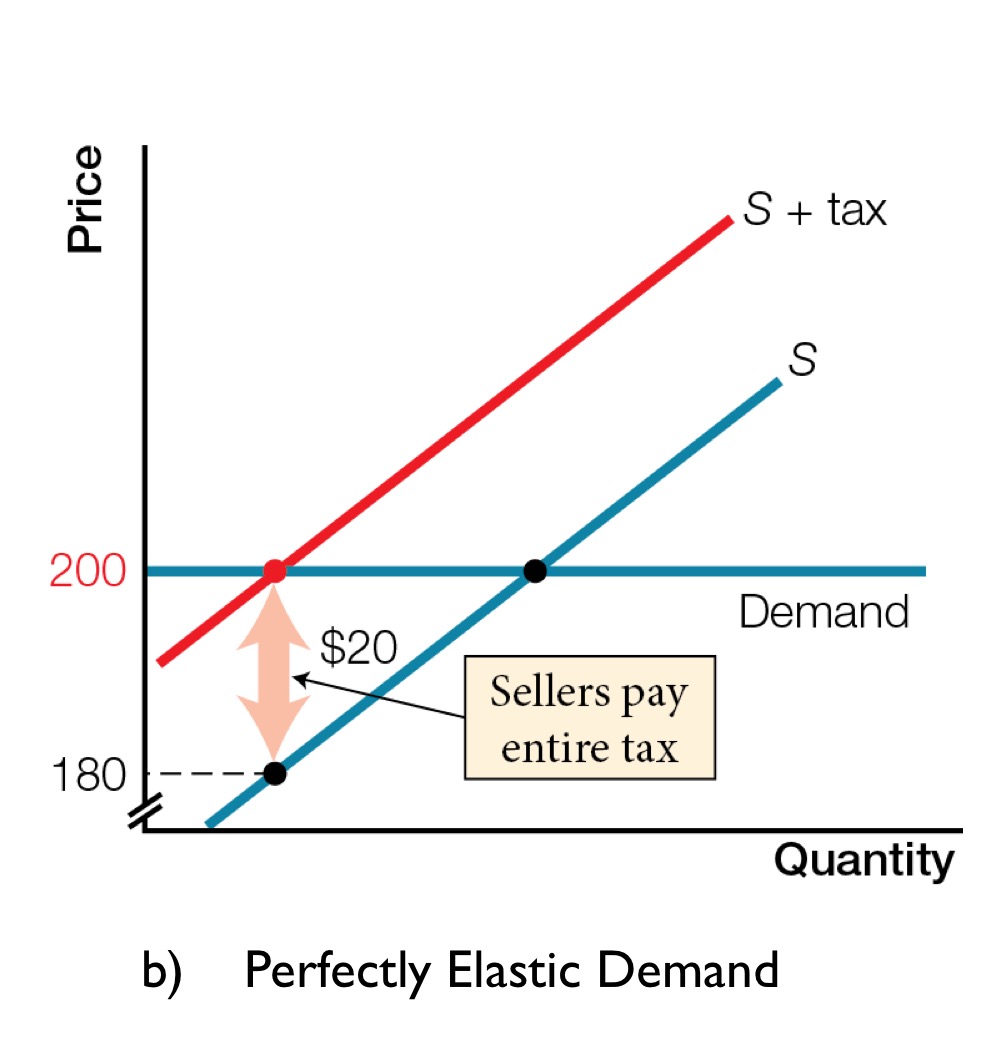
Tax incidence of perfectly elastic demand
Sellers pay all
90
New cards
Tax Incidence on more Inelastic demand
Buyers pay more
91
New cards
Tax incidence on more elastic demand
Sellers pay more
92
New cards
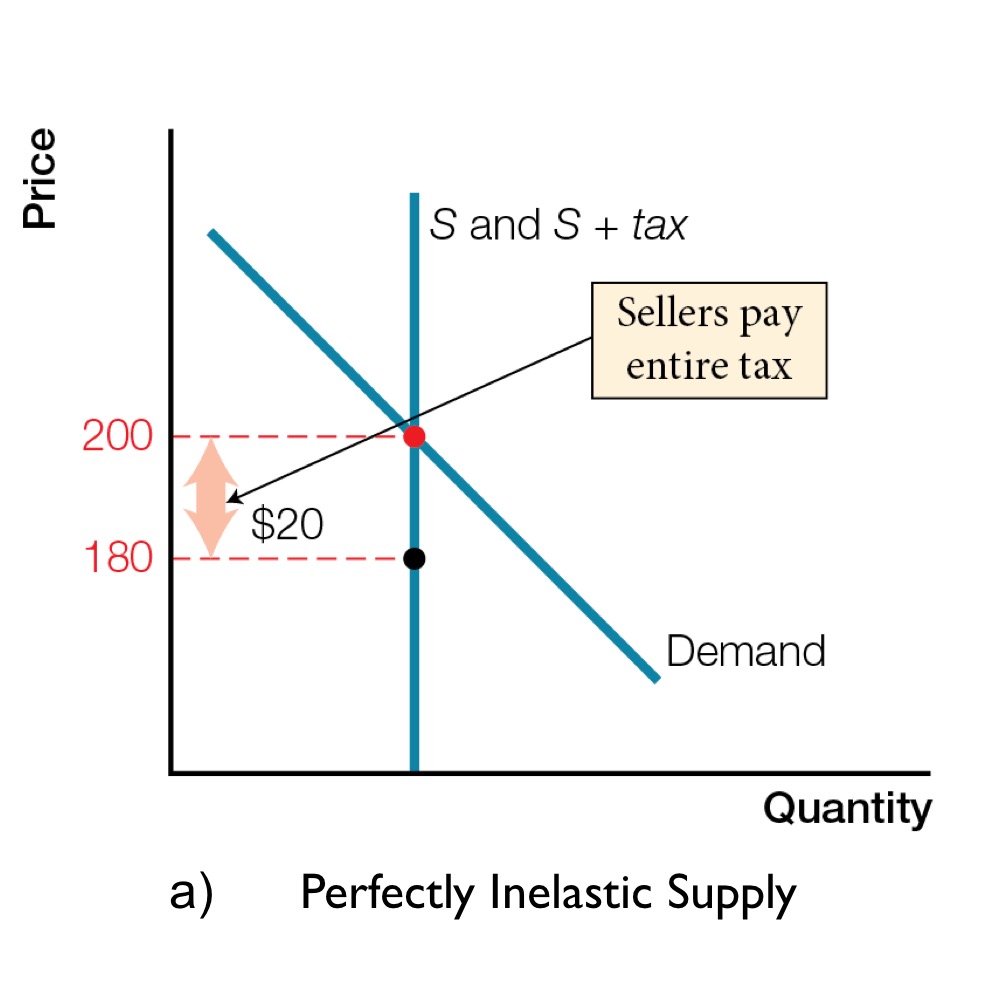
Tax incidence on perfectly Inelastic supply
Sellers pay all
93
New cards
Tax incidence on more Inelastic supply
Sellers pay more
94
New cards
Tax incidence on more elastic supply
Buyers pay more
95
New cards
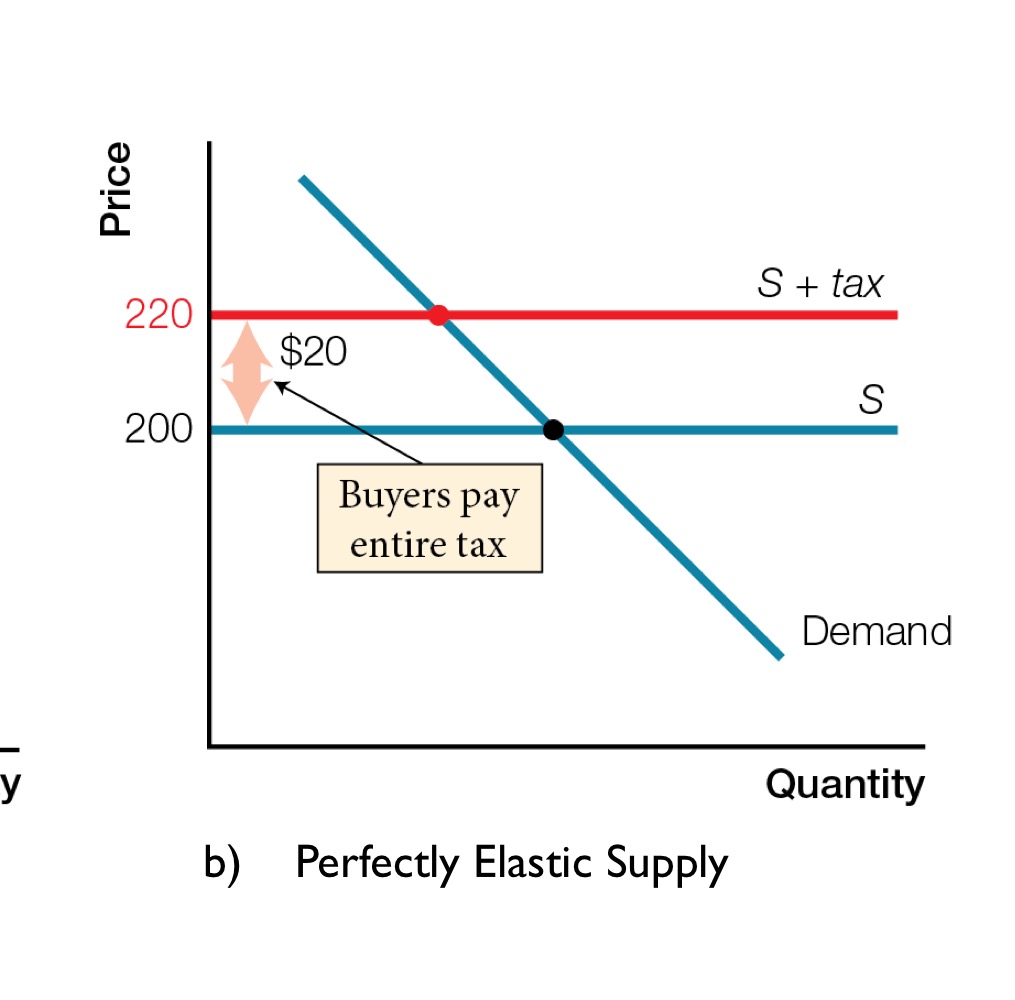
Tax incidence on perfectly elastic supply
Buyers pay all
96
New cards
When price is fixed below market-clearing
Shortages develop-quantity demanded > quantity supplied
Consumers are frustrated
Consumers are frustrated
97
New cards
When price is fixed above market clearing
Surpluses develop-quantity supplied > quantity demanded
Businesses are frustrated
Businesses are frustrated
98
New cards
Governments can fix prices
But can’t force businesses/consumers to produce/buy at the fixed price
Businesses can reduce output or move resources elsewhere
Consumers can reduce purchases or buy something else
Businesses can reduce output or move resources elsewhere
Consumers can reduce purchases or buy something else
99
New cards
Price ceiling
Maximum price set by the government-making it illegal to charge a higher price
Ex.rent controls
Ex.rent controls
100
New cards
Robin Hood Principle
Take from the rich (landlords) and give to the poor (tenants)