Normal Applied Year 1 definitions
1/130
There's no tags or description
Looks like no tags are added yet.
Name | Mastery | Learn | Test | Matching | Spaced | Call with Kai |
|---|
No analytics yet
Send a link to your students to track their progress
131 Terms
Population
Entire set of items in the group being studied
Census
Measuring every member of a population
accurate
Expensive
Some testing destroys items
Time consuming
Hard to process large quantity of data
Sampling frame
List of sampling units. Sampling units individually named or numbered.
E.g. database of ___ who/which___
Sample
Subset of the population intended to represent the population.
less time consuming and expensive
Less data to process
Not as accurate
Sample may not be large enough to give info on smaller subgroups
Sampling units
Individual units of a population
ALWAYS MENTION SAMPLING FRAME FOR ANY SAMPLING TECHNIQUE!!!!
Simple random sampling (definition, pros, cons)
every member if population has equal chance of being selected
In sampling frame, each item has unique identifying number
Use random number generator/lottery sampling
Free of bias
Easy and cheap
Not suitable for large pop.
Need sampling frame
Systematic sampling (definition, pros, cons)
Required elements chosen at regular intervals from ordered list
Pick first item randomly by picking random number between 1 and k
K = pop. size/ sample size
Quick to use
Need sampling frame
Suitable for large pop.
Patterns in sample data may occur
Stratified sampling
Population divided into mutually exclusive strata (groups) and random sample taken from each
Proportion stays same
No. Sampled in strata = (no. in stratum/no. in population) x overall sample size
Accurately represents population structure
Population must be classified in strata so need to know population structure which can be hard to tell clearly wnd time consuming
Rest of cons same as random sampling
Why can different samples reach different conclusions
Natural variation in population
What to say when asked to comment on a claim
whether its mean, median, mode (median better with outliers. Can also mean half good/half not etc)
Whether data supports company claim
How to improve data sampling reliability
take larger sample
Use simple random sampling
Quota sampling
population divided into strata according to characteristics. Size set to try and reflect group proportion of whole population.
Strata filled by interviewer/researcher
No sampling frame needed
Non random so potential bias
Quick, easy and small sample still representative
Time consuming and expensive to divide into strata
Opportunity sampling
Sampling taken from people available at the time of the study
Easy to carry out
Cheap
Unlikely to be representative
Highly dependent on individual researcher so bias
Qualitative
Non-numerical
Quantitative
Numerical. Discrete(specific values) or continuous(any value)
Key terms for intervals
class intervals
Lower/upper class boundaries
Class width
Midpoint
UK stations from south of UK to north and weather conditions
Are in alphabetical order (except heathrow and hurn which are not). Ones in south warmer and more sunlight
cambourne - coastal so windy and rainier
Hurn- coastal so windy and rainier.
Heathrow- warmest
Leeming- pretty warm but more in north
Leuchars- coastal. Wettest, coldest, windiest, furthest north.
When did the great storm happen
October 15-16, 1987 . High wind speeds. Mostly SE affected
When is large data set recorded for
May to october in 1987 and in 2015.
Only 6 months so bit of a disadvantage.
International stations and weather conditions
Perth, Australia - when summer here, winter there. Very hot in summer. 0 to very high rainfall
Beijing, China- very hot and rainy in summer, very cold in winter. Inland
Jacksonville, Florida, USA - very hot and humid, prone to hurricanes. Hurricane in oct ‘87 and oct 2015.
Special fact about 2015 may
Windiest month
Special fact about may 1987
Lots of missing data
Rainfall ‘tr’ meaning
Trace. Treat as 0 in calculation
N/A meaning
Reading not available so cant use in sample
Cloud cover special fact
Measured in oktas. Quantitative
Discrete Values 0-8
Max. Gust special fact
Measure in knots
1kn =1.15mph
Integers only
Cardinal wind directions
Directions on a compass
Daily mean temp units
Degrees celcius
Daily total rainfall units
mm
Daily mean pressure units
hPa. 1hPa= 100Pa
Integers only
Windspeed units
Beaufort scale- fresh, light, moderate, strong.
Qualitative.
Wind/gust direction
Bearings.
Multiples of 10 only
Daily total sunshine units
Hours.
Relative humidity units
%.
Integers only
Daily mean visibility units
Dm. 1Dm=10m.
Round to nearest 100
As you move further north from may to october, what happens to maximum hours of sunshine
Increases
Also consider size of sample and geographical factors affecting things, not just numerical values!!!
Humidity for fog
>95%
Outliers meaning
Unusual data
Anomallies meaning
Errors
Mean (x bar)
sum of x/n or sum of fx/sum of f
For listed data, Upper quartile
3n/4
For listed data , Lower quartile
n/4
For listed data, Median
n/2
For listed data, what if values for upper quartile/median/lower quartile are decimals
Round up
For listed data, what if values for upper quartile/median/lower quartile are whole numbers
Find midpoint with next one
Quartiles for grouped data
lower: n/4
Upper: 3n/4
Median: n/2
DO NOT ROUND, USE LINEAR INTERPOLATION
Percentiles
E.g. 57th percentile, P57= 0.57 x n
Deciles
10% chunks
E.g. D3 =0.3 x n
True class limit for ‘10-12’
9.5 <= x < 12.5
Interquartile range (is a measure of spread)
Upper - lower quartile
Ignores extremes
Interpercentile range
E.g. 10th to 90th IPR = P90 - P10
Variance (sigma squared)
MSMSM (mean of the squares minus the square of the means)
(Sum of x²/n) - mean² = Sxx/n
Grouped frequency used midpoint of class width to find f(x)
Standard deviation (sigma)
Sqrt (variance)
For some questions, can make assumptions that data is equally distributed through range
Variance definition
Measure of spread that takes all values into account. Average squared distance from mean.
Standard deviation definition
Measure of spread of data. How many values on each side of mean/median
Coding - if y=ax+b
Data values coded to make new set of values easier to work with
Mean of y = a x (mean of x) + b
Standard deviation of y = a x (standard deviation of x)
Cumulative frequency graphs and box plots
Use highest number in range for class
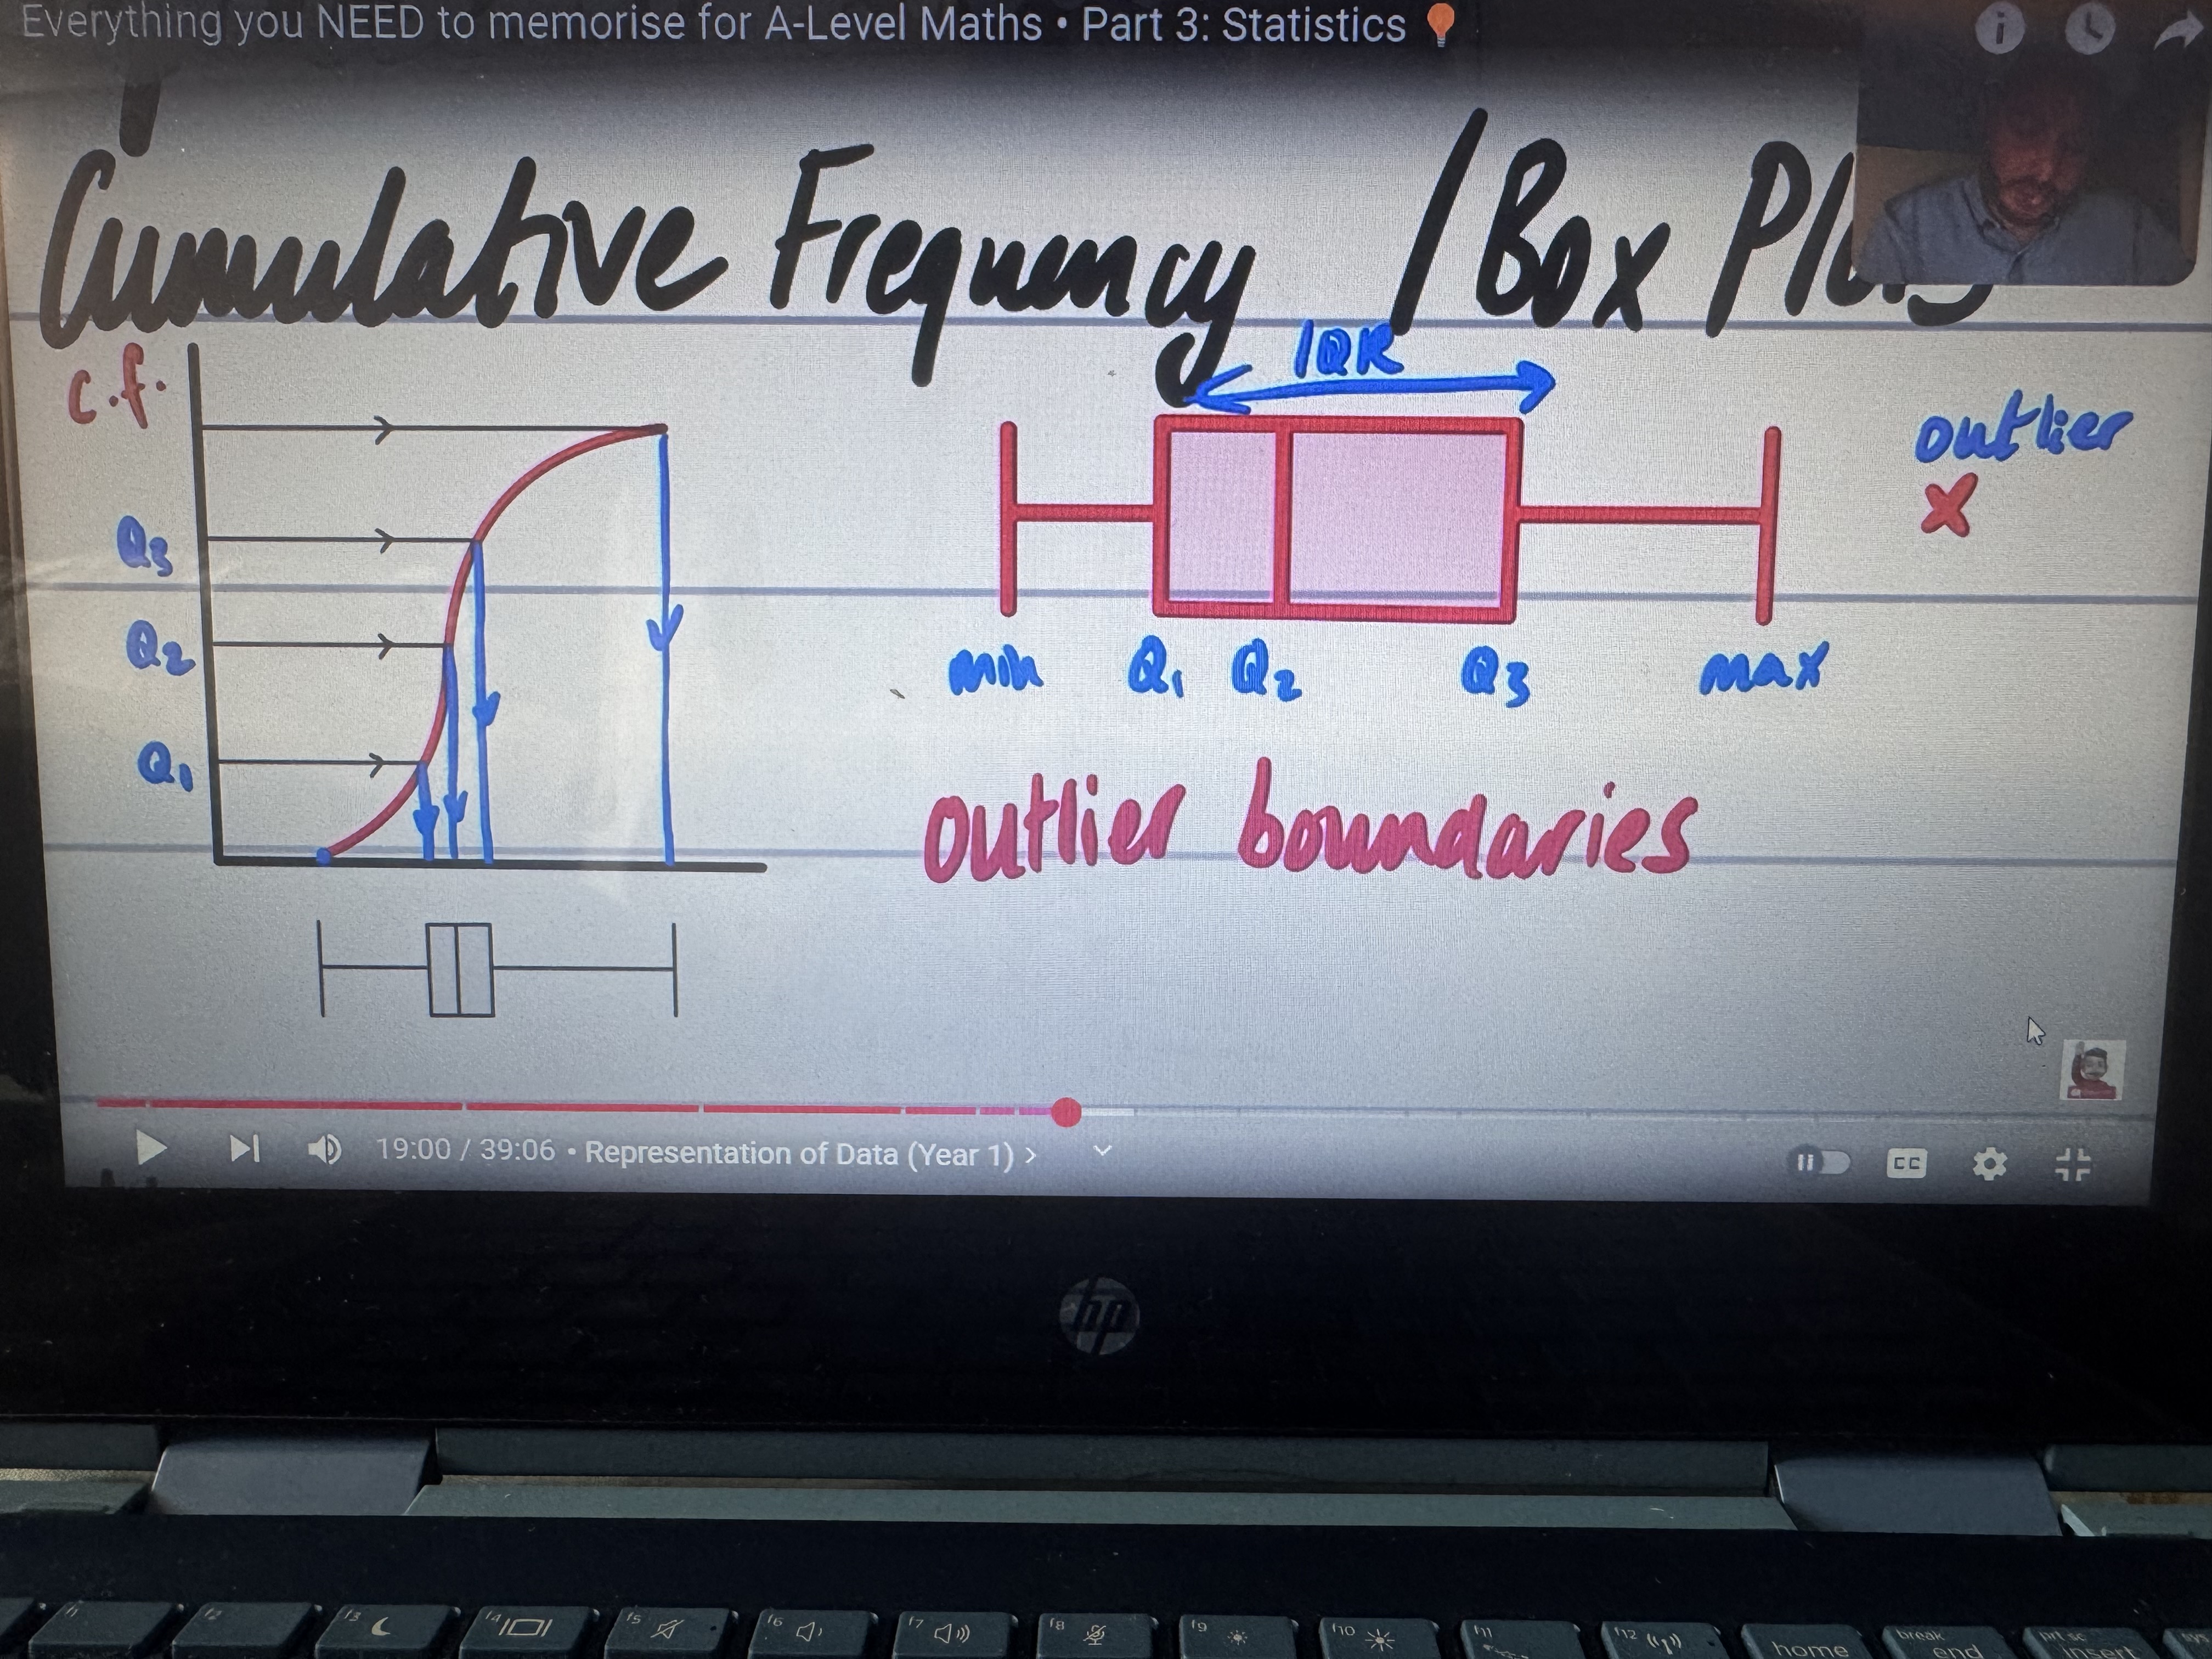
Standard way for finding outlier boundaries
Must be less than this: (LowerQ) - 1.5 x IQR or
Must be greater than this: (UpperQ) + 1.5 x IQR
What is meant by cleaning the data
Removing anomalies from data
Histograms
Joining middle of top of each bar forms frequency polygon
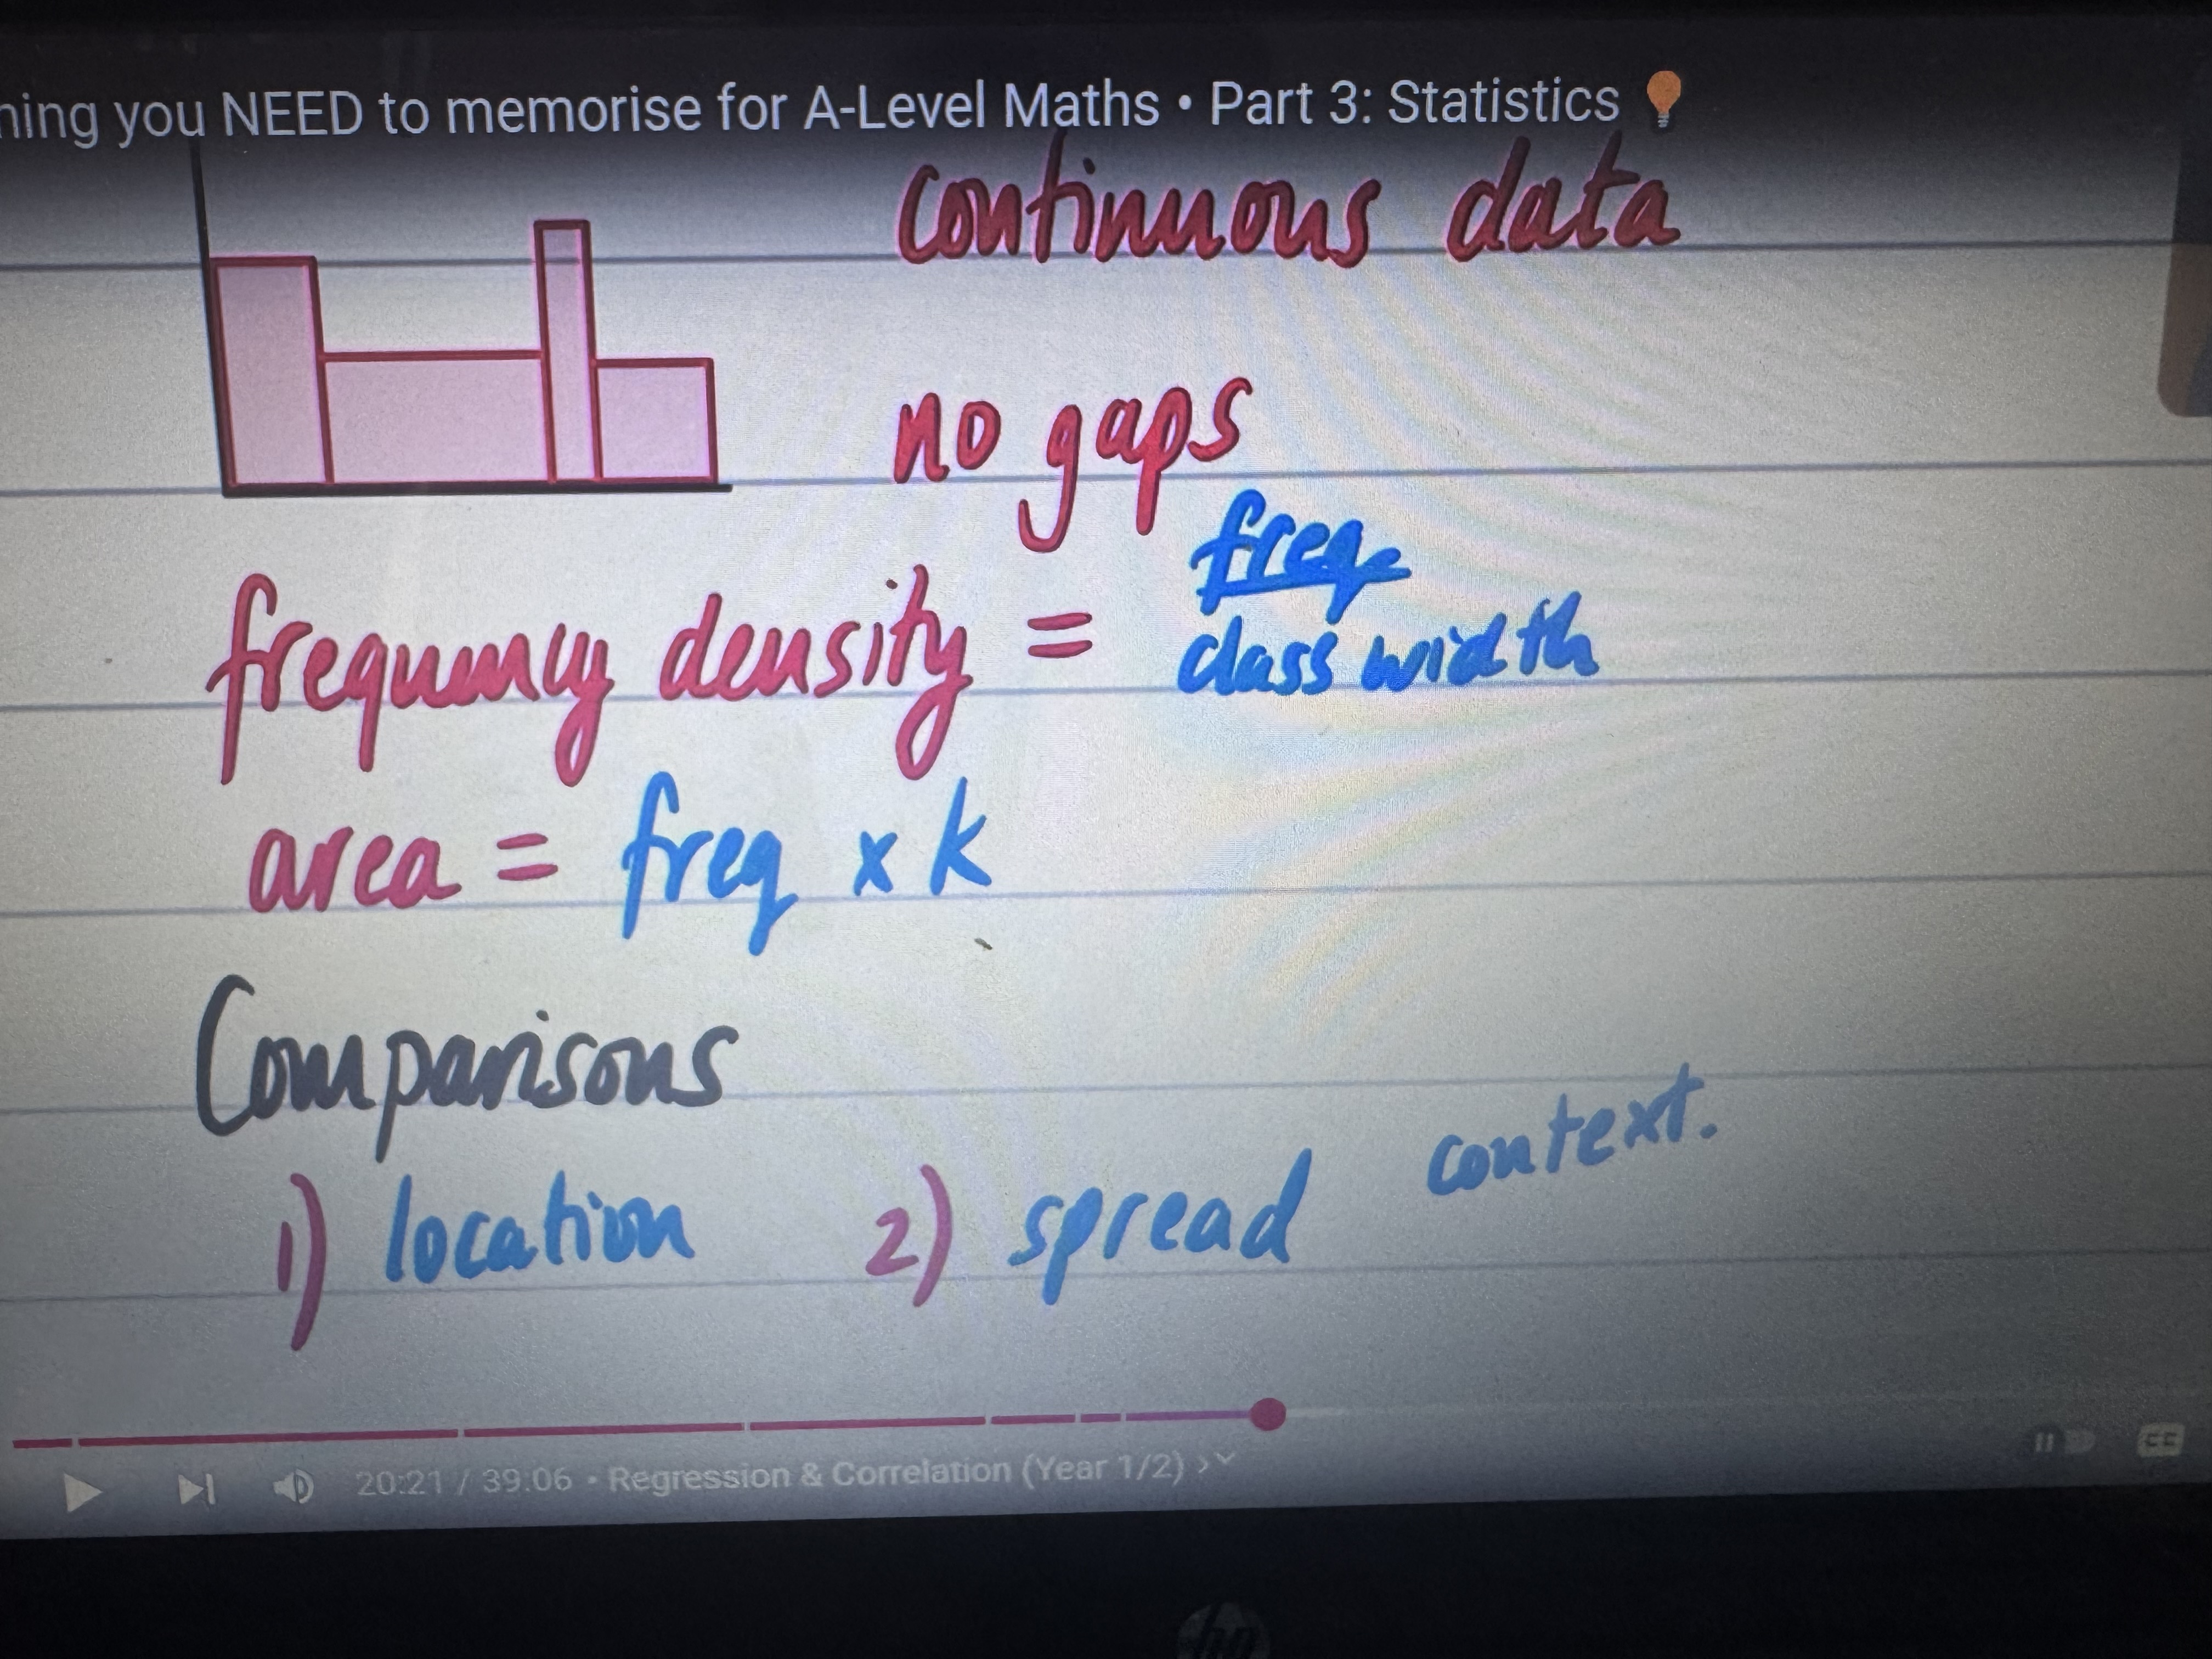
When comparing data sets on histograms/ box plots, comment on:
mean and standard deviation OR
median and interquartile rangE
If data set contains extreme values, median and IQR more appropriate
Correlation
Describes measure of linear relationship between 2 variables. Between -1 and 1
strong negative
Weak negative
No/zero
Weak positive
Strong positive
Bivariate data
Data which has pairs of values for 2 variables. On scatter diagrams. E.g. pulse beats per minute
What variable goes on x-axis
Independent variable
Causal relationship
If one variable causes change in another. *just because 2 variables show correlation doesnt mean they have causal relationship. Must use context and common sense to deduce.
When can outliers be included in data for correlation, and when excluded
Included as they may unlikely be an anomally.
Exclude as they may not be representative.
Regression line
Line of best fit. y = mx + c.
c is y when x=0
m is rate of change of y with x. How much y increase/decreases with increase/decrease in x
Least squares regression line
Straight line that minimises sum of squares of distances of each data point from line
To improve regression line or any models…
Always increase sample size and choose randomly
Can you use regression line equation to find values of x when given y
No because x is independent variable
Interpolation
Estimating inside data range. Reliable.
Extrapolation
Estimating outside data range. Unreliable as we dont know graph continues to be linear.
What to do for non linear equations to draw linear graphs
Take logs
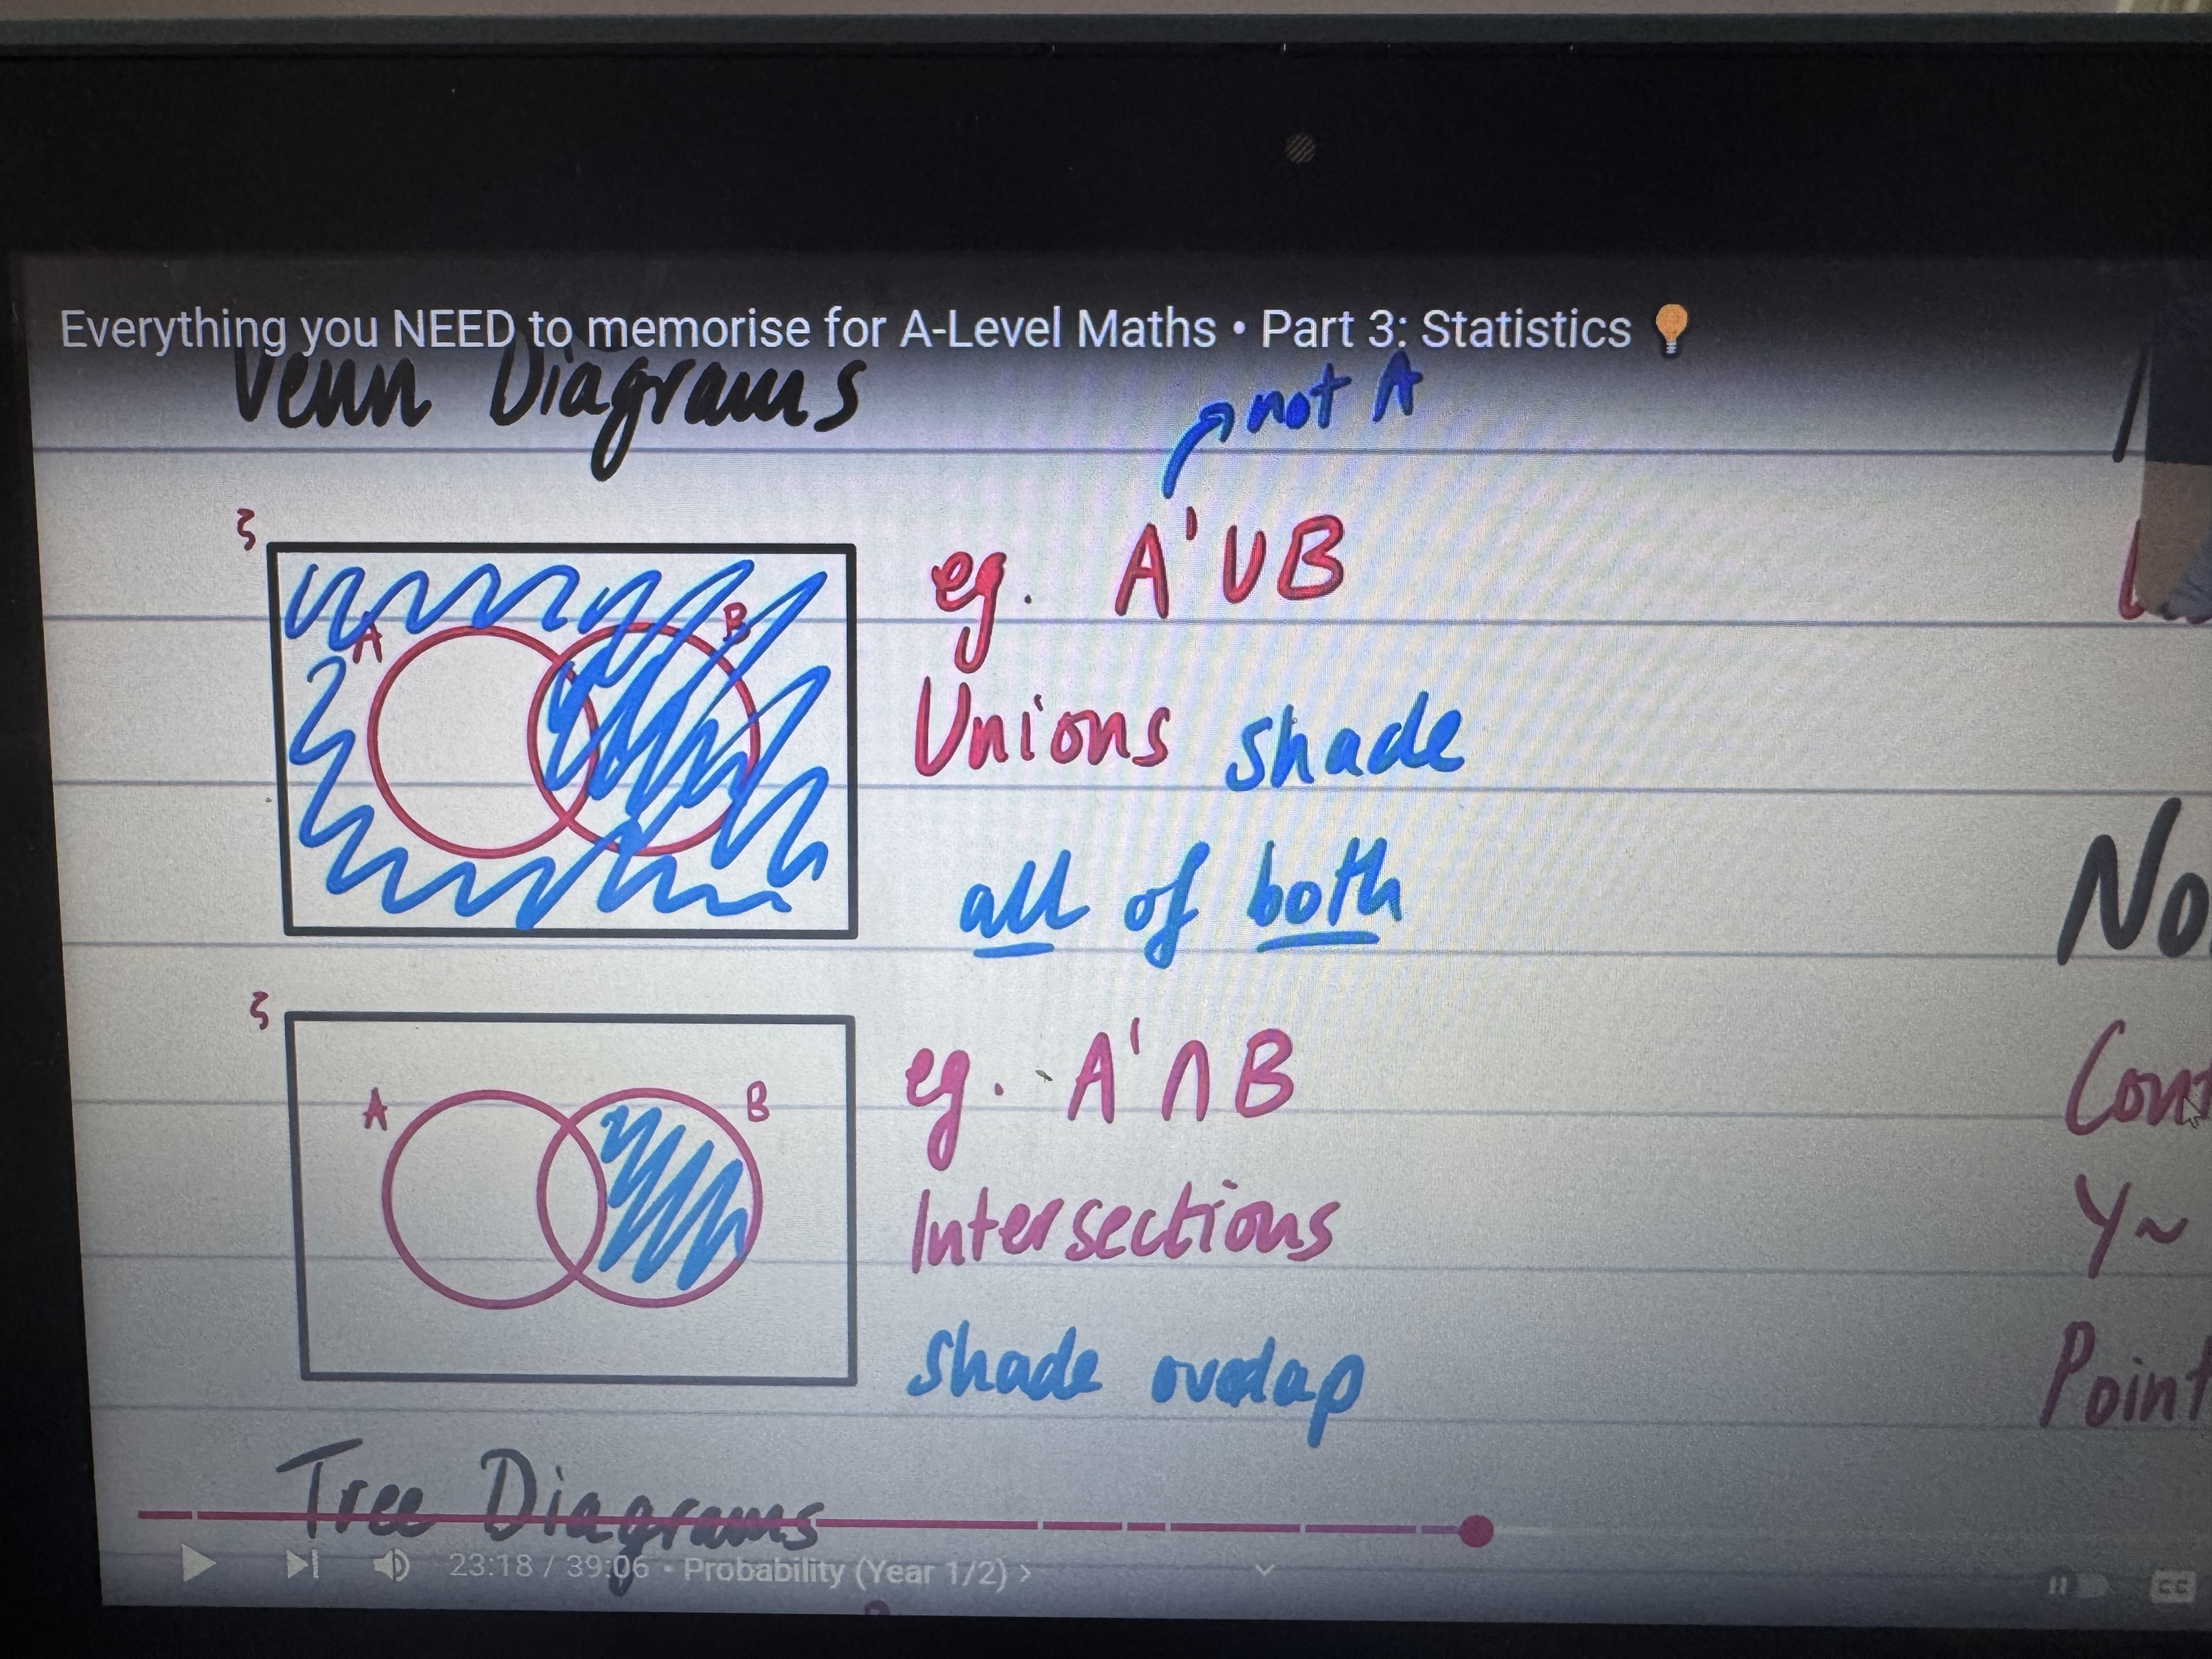
Venn diagrams
Represents events graphically
Rectangle represents sample space
Experiment
Repeatable process that gives rise to a number of outcomes
Event
Collection of 1 or more outcomes
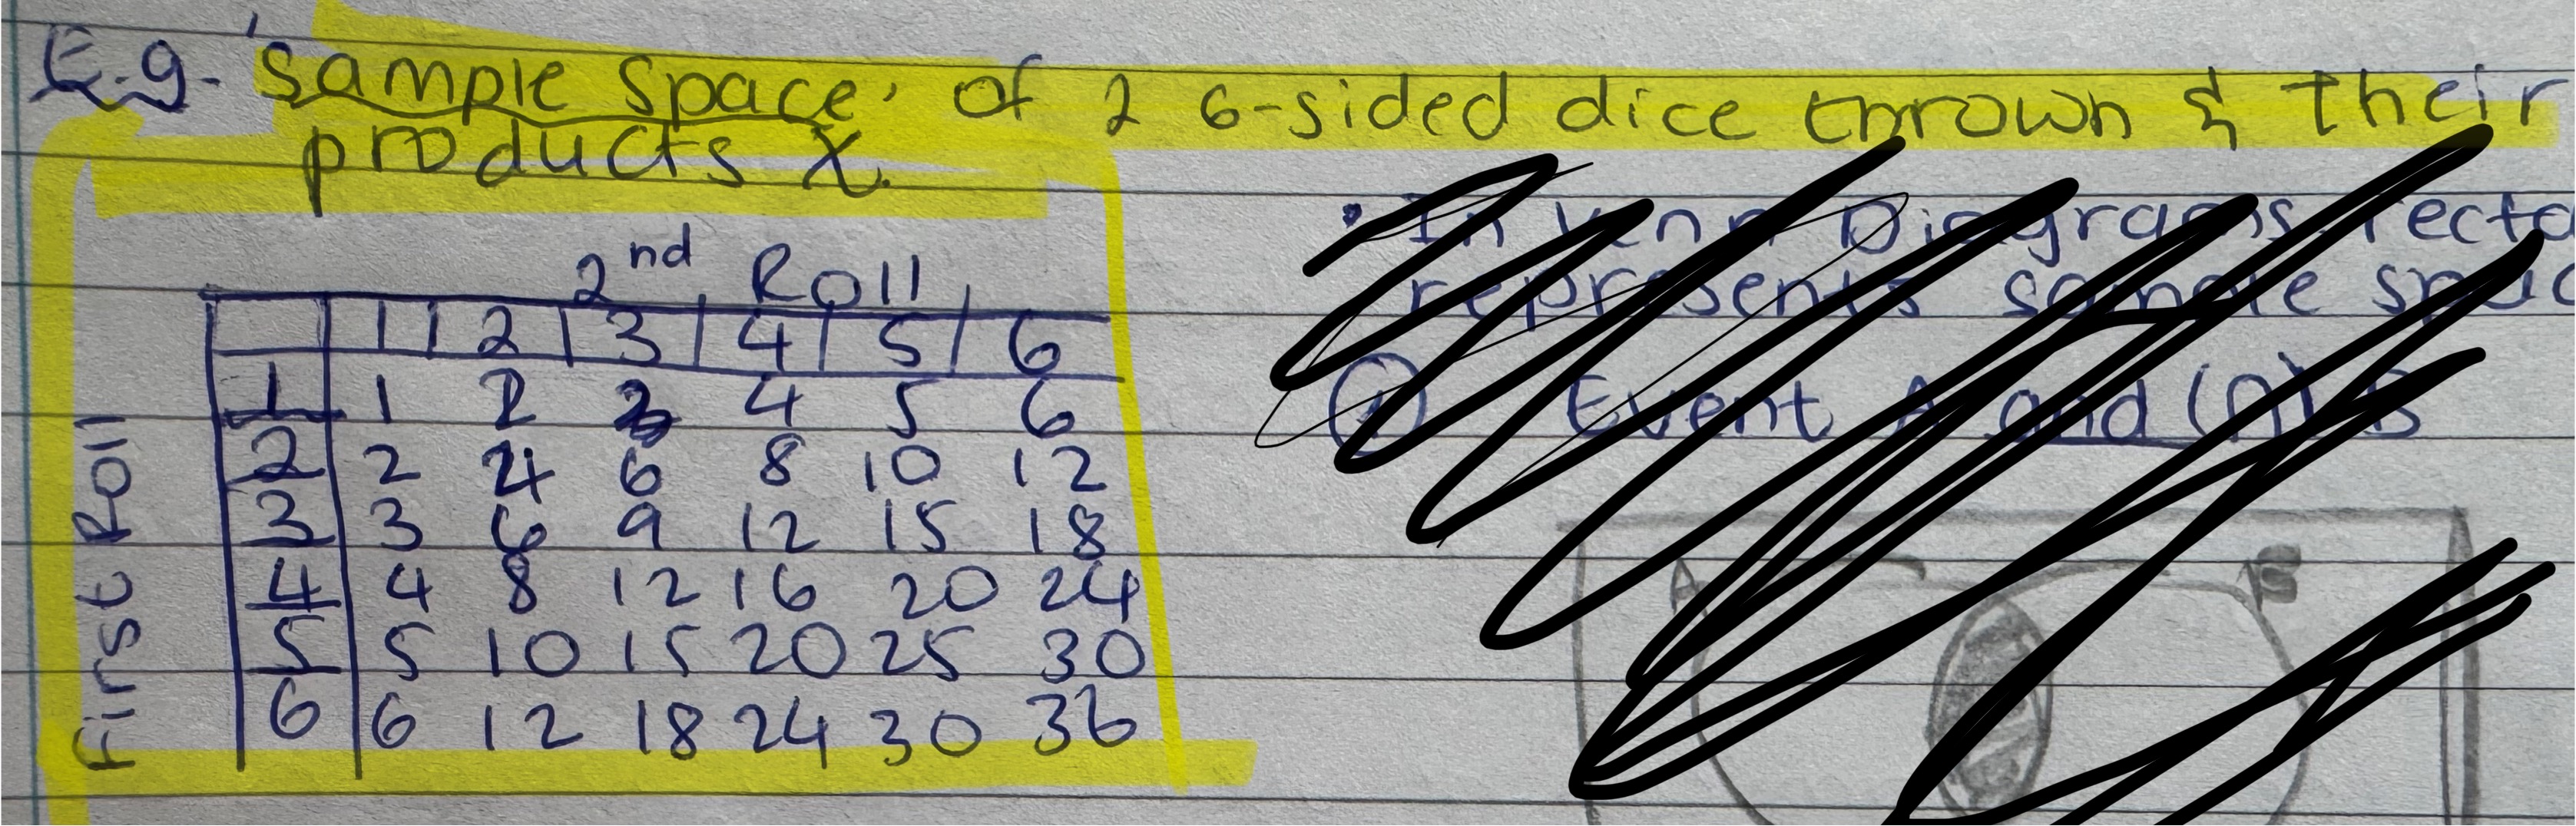
Sample space
Set of all possible outcomes. Could use table, tree diagram, or venn diagram
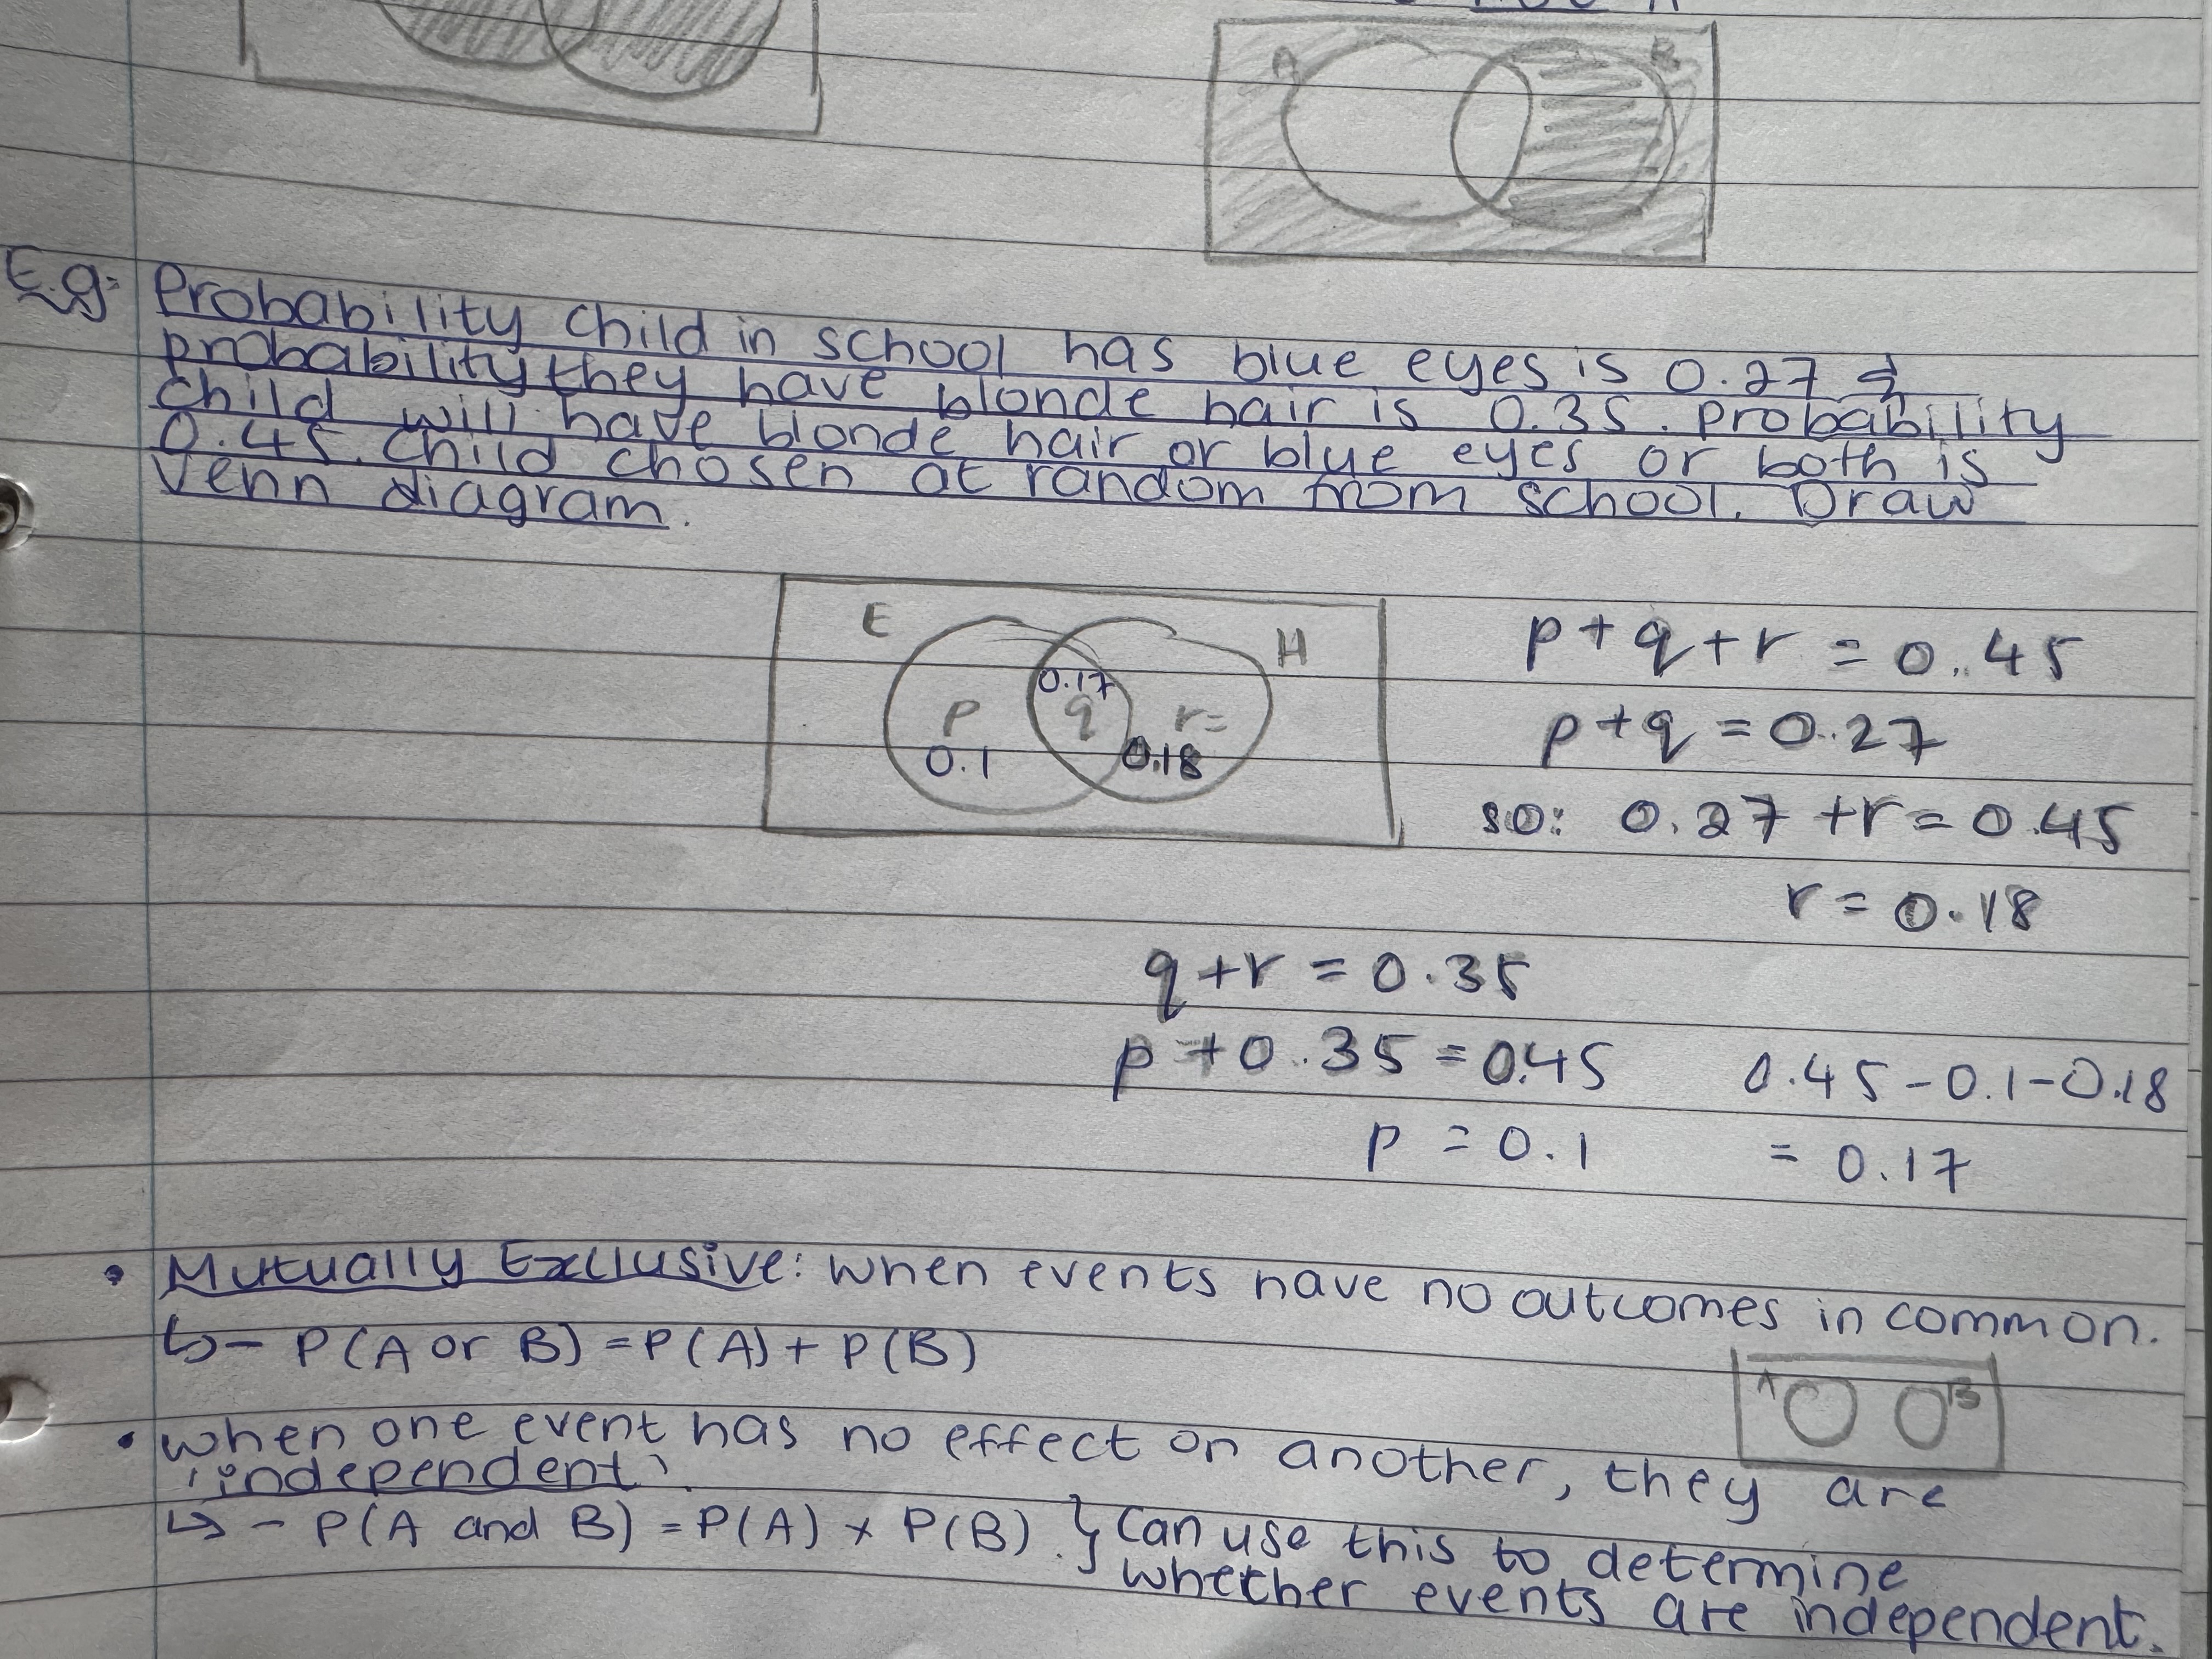
Mutually exclusive events
When events have no outcomes in common. Venn diagrams do not overlap.
P(A or B) = P(A) + P(B)
P (A and B) = 0
Independent events
When one event has no effect on another. Can’t tell from venn diagram so must do some calculations to determine if independent
P(A and B) = P(A) x P(B)
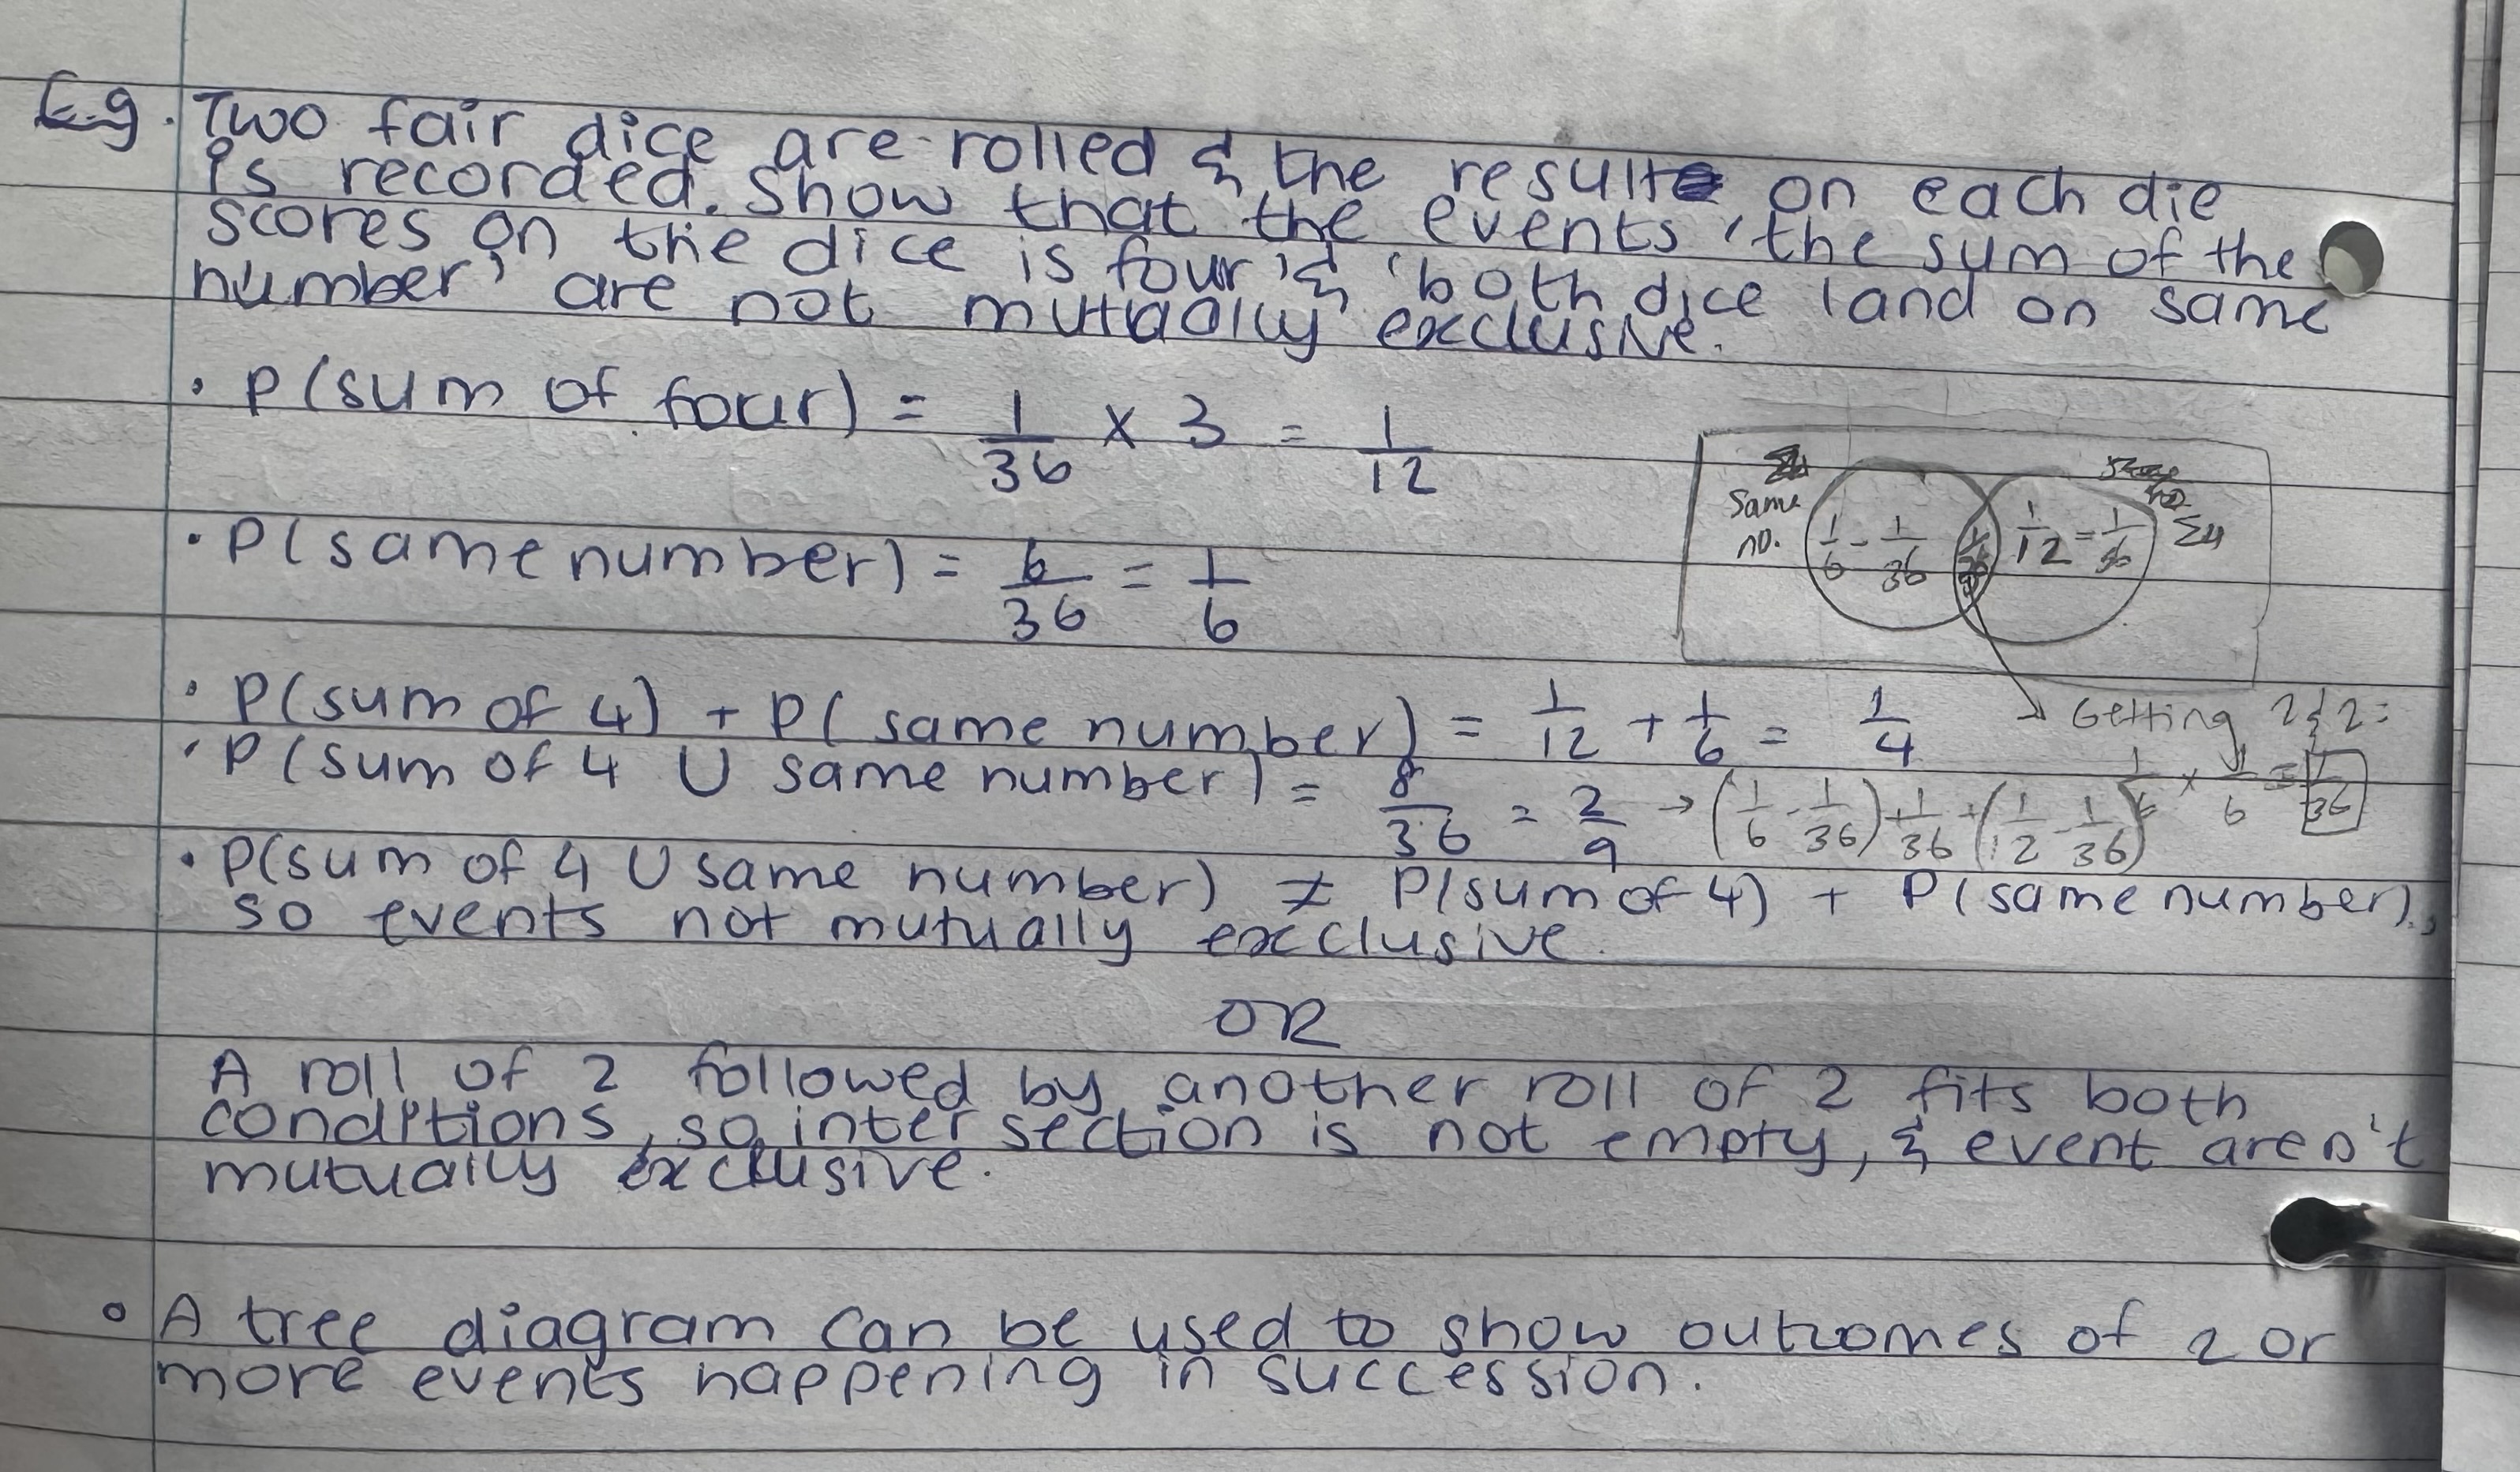
Probability addition law
P(A U B) = P(A) + P(B) - P(A and B).
*When events are mutually exclusive, P(A and B) must be 0 and if not 0, events are not mutually exclusive
Discrete uniform distribution
Probabilities of all outcomes are equal
Sum of probabilities of all outcomes of an event
1
Are the number of days in a given week discrete
No. Days in a week is always 7 and is pre-determined so not random.
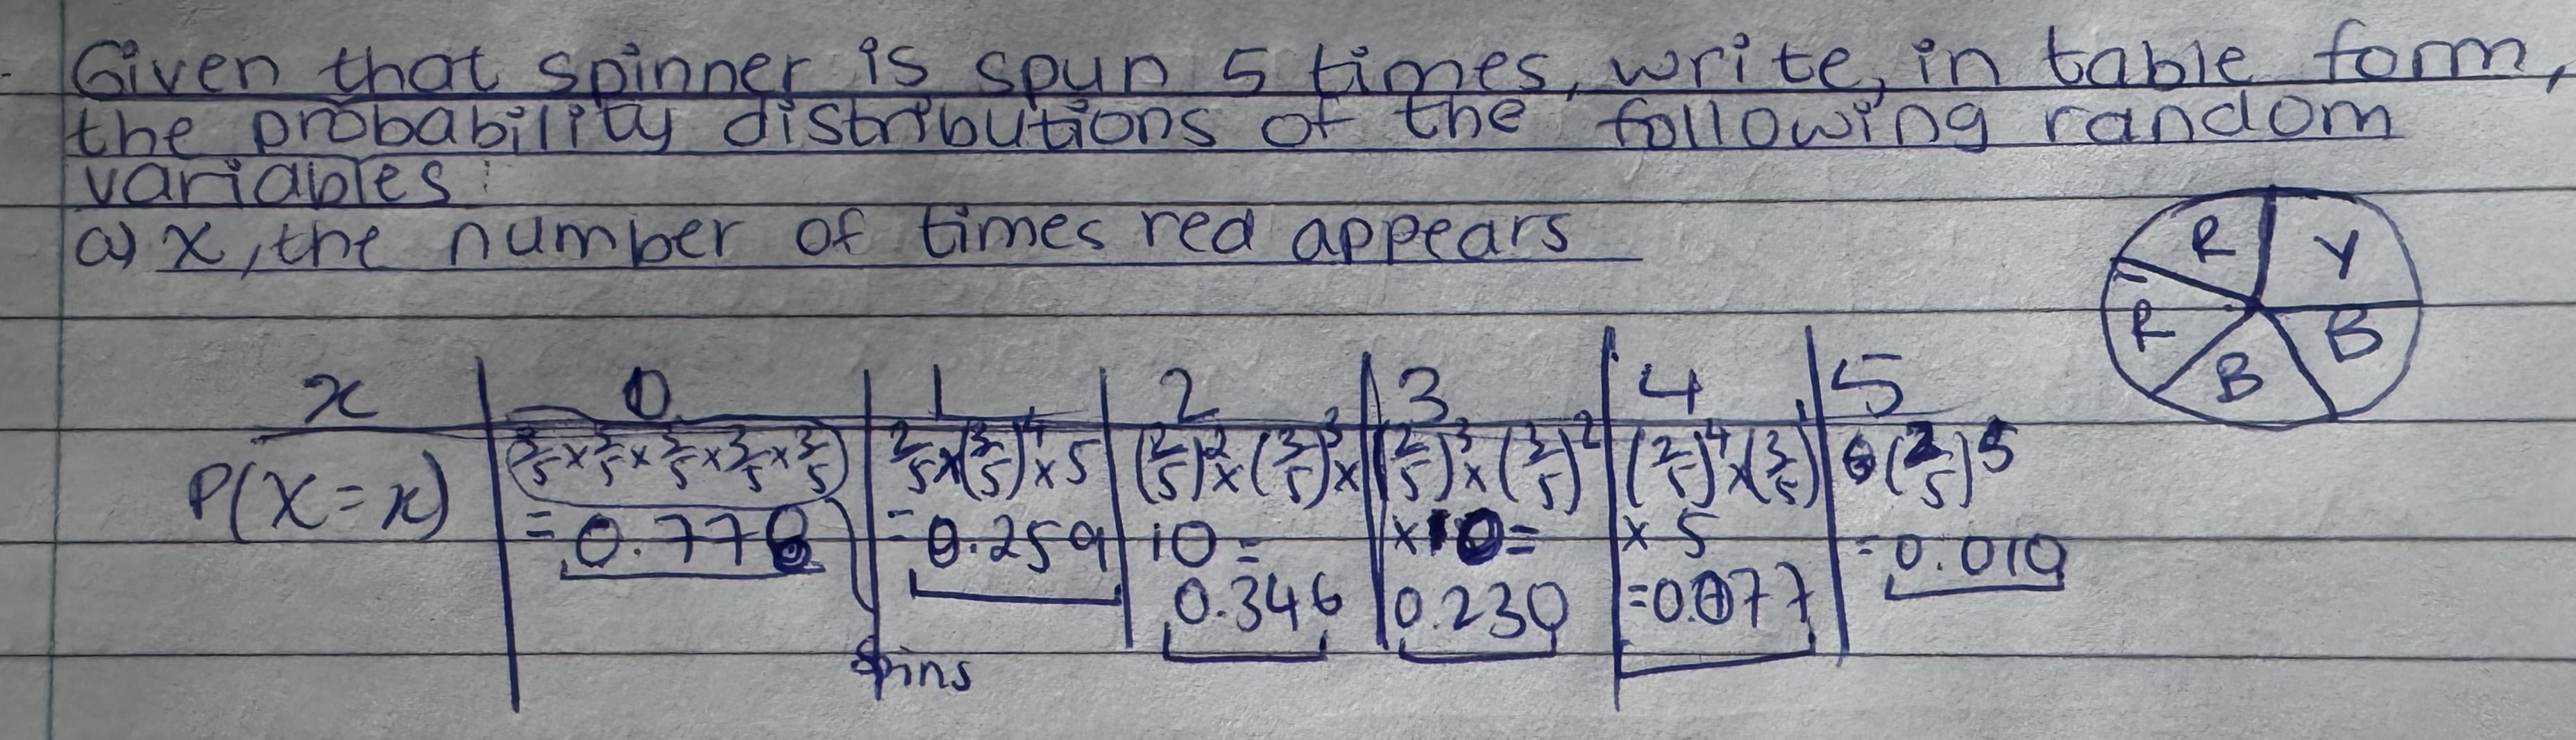
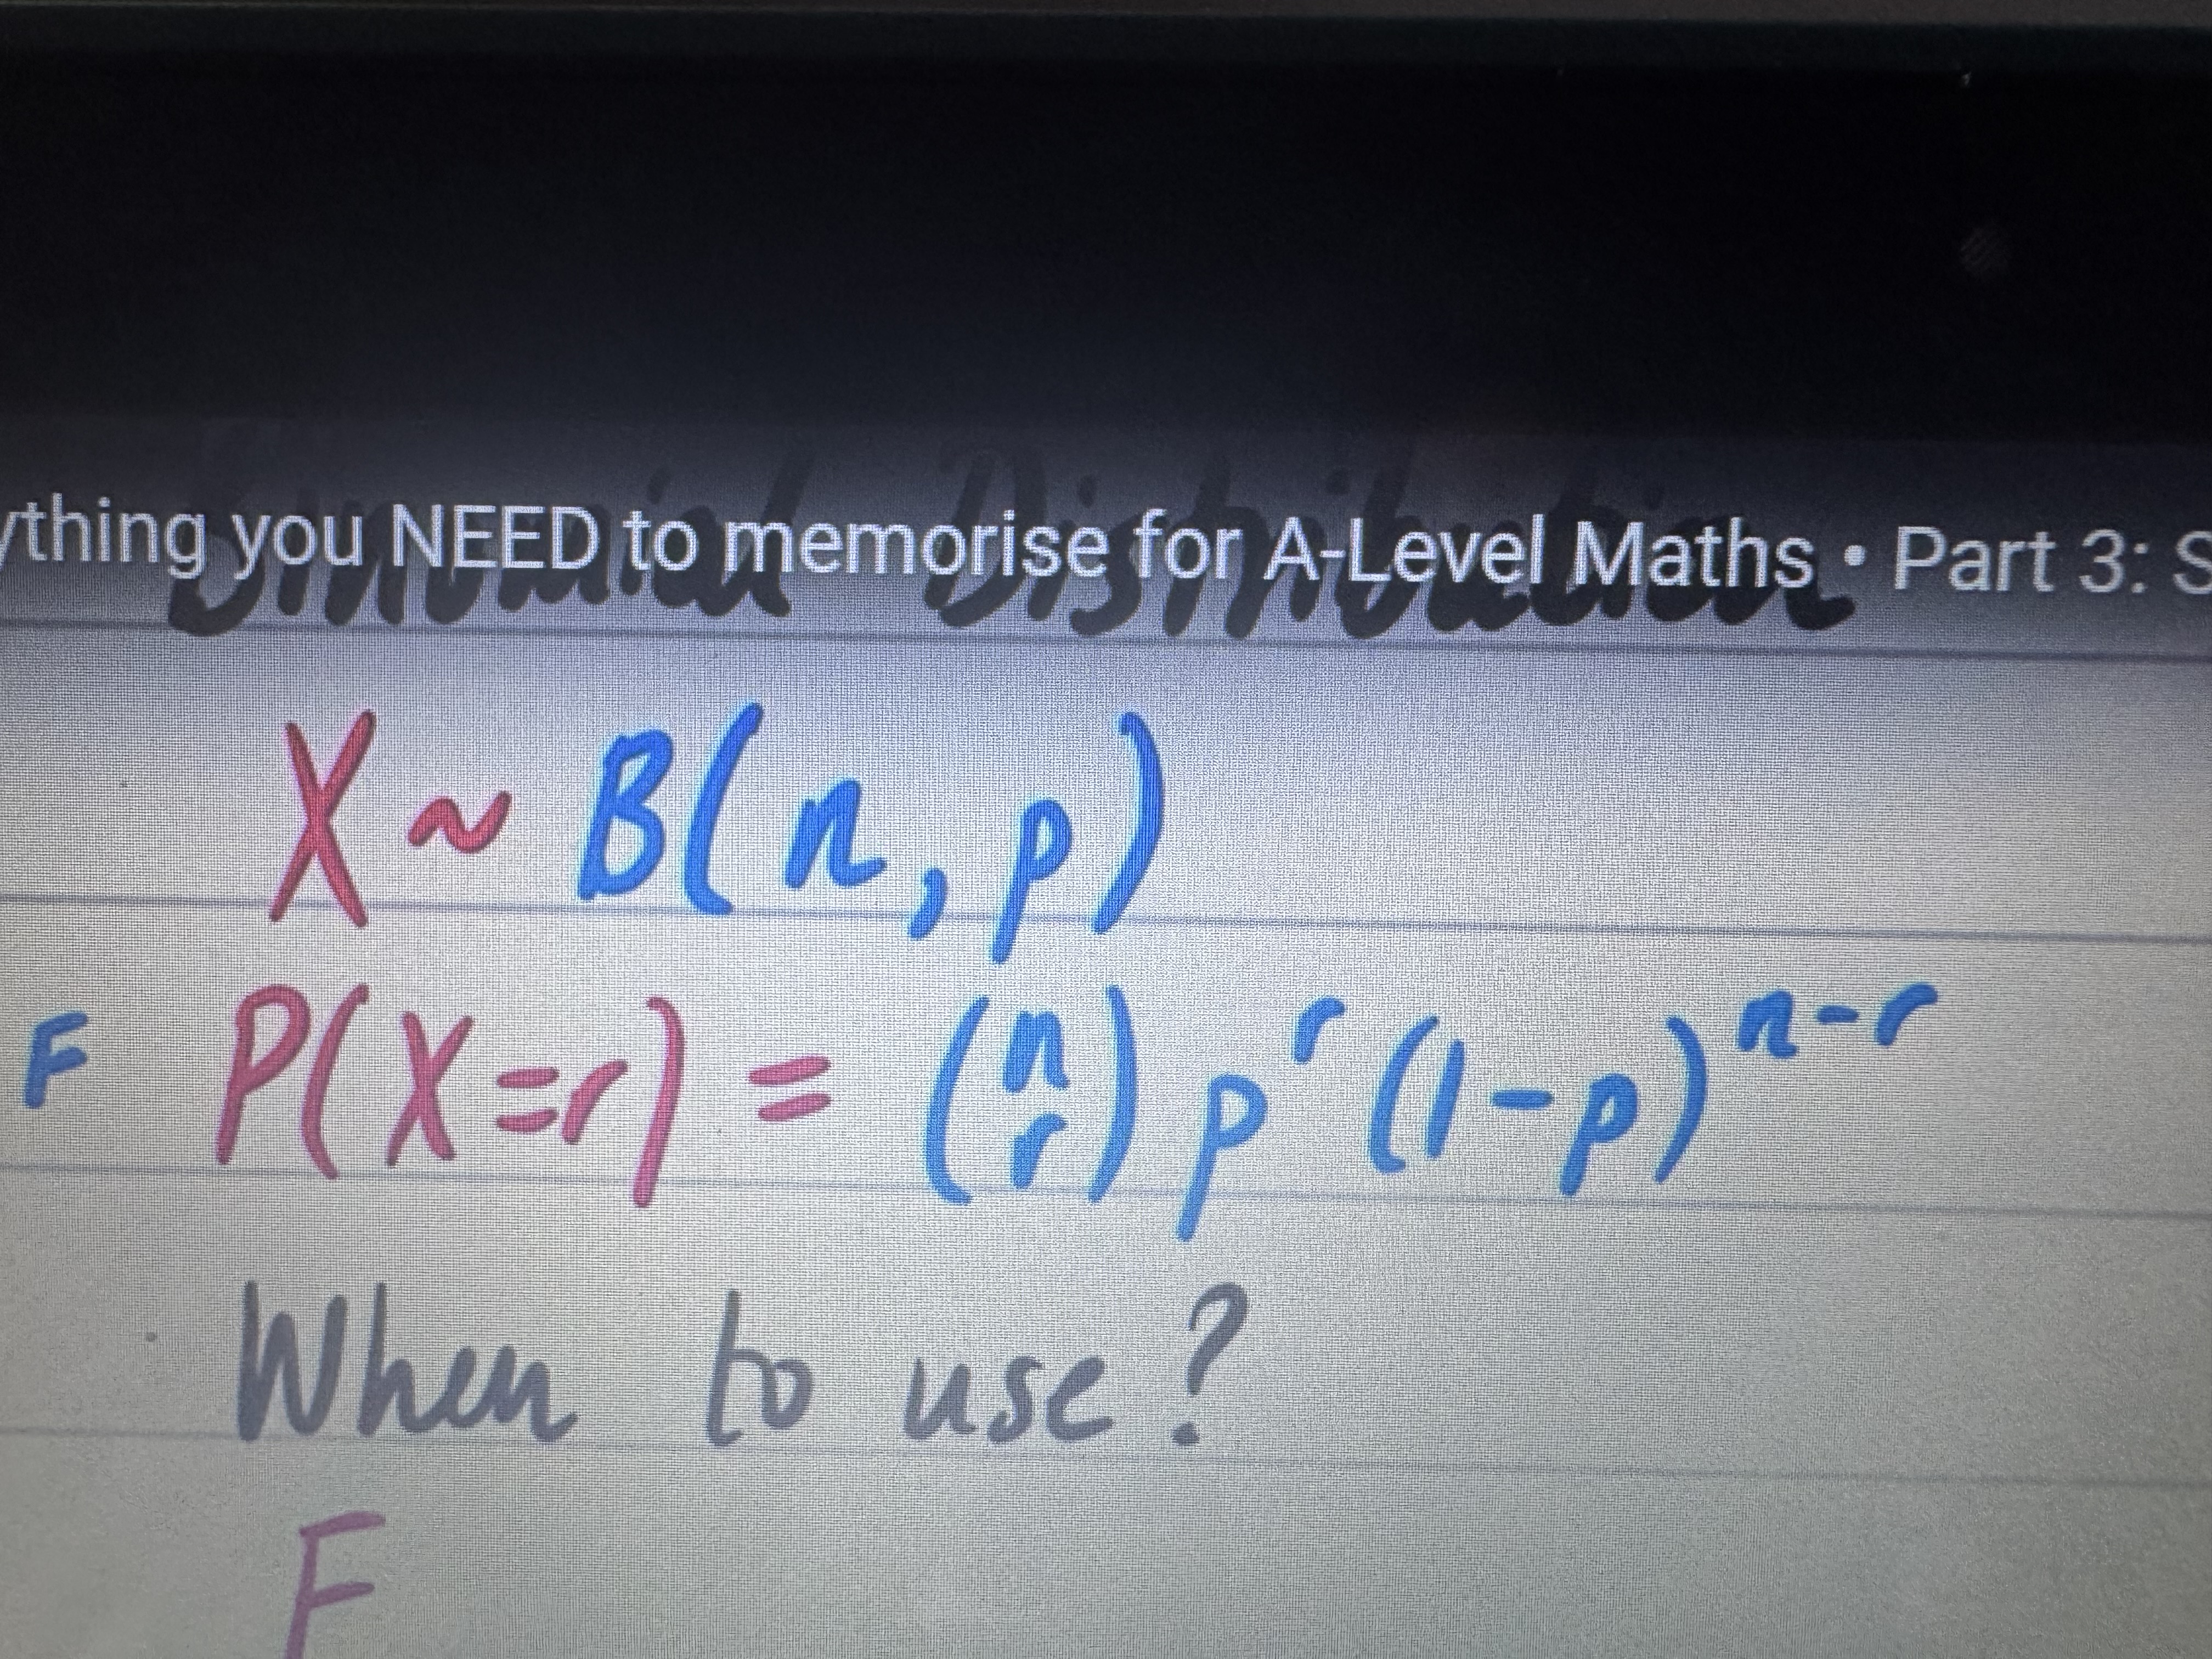
When can you model X with binomial distribution X~B(n,p)
FFIT
Fixed number of trials
Fixed probability of success
Independent trials
Two outcomes only
Binomial X~B(n,p) equation for P(X=r)
(nCr)(p^r)(1-p)^(n-r)
Hypothesis
A statement about a population parameter.
Test statistic
Result of the experiment or the statistic calculated. E.g. no. of people saying they support a candidate
Null hypothesis
Ho- what you assume to be true
Alternative hypothesis
What would be true if Ho is wrong
Significance level
The given threshold of likeliness
One tailed test
When H1: p>k or p<k
2 tailed test
When H1: p doesnt not equal k. Halve significance level value for each end
When to reject Ho
If p<sig. level (in critical region so sufficient evidence to reject Ho)
If p>sig. level, not in critical region so insufficient evidence to reject Ho
Critical region
If test statistic falls within this region, would cause you to reject null
Critical value
First value to fall inside critical region