INTRODUCTION to FOURIER TRANSFORM INFRARED(FTIR) SPECTROSCOPY and INTERPRETATION of IR SPECTRA
1/83
There's no tags or description
Looks like no tags are added yet.
Name | Mastery | Learn | Test | Matching | Spaced |
|---|
No study sessions yet.
84 Terms
ATR
Attenuated total reflectance
Each peak represents
a particular bond in a compound
Each bond
has a characteristic amount of energy different from other bonds
peak
Commonly uses the wavenumber (cm-1 ) unit which increases from left to right
The stronger the peak,
the more the peak dips to the bottom
wavenumber
reciprocal of wavelength
CHARACTERISTICS OF IR SPECTRUM
• The absorption peaks go
down the spectrum
CHARACTERISTICS OF IR SPECTRUM
y-axis
measures the percent transmittance
finger print region
not considered
CHARACTERISTICS OF IR SPECTRUM
The y-axis measures the percent transmittance: 100% T
means that all the IR light that pass through the sample is transmitted, and none is absorbed.
CHARACTERISTICS OF IR SPECTRUM
The y-axis measures the percent transmittance: 0% T
means that none of the IR light pass through the sample and is transmitted, and all is absorbed resulting to the presence of peaks
2 regions of IR spectrum
functional grp
fingerprint region
functional grp region/ diagnostic region
occurs at ≥ 1500 cm-1
common functional grp gives distinct peaks in this region at a characteristic frequency
fingerprint region
occurs at <1500 cm-1
the region often contains complex set of peaks and is unique for every cmpd
IR Absorptions
Stronger bonds
vibrate at higher frequency thus they are absorbed at higher wavenumber
bonds absorb in
four predictable region in an IR spectrum
R1 range
4000-3000
R2 range
3000-2000
R3 range
2000-1500
R1
bonds to hydrogen
lighter atoms higher freq
R1 cmpds/ bond
C-H
O-H
N-H
R2
TRIPLE BONDS
stronger bonds higher freq
R2 cmpds/ bonds
alkynes
nitrile
R3
double bonds
R3 cmpds/bonds
c=c
c=o
c=n
REGION 1
• ROH • RCOOH • RNH2 • Saturation
REGION 2
• Alkynes • Nitriles
REGION 3
Alkenes/ arenes
RCHO
RCOR
RCOOH all and derivatives
O-H
3600-3200
strong, broad
N-H
3500-3200
medium
C-H
~3000
sp3
3000-2850
strong
sp2
3150-3000
medium
sp
3300
medium
alkynes
2250
medium
nitrile
2250
medium
c=o
1850-1650 (often ~1700)
strong
c=c
1650
medium
benzene
1600-1500
medium
ir bands can be classified depending on
relative intensities in infrared spectrum
strong band
covers most of the y axis
medium band
falls to abt half of the y axis
weak band
falls to about one third or less of the y axis
narrow bands
thin and pointed like a dagger
broad bands
wide and smoother
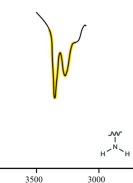
amine
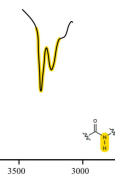
amide
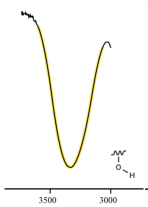
alcohol
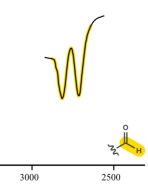
aldehyde
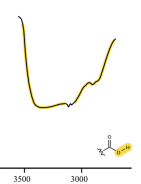
carboxylic acid (o-H)
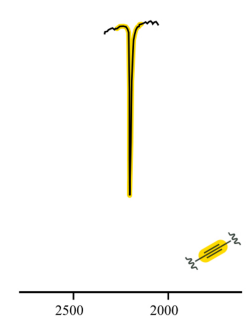
alkyne
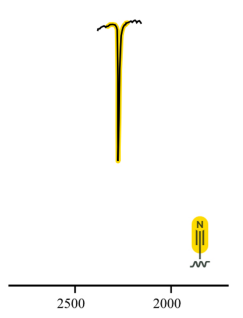
nitrile
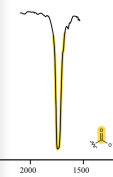
ester
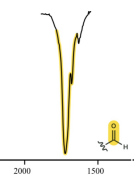
aldehyde
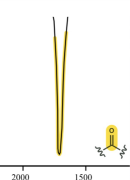
ketone
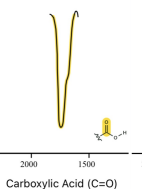
carboxylic acid (c=o)
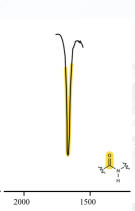
amide (c=o)
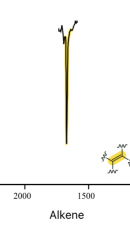
alkene
FTIR in Determining the outcome of a chemical reaction
Oxidation of hydroxyl group in Compound C to form the carbonyl group in periplanone B is accompanied by the disappearance of the OH group and appearance of carbonyl group