AP Statistics Unit 1
1/15
Earn XP
Description and Tags
Name | Mastery | Learn | Test | Matching | Spaced | Call with Kai |
|---|
No analytics yet
Send a link to your students to track their progress
16 Terms
Individuals
Individuals are the smallest units represented by data.
Variable
A variable is any characteristic of an individual.
The two types of variables
Categorical variables
Quantitative variables
Categorical variables
Categorical variables place an individual into one of several groups
Quantitative variables
Quantitative variables have numerical values for which averages are meaningful
Advice: a numeric variable is not necessarily quantitative. Consider student ID numbers.
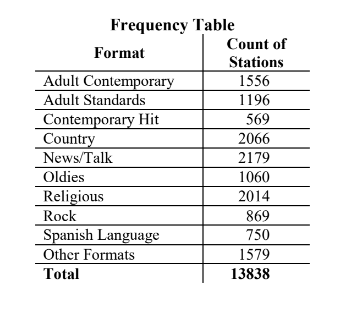
Frequency table
A frequency table shows the counts or frequencies of variables.
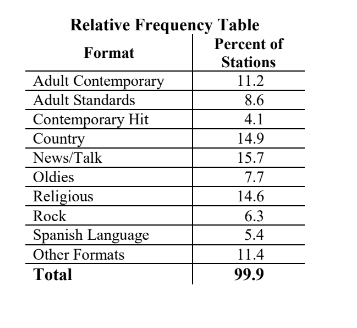
Relative frequency table
A relative frequency table displays the percentages (relative frequencies) of a variable.
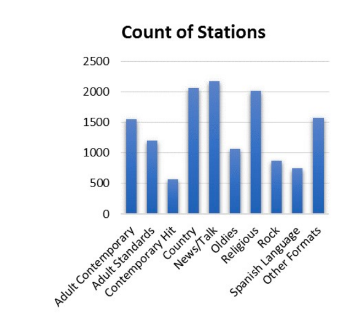
Bar Graphs
are used for categorical data
have spaces between the bars
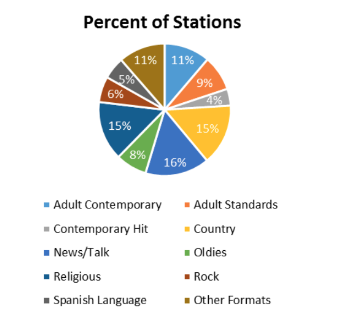
Pie charts
are used for categorical data
represent portions of the whole
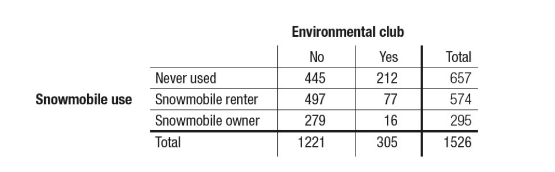
Two-way table
A two-way table summarizes the data on the relationship between two categorical variables.
Conditional distribution
Conditional distribution considers the distribution of a subset of the group
Marginal distribution
Marginal distribution considers the distribution of the whole group
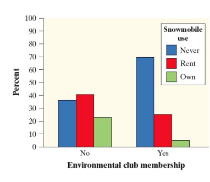
Side by side bar graph
The different categories are displayed beside each other, with gaps between each value on the x-axis.
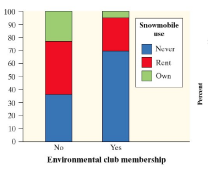
Segmented bar graph
A segmented bar graph shows different categories in each bar with the height of each category corresponding to its y-value
The segmented bar graph can be obtained by stacking the bars in the side-by-side bar graph
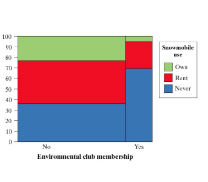
Mosaic plot
The bar widths in the mosaic plot are proportional to the number of respondents
Association
There is an association between two variables if knowing the value of one variable helps us predict the value of the other.