1.5 The multiplier and the accelerator
 Call Kai
 Learn
Learn Practice Test
 Spaced Repetition
 Match
Match Flashcards
 Knowt Play
1/22

There's no tags or description
Looks like no tags are added yet.
Name | Mastery | Learn | Test | Matching | Spaced | Call with Kai | Chat |
|---|
No analytics yet
Send a link to your students to track their progress
23 Terms
Multiplier
Process by which any change in a component of AD results in a greater final change in GDP
Accelerator
The theory of investment by which the level of investment depends on the change of national income
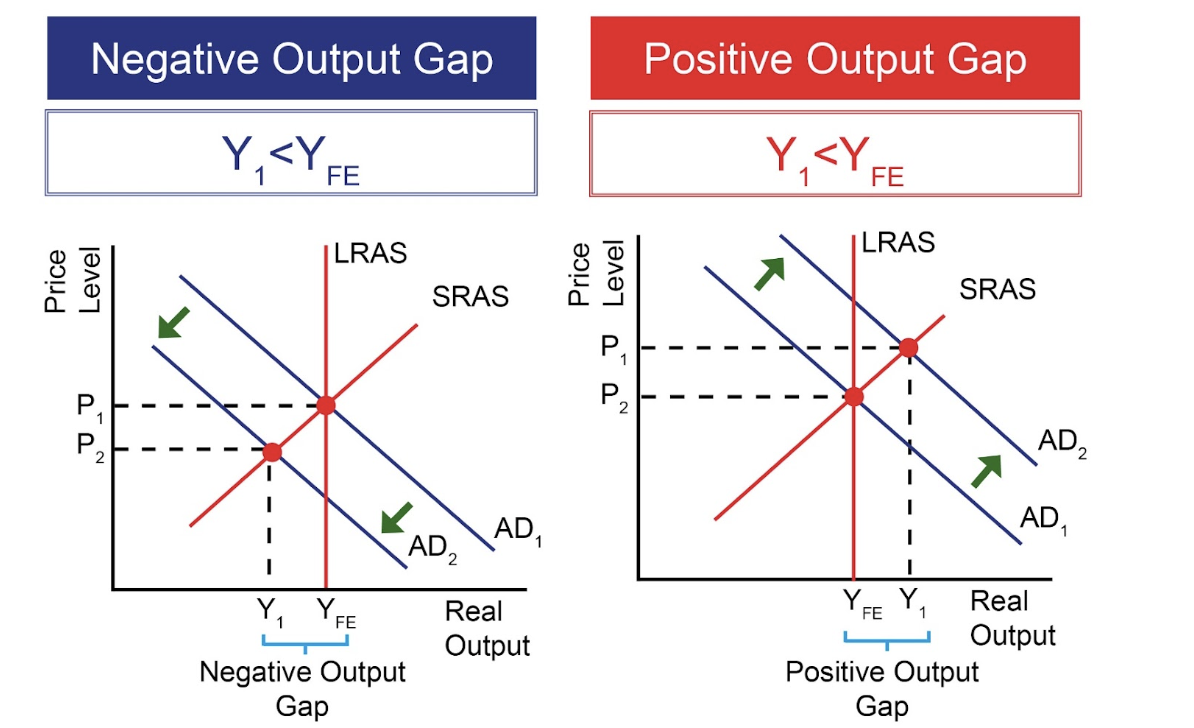
Output gaps
The difference between actual GDP and full employment level
If actual below full employment level= negative output gap
If actual above full employment level= positive output gap
Production possibility curve (PPC)
The maximum possible output an economy can achieve when fully utilising its resources
Average propensity to consume (APC)
The proportion of income households devote to consumer expenditure
Marginal propensity to consume (MPC)
The proportion of additional income devoted to consumer expenditure i.e. Marginal propensity to consume (MPC) measures how much more individuals will spend on consumption for every additional unit of income.
Marginal propensity to withdraw (MPW)
The proportion of additional income that goes as leakages, made up of savings, tax and imports
Marginal propensity to save (MPS)
The proportion of additional income that is saved
Marginal propensity to tax (MPT)
The proportion of additional income that is taxed
Marginal propensity to import (MPM)
The proportion of additional income that is spent on imports
How does the multiplier effect come about?
Injections of new demand for goods and services into the circular flow of income stimulate further rounds of spending because “one person’s spending is another’s income”
This leads to a bigger final effect on the level of national output and also total employment in the labour market
Calculating the multiplier
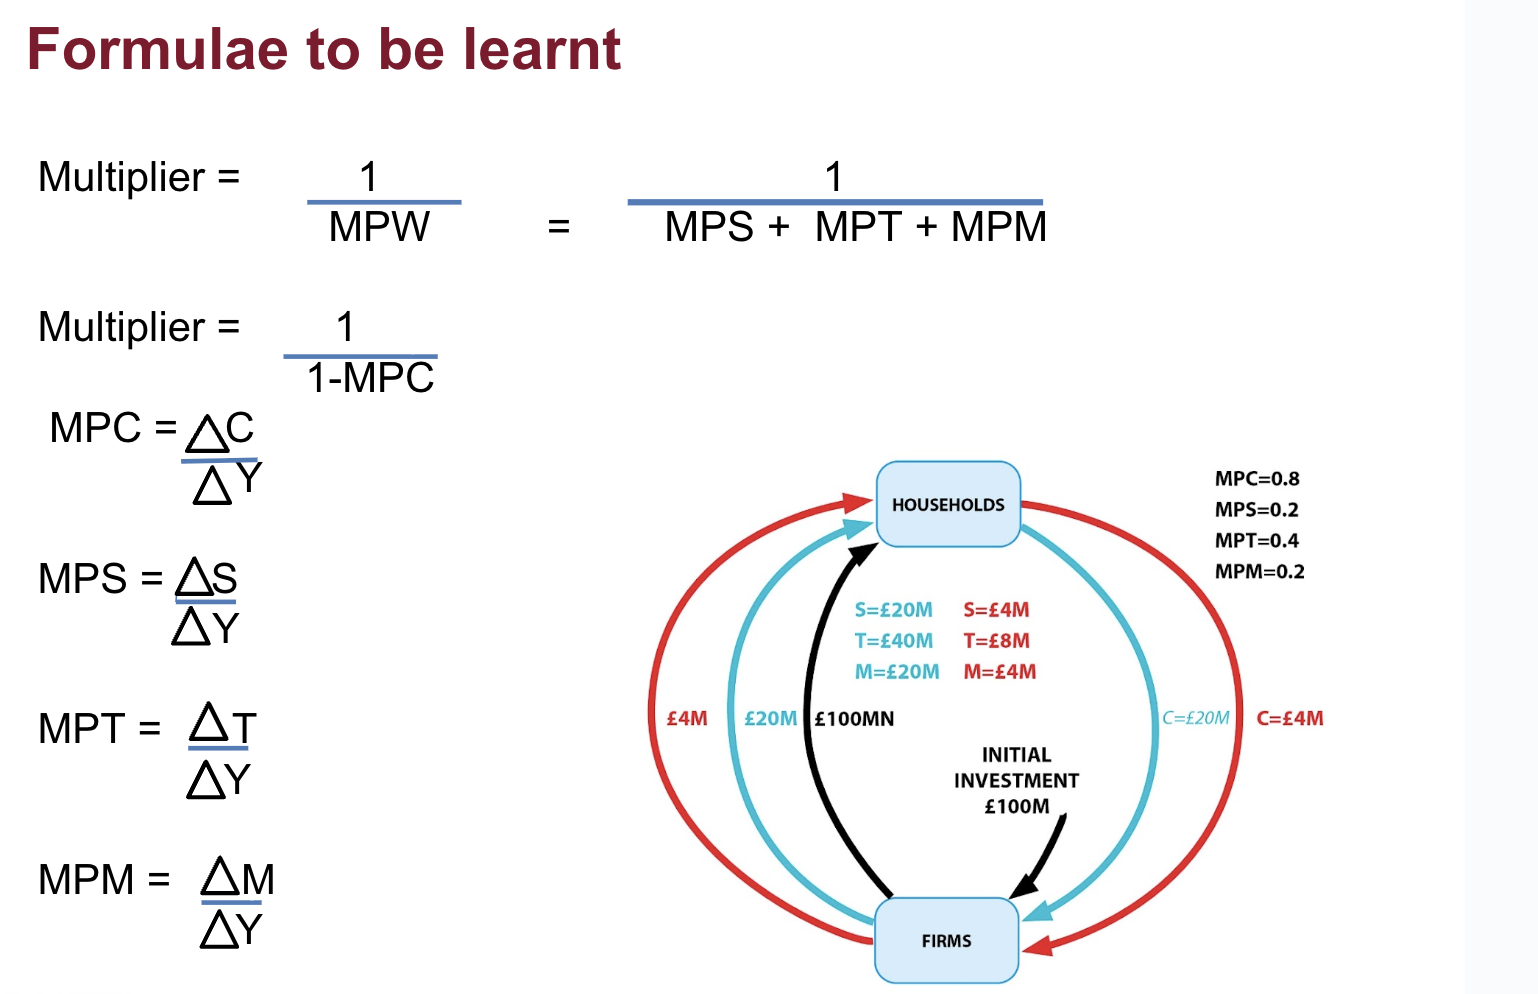
Multiplier = 1 / (sum of the propensity to save + tax + import)
Positive Multiplier vs Negative Multiplier Effects
Positive multiplier: When an initial increase in an injection (or a decrease in a leakage) leads to a greater final increase in real GDP.
Negative multiplier: When an initial decrease in an injection (or an increase in a leakage) leads to a greater final decrease in real GDP.
Calculating the Marginal Propensity to Consume
MPC = change in consumption following a change in income
= change in total consumption / change in gross income
E.g. if gross income increases by £5,000 and spending rises by £4,000 then the MPC = £4,000 / £5,000 = 0.8
Calculating the Marginal propensity to save (MPS)
MPS = change in savings following a change in income
= change in total savings / change in gross income
E.g. If rise in gross income = £5,000 and rise in C = £4,000, then change in saving = £1,000. Therefore MPS = £1,000 / £5,000 = 0.2
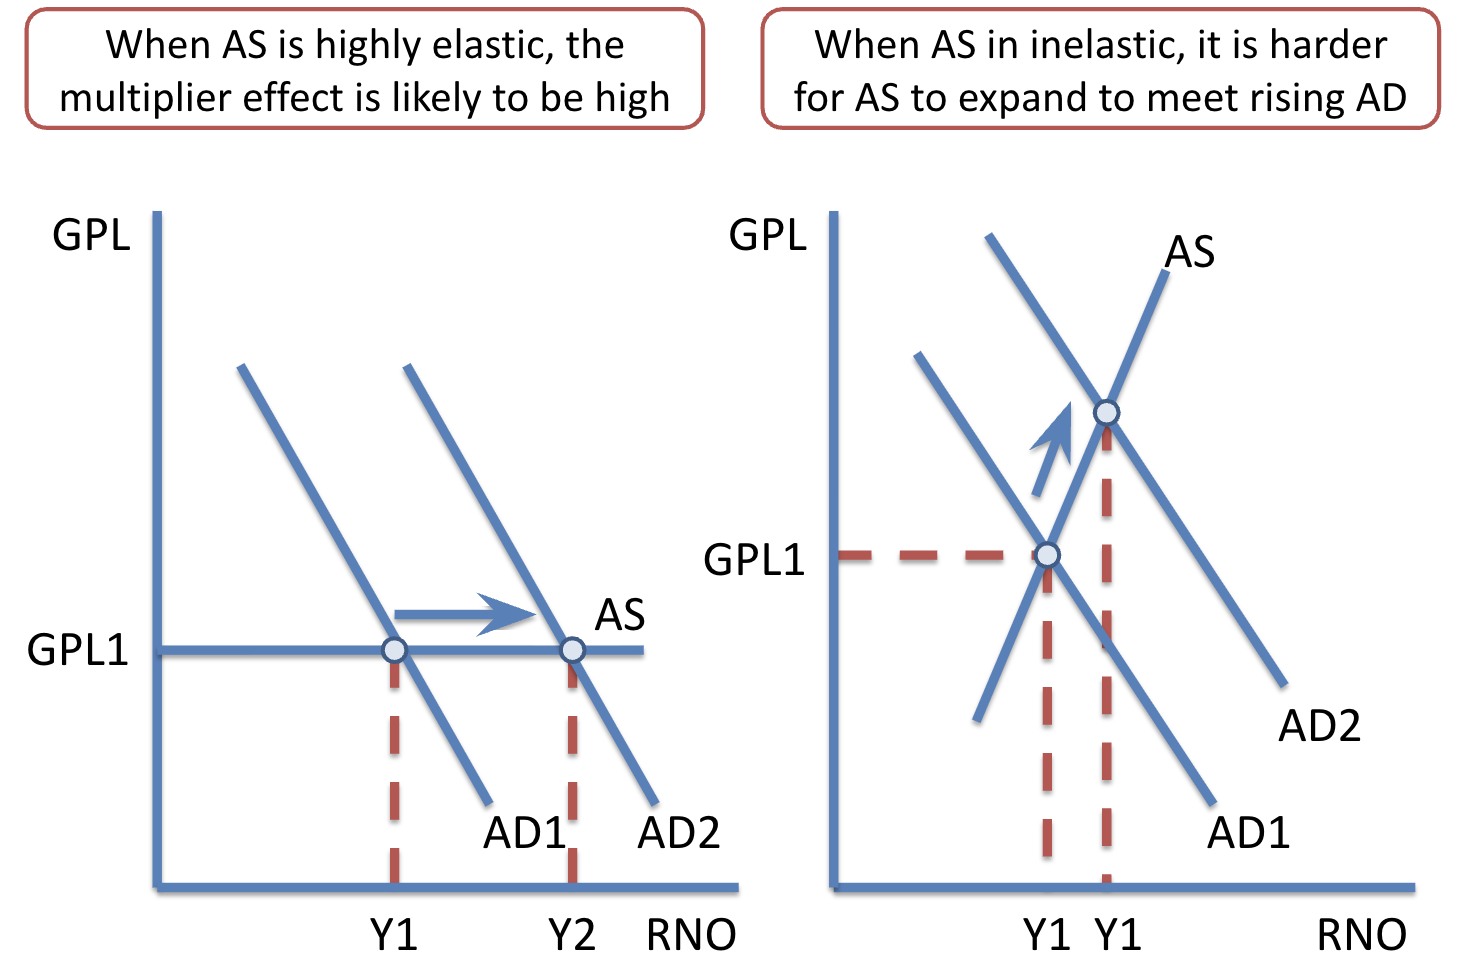
Elasticity of Aggregate Supply & the Multiplier Effect
High Multiplier Value when
Economy has plenty of spare capacity (negative output gap) to meet higher demand
Marginal propensity to import and tax is low
High propensity to consume any extra income (i.e. a low propensity to save)
Low Multiplier Value when
Economy is close to it’s capacity limits e.g. during a boom phase
Propensity to import goods & services is high - extra demand leaks from circular flow
Higher inflation causes rising interest rates which then dampens other components of AD
Summary of formulas
Measuring The Output Gap
The output gap is the difference between the actual level of GDP and its estimated potential level. It is usually expressed as a percentage of the level of potential output.
Negative Output Gap when
When the level of actual GDP is less than potential GDP
Some factor resources are under-utilised e.g. demand-deficient unemployment
Main problem is likely to be higher unemployment and possible deflation risk
Positive Output Gap when
Actual GDP is greater than the estimated potential GDP
Some resources working beyond usual capacity (shift work & overtime)
Main problem is rising demand-pull and cost-push inflationary pressures
Problems in Measuring the Output Gap
We cannot observe directly the supply potential of an economy directly
Inaccurate data on the labour force for example difficulties in measuring the scale of net inward labour migration
Problems in accurately measuring productivity
Surveys of producers about spare capacity may be inaccurate
Gaps in knowledge about how much businesses are investing and the potential output from new capital e.g. in digital sectors
Uncertainties about the number of people who may have left the labour market as “discouraged workers”
Hard to measure the amount of under-employment in the labour market at different stages of the economic cycle