PubPol 3280 Prelim 1
 Call Kai
 Learn
Learn Practice Test
 Spaced Repetition
 Match
Match Flashcards
 Knowt Play
1/95

There's no tags or description
Looks like no tags are added yet.
Name | Mastery | Learn | Test | Matching | Spaced | Call with Kai | Chat |
|---|
No analytics yet
Send a link to your students to track their progress
96 Terms
Population/community health
the health outcomes of a group of individuals, including the distribution of such outcomes within the group
outercircle - community
Population health management
the delivery of health care services toward the achievement of specific health care related metrics and outcomes for a defined population... tied to value based contracts
inner circles - patients
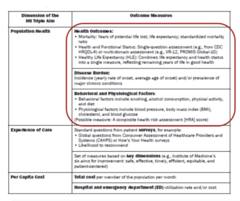
Population health measures
debated
- life expectancy, mortality rates, health and functional status, disease burden, behavioral and physiological factors
Prevention River: Clinical Care
Prevention 1.0: provide medical care which is also preventive care
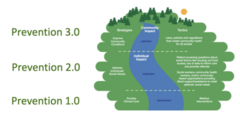
Prevention River: Still in Clinic
Prevention 2.0: Screening for health related social needs
social drivers of health

Prevention River: Community Conditions
collaboration with public health
issue: hospital doesn't want to reduce visits - money

Population health drivers
variation in public outcomes
on average 20% of variation is driven by access to clinical care
80% - health behaviors, physical environment, socioeconomic factors
Population health perspective
should make decisions based on race
risk stratification needed
notion of health equity has been politicized
US population health
The US spends more on healthcare than any other OECD nation
Yet lags behind other OECD countries on key health indicators
Health expenditure vs life expectancy
We spend the most and have lowest life expectancy of countries on graph
Life expectancy is a health outcome
Lead in adult obesity
This is issue population health is trying to solve
Why do we think we need to do different things in healthcare?
5% of population accounts for 50% of spending
6 in 10 adults have at least one chronic disease
7 of 10 leading causes of death are preventable
Quality shortfalls and evidence-based prevention (prevention 1.0)
We pay a lot for health care, don't have greatest health outcomes, and don't get prevention right
We get it right about 50% of the time
Clinical care drives only 20% of health outcomes yet accounts for more than 90% of healthcare spending
Other countries look very different
Access to Care
In 2009, 16.7% US population uninsured
In 2023, 8% uninsured yet
Goal of US health care act to reduce this
BUT coverage does not equal access
Our hospitals are often not safe places to stay
Might leave with an infection
Quality measures hospitals look at:
Documented conditions when someone enters hospital
If get more infections while in hospital, hospital may be penalized by federal government
Inequities in health outcomes
Average in 2023 - 78.4 US life expectancy
BUT a 14 year gap in life expectancy exists between asians and American Indian/Alaska Native peoples on average in 2023
African american, native american, and alaska native women die of pregnancy related causes at a rate about three times higher than those of white women
Place Matters
A 25 year life expectancy gap exists just several bus stops apart
America is getting older
For the first time in US history, older adults are projected to outnumber children by 2035
Older we get more chronic diseases → health care more expense
Geography also comes into play
Epidemiological transition (probably on test)
1900 - deaths due to infectious diseases
Life expectancy - 45
2000 - death primarily due to lifestyle related chronic diseases
Life expectancy - 79
Knowing about leading cause of death in community can give insight into that community
Leading causes of death in US
Still die from infectious diseases but not as much as chronic
Covid added to number of deaths by 20%
By 2024 covid not in top 10
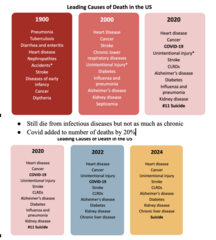
Trends in leading causes of death over time (real vs. artificial)
Examining secular trends in rates
Important to identify real versus artifactual differences over time
Real: changes in age structure of population, changes in survival, changes in incidence
Artificial: changes in disease recognition, definition, classification
Shifting health care landscape: Traditional paradigm (medical model)
Treating sickness/episodic, symptom reduction
in-patient/facility centric
Specialty driven
Physicians E&M (evaluation and management)
Siloed - physical, health, mental - not integrated
Fee for service - get paid if the treatment occurs in clinic
Payment for volume
Shifting health care landscape: New paradigm (population health model)
Managing populations/prevention and wellness
Abulatory: PC, communities, homes, retail, virtual
Primary care driven - interdisciplinary teams + address SDOH (social drivers of health)
Integrated
Shared risk/reward
Payment for value
A national framework: The IHI triple Aim
Key word: "simultaneously"
Health of a population, experience of care, per capita cost
4 key policy drivers in Affordable Care Act
Access
Community and population based activities
Prevention and health promotion
Quality
Policy Drivers ACA: Access - Individual mandate
Key goal: extend health insurance coverage to 52M uninsured in 2009
Lever 1: individual insurance mandate with $ penalty if not insured (penalty lasted 5 years, TCJA (tax cuts job act - passed by trump) 2017 → penalty = $0)
To increase healthy individuals to buy insurance to balance risk pools and lower premiums for all
Young invincibles were not buying insurance
Lever 2: eliminate medical underwriting (try to deny insurance to sick people) and denial for pre-existing conditions
Lever 3: Children covered on parents insurance until age 26
Increased age - more people covered
→ did increase number of insured
Policy Drivers ACA: Access - Medicaid expansion
Key goal: extend health insurance coverage to more low income individuals
Lever: eliminate medicaids "categorical eligibility" and replace with standard income based eligibility criteria (income below 138% FPL)
Federal poverty thresholds
Support states with enhanced federal matching rate for expansion pops
Supreme court 2021: Fed cant force states to expand
10 states that still have not expanded Medicaid
Still have categorical or low FPL
Access has expanded
Reduced uninsured in every state (Texas high outlier)
Compared to 2013
Policy Drivers ACA: Access - State insurance exchanges (with "MEC + 60% AV")
Goal: ensure quality affordable insurance
And comprehensive - 10 essential health benefits
Lever: state insurance marketplaces with "premium subsidies" (if income 100-400% FPL) to make quality health insurance more affordable for small business and individuals
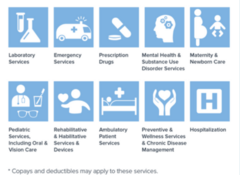
MEC = minimum essential coverage refers to 10 essential health benefits
60% minimum actuarial value (AV) = Min % of expected healthcare costs a health insurance plan must pay (bronze plan = 60% AV
Insurance MECs (10 essential health benefits) → 2014 Supreme court case Burwell v. Hobby Lobby Stores = "hobby lobby exemption"
Insurance MECs (10 essential health benefits)
Insurance MECs (10 essential health benefits) → 2014 Supreme court case Burwell v. Hobby Lobby Stores = "hobby lobby exemption"
Many people think mental health and substance use should not be covered
Also preventative and wellness services and chronic disease management
Concern about counseling related to safe sex
Prescription drugs - birth control pills
Some employers said it violates mission - don't want to support birth control drugs
They won - hobby lobby exemption
Policy Drivers ACA: Access - Support for community health centers
Federally qualified health centers (FQHCs)
In medically underserved areas
Fed doubles FQHC funding to increase their financial stability
Medicaid expansion boosts FQHC revenue (fewer uninsured low income patients)
Fed increases training opportunities and tuition reimbursement to encourage providers to practice in FQHCs
Policy Drivers ACA: Community and population based activities - National prevention strategy
Increase number of people that are healthy at every stage
Policy Drivers ACA: Community and population based activities - Prevention and public health fund
Goal: prevent chronic diseases and eliminate disparities
Lever: PPHF - nations first mandatory funding stream ($15B over 10 years) dedicated to primary prevention of chronic diseases and eliminating disparities (e.g., reduce risk factors)
Administered via community transformation grants and capacity building grants
Hard to prove outcome from
Policy Drivers ACA: Community and population based activities - Incentives for workplace wellness
Goal: increase workplace wellness programs and supports
Lever: small business workplace wellness grants and discounts
Policy Drivers ACA: Community and population based activities - Community health
strengthens community benefit requirements for hospitals + CHNAs + CHIP, enforced by IRS
Most hospitals not for profit so dont pay taxes
Act says can not longer remain not for profit unless can prove community benefit
Whole lecture later on
Policy Drivers ACA: Prevention and health promotion - Expand primary health care training
Goal: increase by number of primary care practitioners, especially in rural areas
Levers:
Funds PC residency training programs (+500 PCPs by 2015)
Trains 600 new PAs who practice team based PC
Trains 600 NPs to provide comprehensive PC
Grants to states to expand PC workforce
Tuition reimbursement for high-need areas (rural)
10% bonus payments to PCPs to make practicing PC more enticing
Policy Drivers ACA: Prevention and health promotion - No cost-sharing for annual USPSTF recommended screenings
If go to annual wellness visit and have a USPSTF recommended screening - you shouldn't have to pay for those
Health insurers must pay for it
To reduce delayed care because of cost
But if have extra screenings - extra costs
Policy Drivers ACA: Prevention and health promotion - Policy Drivers ACA: Prevention and health promotion
People over 65 get health insurance now get annual wellness visits
Policy Drivers ACA: Prevention and health promotion - other
Medicaid expands children's free preventive services to adults
Accountability for patient populations (ACOs)
Policy Drivers ACA: Quality
Requires federal national quality strategy (triple aim)
Creates center for medicare and medicaid innovation (CMMI) to test innovative payment an delivery models
Authorizes value based payment programs
The ACA today: resilient or vulnerable?
Legal challenges: individual mandate (2012, 2017, 2021) and ongoing litigation over preventative services coverage
Political pressures: repeated repeal attempts; debates over medicaid expansion in non-expansion states
Marketing issue as came to be known as obama care
Implementation challenges: rising premiums, insurer participation, coverage gaps
Public opinion: More popular now than at passage, but still politically divisive
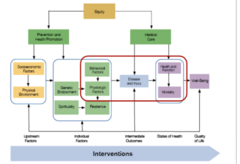
Guide to Measuring the Triple Aim - Upstream factors
physical environment, socioeconomic factors
Impact: behaviors, physiological factors (BMI, blood pressure)
Individual factors
Individual factors impact intermediate outcomes
Why multiple health outcome measures?
A single number alone tells us very little
Need context
Compared to what,whom, or over time
CHR give us this context
Looking at more than one population health outcome is important
County Health Rankings (CHR)
Measures organized from upstream health factors to downstream health outcomes
Nations first publicly available standardized dataset of validated community health data at the county level (CHR will not release a full dataset in 2026)
Years of Potential life lost (YPLL 75)
A measure of premature mortality
Gives greater weight to deaths occurring at younger ages
Can be aggregated by geography, race - ethnicity, gender, and other population characteristics
Life expectancy at birth: deriving life expectancy from a period life table
How long, on average, would a US baby expect to live if born in 2024 and subjected to 2024's age specific mortality rates throughout its lifetime
Its hypothetical
Math never adds up perfectly because probabilities change
Always assume starting at 100,000 people
Plot survival curves
"Shape of mortality"
Survival curves from life tables can be used to visualize shape of mortality and identify inequities
Using surviving column from table
"Rectangularization of mortality"
Super rectangular curve - almost impossible - means people do not die till old age
More rectangular the survival curve - on average the healthier that group is
Made life table for each group by race and gender

Health related quality of life (HRQOL) - measuring
Measuring HRQOL
4 questions used to measure self-reported physical and mental health and activity limitations
Simple, easily understood by survey takers and policy makers
Demonstrated validity and reliability across diverse populations and settings
Survey questions HRQOL
Q1: self rated health
• Health indicator: Percent of population reporting fair or poor health
Q2: Physically unhealthy days
Population health indicator: Mean count of unhealthy days (UHD)
Population health indicator: Frequent physical distress (FPD) = prevalence (%) of 14 or more physically UHDs in the last 30 days
Q3: mentally unhealthy days
Population health indicator: Mean count of unhealthy days (UHD)
Population health indicator: Frequent mental distress (FMD) = prevalence (%) of 14 or more mentally UHDs in the last 30 days
Q4: Activity limitations
Population health indicator: Mean count of ALDs
Population health indicator: Frequent activity limitation days (ALD) = prevalence (%) of 14 or more ALDs within the last 30 days
Healthy life expectancy (HLE)
Goals: max healthy life expectancy
Want to compress morbidity curve
So majority of lives at each age group are healthy versus unhealthy
Kind of abstract
In Sickness and in Wealth in Louisville, KY
Spend more than other countries on health, but do not have bang for buck
Idea of stress that arises from living conditions
Chronic stress
Racism adding even additional burden
Showed a lot of maps → different rates of chronic disease in different areas of the city
Story: different social classes and socioeconomic variables in each reason
Geospatial patterning to both poverty and health
Which graph shows the social gradient in health?
A and B
A: As years of education increase, find that life expectancy on average increase
Positive correlation
B: As household income increases (diff measure of socioeconomic status), the percent reporting fair/poor health decreases
Negative correlation
If health outcome is negative than the gradient can be negative
Make sure to look at graph and understand what is being shared

Social Gradient in Health - Real World Examples
describes the stepwise, continuous phenomenon where people lower down in the socioeconomic hierarchy have worse health outcomes and shorter lives than those directly above them
These graphs measuring same thing
What does relationship between y and x axis say

The Whitehall Studies
Expected to find those at top of hierarchy (CEO) had greatest stress, so greatest prob of heart attacks and death
Found the opposite → surprise
Controlled for all factors - smoking, obesity, etc
Behaviors explained about ¼ of the changes in outcomes
Policy relevance - could enact policy that gets rid of poverty
If we gave them all some type of support to get them above poverty line
We would still have a social gradient just truncated
Socioeconomic Position and health are associated
Better access to healthy food, health producing resources
More time and energy
Time to cook, go to gym, go to doctor
Less environmental stressors
More access to preventative care
Maybe means you have health insurance
More education associated with better health outcomes
More access to therapy
More access to better employment benefits
Live in area less exposed to health hazards
Future thinking mentality to save money for health events
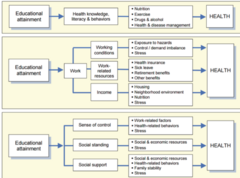
How might education affect health
Pathways through which education can affect health
Social causation
hypothesis
SES (socioeconomic status) causally
affects health (purple
Education can create opportunities for better health → most evidence points towards

Health selection bias
hypothesis
unwell children may be unable to attain higher levels of SES (blue)
reverse casualty
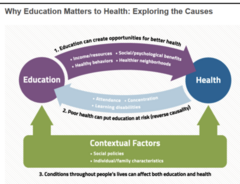
Confounding hypothesis
Conditions throughout people's lives can affect both education and health
Near perfect correlation between ice cream sales and drowning → driving affect: hot in summer
Can individual behaviors explain the social gradient
No more than 25% can be explained
Dr. Troutman says he believes in individual responsibility - but always within the context of social determinants
Don't like term lifestyle changes because makes it sound like you have control
Need to understand conditions in what patients live
Ex. Corey rule about where he lived → don't go further than a street because their are murders there
Twin Study
Dr. Nancy Kreiger's twin study find?
Studied identical twins to control for genetics
Why are twins useful for thinking about "nature vs. nurture"?
One got higher income and one got lower
One with higher got better health outcomes later
• Which hypothesis explaining the association between SES and health does this study tend to support?
1. Social causation
Best explained by this
What changes when stress becomes chronic?
If threat does not pass
Pay rent, secure job, safety of neighborhood
Stress response remains activated/is repeatedly activated
Cumulative physiological "wear and tear"
Immune, cardiovascular, metabolic, brian
Increased disease risk
Macaque Monkey study
Dr. Carol Shively
Same environment, same food, same sun
Found: difference in arteries
Want big gap but as glucose floods bloodstream - creates plaque - have heart attacks
Looked at connections between power, control, subordination, and health
Cold study
Looked at socioeconomic status
Whether your parents owned the home you lived in
For how many years
Mattered for how got a cold
Association between socioeconomic security, power control, and stress in humans
Policy response would be to ensure more people own homes
Allostatic load
Refers to the
cumulative burden
of chronic stress
and life events
which increases
chances of having
poor health
outcomes
Allostatic load is higher among individuals with low SES, racial and ethnic minorities, and persons with higher ACE scores
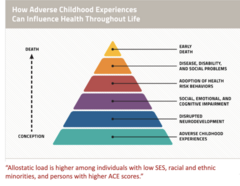
Racism poses an additional burden on health of people of color
Race, ethnicity, gender, immigration status and other dimensions of social identity shape exposure to stress, opportunity, resources, power, and control
Social drivers of health (SDOH) key definitions
Factors related to where pray, place, stay, etc
Often don't put health behaviors
Different people explain differently
Economic conditions, social factors, and the physical conditions in the environment in which people are born, live, learn, play, work, and age which, in turn, are shaped by the global distribution of money, power, and resources (WHO; HP 2020

population health model
Simplified model of upstream, downstream population health model
Differences in behaviors to the right are function of the drivers to the left
SDOH - lots of place based
Upstream from that → often due to policy → structural determinants

Why does place matter?
Places shape what we're exposed to (direct impacts on health)
Ex from video. Built environment of house → mold, asthma
Places shape what resources and opportunities are available (indirect impacts on health by making healthy choices easy, difficult, or impossible)
Ex. gang violence - influences whether go outside, how far, stress response cycle
Place itself is shaped by policy and investment
Built environment
How design, construction, and placement of buildings within a community, as well as the design of the surrounding community (e.g., zoning, sidewalks, parks, hazards), impact human health
Social environment:
Refers to behaviors, connections, norms, social capital, and socio-demographic characteristics of people (residents, business owners) in an environment that may impact health
Social or built environment? Direct or indirect impacts?
Seattle public health official James Krieger outlines neighborhood features that influence health
Proximity to environmental hazards
• Quality of schools
• Quality of affordable housing
• Frequency of violence and crime
• Opportunities for social interaction with neighbors
• Access to affordable, healthy food choices
• Places to walk or do other kinds of physical activities
• Billboards and advertising
Proximity to environmental hazards
Built
• Quality of schools
Social - funding
Built - poor physical buildings
• Quality of affordable housing
Built - buildings full of mold
Social - maybe could be argued
• Frequency of violence and crime
Social
• Opportunities for social interaction with neighbors
Social - rebuilt for intentional interaction
• Access to affordable, healthy food choices
Built
• Places to walk or do other kinds of physical activities
Built
• Billboards and advertising
Built
Place mechanisms: pathways through which neighborhood conditions could affect health
Another example of upstream downstream
Place based drivers → mechanism → impact health

Richmond, CA and Gwai Boonkeut
What caused Gwai's heart disease
Prolonged exposure to stress
Cardiologist David Weiland wonders why Gwai Boonkeut - a relatively young patient with no history of smoking, no family heart disease, no typical behavioral or genetic risk factors - ended up having a heart attack
Social or built
Social- violence
Built - near a polluting plant
Social causation hypothesis or health selection bias hypothesis
Social causation hypothesis
High Point, Seattle, WA and Stephen Truong
Upstream policy → to rebuild community
Knew there was an asthma problem
Built breeze easy units to fix built environment problem
Who had the power and control to change the neighborhood?
Community had stake in decision making
Used their thoughts to shape the policy
Describe the impact of Stephen Troung's new "breathe easy" unit on his health? His family?
Social or built environment?
Built - breathe easy unit
Social - socialize with neighbors was focused on
Social causation hypothesis or health selection bias hypothesis?
His health impacted his mom
Poor health influences social drivers
Put him in ER, missed school
Socioeconomic status of mother - had to take off work to be with him
Why did Richmond become an unhealthy place?
During WWll RIchmond was a booming racially diverse industrial community. After the war
Policy → racially restricted home loans
Government backed home loans so could afford home (less than 2% went to black families)
Describe the cycle of disinvestment that followed
Check cashing companies moved in, alcohol biz moved in
Created built environment hard to have positive health outcomes
Place matters
How might this cycle make it more expensive to be poor - the poverty tax
Things become more expensive
Food desert
neighborhood with poor access to healthful foods such as fresh and affordable fruits and vegetables, whole grains, low-fat milk, and other foods that make up the full range of a healthy diet
How does food environment/access impact choice? examples
Higher your income the more supermarkets
Ex. of built environment
Health wealth gradient
Lower income more liquor stores
Another study - how far different ethnicities had to walk to hit fast food and groceries
In Chicago Black residents had to go further to go to grocery store
USDA definition of food desert
A low income census tract (20% of pop below FPL) with 33% or more of population residing at least 1 mile (10 miles if rural) from a supermarket or large grocery store
Distance alone does not = access
Just because you do live near one does not mean you can afford
Violence and public health
The documentary touches upon the health effects of violence in Richmond. In what ways does violence affect the health of children
Cycles of disinvestment continue
Hard to say that will spend money now and save money in ER visits
If violence is presented as a public health threat rather than a crime issue, how might that affect the way policy changes are perceived?
How does the "YES" program protect kids from effects of violence?
Young kids have sense of no power or control - stress response - poor health
Gave kids sense of control
Health policy quote
What that means is that housing policy is health
policy. Educational policy is health policy. Anti-
violence policy is health policy. Neighborhood
improvement policies are health policies. Everything
that we can do to improve the quality of life of
individuals in our society has an impact on their
health and is a health policy."
Observed differences in rates of disease and unequal access to quality healthcare along race, gender, SES result in unnecessary healthcare spending due to:
Delayed care
Missed diagnoses
Later diagnoses
Repeated visits
Medical error
Lost productivity
** business and moral imperative
Upstream drivers of health
Systemic or structural drivers impact the social drivers of health impact behaviors more proximal to health outcomes
The Iceberg Analogy
Below the waterline
Policies, laws, institutional practices, historical decisions
Things that are imbedded - often cant see
Near the waterline
SDOH
Social and economic conditions people live with
Above the waterline
Behaviors and observable health inequities
Ex. redlining example
Discriminatory lending influence home owners, leave people of color behind, experience poorer health outcomes

Example of structural factor: Structural racism
The structures, policies, practices, and norms resulting in differential access to the goods, services, and opportunities (SDOH) of society by race
It is structural, having been codified in our institutions of custom, practice, and law, so there need not be an identifiable perpetrator
Race is not biology - but racism has biological consequences
Race is a social construct - created and defined by societies - not by discrete biological or genetic differences - and those categories can change across time and place
Clinicians and researchers focus on genetics and biology, the experience of racism, and SDOH inequities - not race - when describing risk factors for disease
Racial inequities in health and well being (life expectancy, mortality) exist regardless of income and education
Dr. James Marion Sims
Father of modern gynecology - designed the speculum
Performed surgery without consent or anesthesia on enslaved women he purchased or rented
Observed racial health inequities are rooted in historical and contemporary racism and implicit bia
Tuskegee Syphilis Experiment 193201972
USPHS and CDC withheld treatment to study natural progression of syphilis
Black poor ranchers told they were being given medicine
"As I see it, we have no further interest in these patients until they die" - study doctor
Goal was to watch them die to observe the process
Cure for syphilis became available during the later end of the study - and still withheld the treatment
Observed racial health inequities are rooted in historical and contemporary racism and implicit bia
1933: Home owners loan corporation (HOLC)
"Residential security maps" assessed risk/creditworthiness for real estate investment
If tie to cold study - owning a home is positive for health
HOLC grades codify legal discriminatory practices because mostly based on race
Graded based on who lives in the neighborhood - race and immigration status
Banks issue loans to higher graded neighborhoods
Redlining: Neighborhoods impoverished by design
1934: National housing act
Part of New Deal to restore housing market after Great Depression
Established FHA and Federal Home Loan Bank Board to increase - and segregate - homeownership
Cycle of disinvestment - people with wealth move out because loan available - left behind - schools leave - tax base leaves
Redlining: Neighborhoods impoverished by design
"Redlining"
Deprives Black homebuyers of wealth accumulation and intergenerational wealth transfer
Influences neighborhood trajectories re: infrastructure, services, and employment (investment v. disinvestment)
Green - "homogenous neighborhoods"
Red - hazardous, pronounced "detrimental influences"

Dr. Debbie Salas Lopez, SVP of Community Population Health
Mapped COVID-19 incidence and mortality to redlined communities using HOLC maps
The legacy of redlining is still visible in population health today
Sever COVID 19 risk is higher today in neighborhoods graded red or yellow in the 1930s (Louisville, KY)
Redlining, extreme heat, and health
Historically redlined neighborhoods are hotter today
Reflecting decades of less investment in trees and green space and more heat trapping pavement and development
Cycle of disinvestment
Redlining and risk of preterm birth in NYC 2013-2017
Upstream - downstream model
Structure (redlinging) - neighborhood trajectories of disinvestment - place based resources and other socioeconomic - embodied exposures - inequities in risk of preterm birth
Lower grade HOLC aras are associated with higher odds of preterm birth
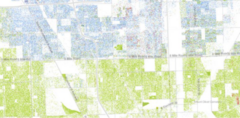
Detroit segregation barrier
No specific redlining but related
Only way lender would give money is if built a wall between neighborhoods - segregation barrier
Now its a road but was a wall (8 mile road)
Can see clear demarcation between green and blue
Blue dots = white
Green dots = african american
Red dots = asian
Orange dots = latino
Brown dots = all others
racial covenants
Legal documents all over the country to keep people who ere not white from buying or even occupying land/property
Ruled illegal by supreme court in 1948 but continued for decades
Ex. how systems create inequity
Unequal treatment examples
50% medical students and residents believe at least one race related false belief
Coming from stories we have created
Lead to biases in pain perception and less accurate treatment recommendations
race correction in clinical algorithms
Cardiology, nephritis, obstetrics, urology
Race correction?
Built in tools - input variables, use of race, equity concern
Systemic - does not make sense
EGFR indicates better kidney function (systemic)
Non-african american number vs african american number
Built into the algorithm - electronic health record
Optum racially biased clinical algorithm
Black patients assigned the same level of risk by the algorithm are actually sicker than white patients, because the algorithm uses health costs as the measure for health needs
Systemically, less money is spent caring for Black patients for white patients
This racial bias reduces the number of Black patients identified for extra care by more than half.
Additional examples of structural drivers of health
School funding based on property taxes
- Value of home - structure
= Inequities in education - inequities in health
Opioid addiction treatment and policy (buprenorphine vs methadone)
- Methadone - have to go to clinic daily - black people get given more
Medicaid paying less than cost; maternity bundle not long enough
Water rights and river diversion
Unequal sentencing guidelines
- Powder vs crack cocaine
Non-inclusive health intake forms
Grad school entrance exams
Voter restriction/gerrymandering
Walmart hiring < 40 hours/week
Online applications for income based supports
Bail policy and "poverty incarceration"