Module 6-8 final exam psychological statistics
5.0(1)
Card Sorting
1/43
Earn XP
Description and Tags
Last updated 12:21 AM on 6/29/23
Name | Mastery | Learn | Test | Matching | Spaced | Call with Kai |
|---|
No analytics yet
Send a link to your students to track their progress
44 Terms
1
New cards
Ztest
is a **statistical procedure** used to test an alternate hypothesis against the null hypothesis. N > 30
2
New cards
Ttest
it is a type of **inferential statistic** used to determine if there is a significant difference between the means of two groups, which may be related in certain features. N < 30
3
New cards
Student’s distribution
The T distribution is also known as the \______ since it was developed by Gosset in 1908 under the name Student.
4
New cards
Analysis of variance (ANOVA)
is an **analysis tool** used in statistics that splits an
observed aggregate variability found inside a data set into two parts: systematic factors and
random factors. is used to test the significant difference between the mean of 3 or more sets
of data simultaneously.
observed aggregate variability found inside a data set into two parts: systematic factors and
random factors. is used to test the significant difference between the mean of 3 or more sets
of data simultaneously.
5
New cards
One way ANOVA
\
it is used for **three or more groups of data,** to gain information about the relationship between the dependent and independent variables. It is developed by fisher. **The search stops when we accept the null hypothesis**; however if we reject the null, then the search continues.
it is used for **three or more groups of data,** to gain information about the relationship between the dependent and independent variables. It is developed by fisher. **The search stops when we accept the null hypothesis**; however if we reject the null, then the search continues.
6
New cards
Z-test for comparing two samples (population standard deviation is given)
What formula is this

7
New cards
Z-test for comparing two samples (sample standard deviation is given)
What formula is this

8
New cards
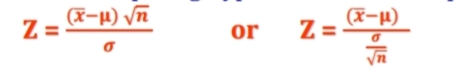
Z-test for comparing hypothesized and sample mean
What formula is this
9
New cards
T-test for Comparing Hypothesized and Sample Means
What formula is this

10
New cards
T-test for Comparing Two Independent Sample Means
What formula is this

11
New cards
T-test for Dependent or Correlated Samples
What formula is this

12
New cards
Independent Samples
are samples drawn from entirely different population
13
New cards
Dependent Samples
\
are drawn from the same population or the same set of samples subjected to different experimental conditions
are drawn from the same population or the same set of samples subjected to different experimental conditions
14
New cards
Correlation Analysis
is the method used to measure the strength of the relationship between two or more variables.
15
New cards
Correlation
is the relationship of one variable to another variable.
16
New cards
coefficient of correlation
The number that expresses the degree of relationship between the variables is called its value ranges to -1 to 1
17
New cards
Positive Correlation
indicates that a higher degree in one variable is associated with a higher degree in another variable. (Direct Correlation)
18
New cards
Negative Correlation
indicates that a higher degree in one variable is associated with a lower degree in another variable. (Inverse Correlation)
19
New cards
Zero Correlation
means that no relationship exists between the variables
High Correlation
High Correlation
20
New cards
Moderately high correlation
What is the Indication of 0.6 to 0.79 correlation coefficient value
21
New cards
Moderate Correlation
What is the Indication of 0.4 to 0.59 correlation coefficient value
22
New cards
Low Correlation
What is the Indication between of 0.2 to 0.39 correlation coefficient value
23
New cards
Negligible Correlation
What is the Indication between of 0.1 to 0.19 correlation coefficient value
24
New cards
Pearson product moment correlation coefficient
the formula that is most appropriate when the data are in interval or ratio scale
25
New cards
Spearman rank order correlation coefficient
the formula is used to rank the two variables to determine the strength of relationship between two variables. It is used when the data is ordinal
26
New cards
Regression Analysis
deals with the estimation of one variable based on the change or movement of the other variable
27
New cards
Regression
is the way of estimating the value of dependent variable from the known value/values of the independent variable/variables
28
New cards
Simplest regression
it involves two variable, one dependent variable and one independent variable
29
New cards
Linear regression
it can involve one dependent variable and more than independent variables
30
New cards
Hypothesis testing
is the process of making an inference or generalization on a population based on the result of the study on samples.
31
New cards
One tailed test
test: It is a directional test with the region of rejection lying on either left or right tail of the normal curve.
32
New cards
Left directional test
The region of rejection is on the left tail. It is used when the alternative hypothesis uses comparatives such as less than, smaller than, lower than, inferior to, below, etc.
33
New cards
Right directional test
The region of rejection is on the right tail. It is used when the alternative
hypothesis uses comparatives such as greater than, higher than, better than, superior to, exceeds, etc.
hypothesis uses comparatives such as greater than, higher than, better than, superior to, exceeds, etc.
34
New cards
Two tailed test
It is a nondirectional test with the region of rejection lying on both tails of the normal curve. It is used when the alternative hypothesis uses words such as not equal to, significantly different, etc.
35
New cards
It to rule out chance as a plausible explanation
the general good of a hypothesis test
36
New cards
Hypothesis test
is used to evaluate the results from a research study which A sample is selected from the population, The treatment is administered to the sample, After treatment, the individuals in the sample are measured.
37
New cards
Statistical hypothesis
it is a guess or prediction made by the researcher regarding the possible outcome of the study. (yung ho at ha)
38
New cards
Null hypothesis HO
It is the hypothesis to be tested which one hopes to reject. It shows equality or no significant difference or relationship between variables. It always express equality \=
39
New cards
Alternative hypothesis HA
It generally represents the idea which the researcher wants to prove. It always express < \>
40
New cards
Type 1 error
it is committed when the null hypothesis is rejected when in fact it is true the
the alternative hypothesis is false.
the alternative hypothesis is false.
41
New cards
Type 2 error
it is committed when the null hypothesis is accepted when in fact it is false
and alternative hypothesis is true
and alternative hypothesis is true
42
New cards
Level of significance
is the degree of error that can be allowed for a particular study. It
is denoted by the Greek letter α (alpha).
is denoted by the Greek letter α (alpha).
43
New cards
Parametric test
are tests that involve numerical data and are based on assumptions about the parameters of the population from which the sample is drawn. usually applied when the sample is randomly drawn or normality can be assumed. Condition of homogeneity, or having common variance, is necessary when more than one population are used. Eg: SPEARMAN RHO, Z
44
New cards
Non parametric test
are tests that do not involve assumptions about population parameters or about the form of the distribution. It can be applied when data are not numerical and that measurements are nominal or ordinal. Eg: PEARSON R