EKG BBB + Hypertrophy
1/61
There's no tags or description
Looks like no tags are added yet.
Name | Mastery | Learn | Test | Matching | Spaced | Call with Kai |
|---|
No analytics yet
Send a link to your students to track their progress
62 Terms
The left bundle branch has
left anterior fascicle
left posterior fascicle
A blocked bundle branch is a
slow and chaotic way to innervate the myocardium = wide, bizarre complex
distinction between a PVC and a BBB
The PVC is aberrantly conducted from inception.
The BBB is normally conducted until it hits the block.
In a blocked right bundle
impulse transmitted normally by left bundle to most of left ventricle
RBBB results in slow impulse that shows
QRS interval ≥ 0.12 second
can manifest as additional wave
a RBBB may have
RSR’ (bunny ears) in precordial leads V1 and Vs
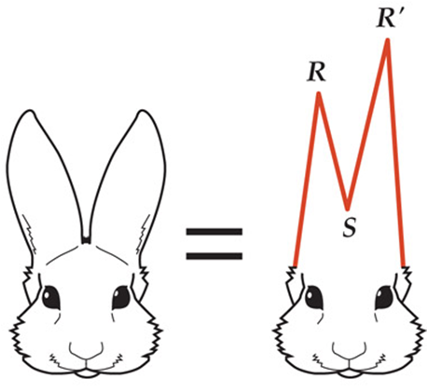
RSR’ in RBBB (V1 and V2)
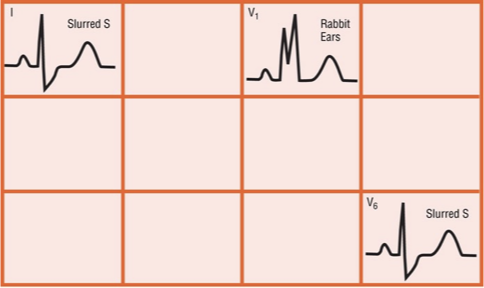
Main criteria for RBBB
1.QRS prolongation
≥ 0.12 seconds
2.Slurred S wave in leads I and V6
3.RSR′ pattern in lead V1, with R′ taller than R
3 major criteria for RBBB
1.QRS ≥ 0.12 second
*Even one lead with a QRS complex ≥ 0.12 seconds
2. Slurred S wave in leads I and V6
*S wave can have various morphologies, but all are prolonged and slow
3. RSR′ pattern in V1
*Can have various presentations
*Some call them “rabbit ears”
*Key point: All predominantly positive in lead V1If you see an ECG with wide QRS complexes, slurred S waves, and a positive complex in lead V1, you have made a diagnosis of RBBB.
MOST important diagnostic criterion for RBBB is
slurring of the s wave
If you see an ECG with wide QRS complexes, slurred S waves, and a positive complex in lead V1, you have
made a diagnosis of RBBB
RBBB
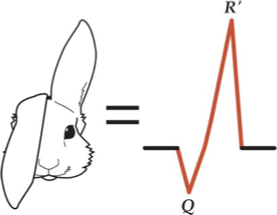
another finding suggestive of a RBBB is a
QR’ wave
QR′ wave occurs when the ECG shows characteristic changes of
anteroseptal myocardial infarction.
*Q waves in leads V1 and RBBB
*ECG will show Q wave in place of the
initial R wave of the RSR′ pattern.
Because the Q wave takes the place of the R wave, next positive wave is
an R′ wave; hence QR′.
When looking for a RBBB, don’t make the mistake of
only looking for rabbit ears
QR’ wave too!
in lead 1 and lead 2
in a RBBB, leads V1 and V2 should have an increased R:S ratio and some semblance of an RSR′ or QR′ complex.
A LBBB shows
QRS complex always 0.12 seconds wide or more.
Usually composed of monomorphic complexes (all positive or all negative)
Have ST-segment depression or elevation
Have broad T waves
*The result of all these findings is an ugly ECG.
an LBBB can be due to
one of two conditions:
*Block of left bundle
*Block of both fascicles of left bundle
Complexes in a LBBB are
not as sharp as in RBBB = broad, monomorphic complexes
LBBB gives rise to complexes
negative in leads V1 and V2 and positive in leads I, V5, and V6

left bundle branch block pattern is like a rock thrown up in the air: It goes either all up or all down
criteria for diagnosing LBBB
1.Duration ≥ 0.12 seconds wide
2.Broad, monomorphic R waves in I and V6; no Q wave
3.Broad, monomorphic S waves in V1; may have small r wave
Other LBBB criteria
*Can be some variation in R wave size in V1
*R wave can be narrow (<0.03 second) or notched
*Wider R waves can be sign of posterior AMI
common causes of RBBB
*Congenital birth defect+ atrial septal defect
*Myocardial infarction
*Myocarditis
*Cardiomyopathy
*Hypertension
Pulmonary embolism
common causes of LBBB
*Hypertension
*Coronary artery disease (CAD)
*Dilated cardiomyopathy
*Rheumatic heart disease
*Infiltrative diseases of the heart
*Benign or idiopathic causes
Vast majority due to hypertension, CAD, or both
in a LBBB it is not
possible to diagnose LVH or RVH
summary of LBBB
*Complexes are conducted aberrantly.
*True sizes of complexes cannot be calculated.
*Most LBBBs have normal axis or left axis
in a RBBB, you can diagnose
LVH by normal criteria
summary of RBBB
*RVH cannot be diagnosed.
*Ischemia: Remember concept of concordance.
*Atrial enlargement: Use usual criteria.
the left anterior fascicle is
Organized, thin bundle of fibers off left bundle
Gives rise to Purkinje fibers
These then innervate anterior and lateral walls of LV
the left posterior fascicle originates from
left bundle
Not organized into tight fascicle—disperse loosely and fan out
Origin of fibers that innervate inferior and posterior walls of left ventricle
Hemiblock means “half” of LBBB is
blocked after it splits into left anterior and left posterior fascicles.
Blocked left anterior fascicle is
left anterior hemiblock (or left anterior fascicular block).
Blocked left posterior fascicle is
left posterior hemiblock (or left posterior fascicular block).
Hemiblocks cause ventricles to be
innervated asynchronously and aberrantly.
When left anterior fascicle is blocked:
depolarization of left ventricle has to progress from interventricular septum, inferior wall, and posterior wall toward anterior and lateral walls
gives rise to unopposed vector pointed superior and leftward
a left anterior hemiblock produces changes in the
net axis of ventricles toward left, producing left axis deviation
Electrical axis between –30° and –90 °
criteria for diagnosing left anterior hemiblock
1.Left axis deviation with axis at –30˚ to –90˚
2.Either a qR complex or an R wave in lead I
3.An rS complex in lead III, and probably leads II and aVF
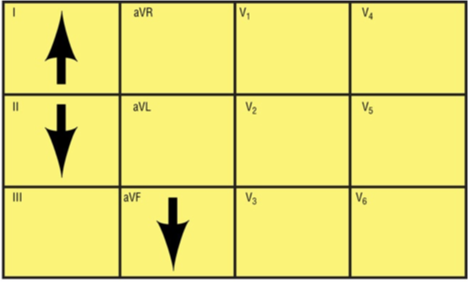
left anterior hemiblock = QRS complex should be positive in lead I, negative in leads aVF and II
a left posterior hemiblock is
Rare because:
*Left posterior fascicle is difficult to block; fibers are not organized as a discrete bundle
*Lesion that could cause this type of block would have to be very large
criteria for diagnosing left posterior hemiblock
1.Axis of 90 ° to 180 °in right quadrant
2.s wave in lead I and q wave in lead III
Right atrial enlargement (generally more dilatation than hypertrophy) is usually caused by
increased pressure in the right atrium. This is referred to as right atrial overload.
Right atrial enlargement may be due to
Pulmonary valve stenosis
Tricuspid valve stenosis and insufficiency = (relatively rare)
Pulmonary hypertension from various causes, such as the following:
*COPD
*Status asthmaticus
*Pulmonary embolism
*Pulmonary edema
*Mitral valve stenosis or insufficiency
*Congenital heart disease
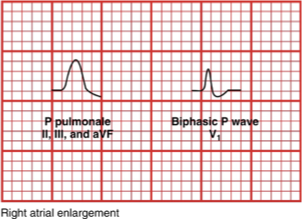
right atrial enlargement
The typical result of right atrial enlargement is a
tall, symmetrically peaked P wave.
*Leads II, III, and aVF
*This waveform is referred to as P pulmonale.
Left atrial enlargement (generally more dilatation than hypertrophy) is usually caused
by increased pressure in the left atrium
A condition referred to as left atrial overload
left atrial enlargement can occur in
*Mitral valve stenosis and insufficiency
*Acute myocardial infarction (AMI)
*Left heart failure
LVH from various causes, such as the following:
*Aortic stenosis or insufficiency
*Systemic hypertension
*Hypertrophic cardiomyopathy
on ECG in left atrial enlargement you will see
A broad, positive P wave in any lead
A wide, notched P wave with two humps that appear 0.04 second or more apart
*The first hump represents the depolarization of the right atrium.
*The second hump represents the depolarization of the distended left atrium.
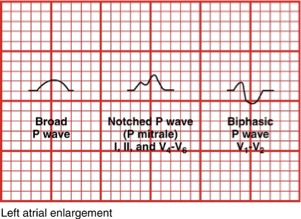
left atrial enlargement
left ventricular hypertrophy can be caused by
Pressure overload develops when ventricle has to pump harder against resistance:
*Systemic hypertension
*Aortic stenosis
*Mitral insufficiency
*Hypertrophic cardiomyopathy
Volume or dilation problem: volume overload
*The heart becomes larger in an effort to:
become stronger, pump more blood
in LVH on ECG…
Creates a larger vector and increased amplitude, especially true in precordial leads
*The more mass or cells in the heart, the more action potentials are generated.
in identifying LVH step by step
Look in V1 and V2, pick the deepest negative deflection, count small boxes of negative deflection in that lead = remember that number
Look in V5 and V6, pick the tallest positive deflection; count small boxes of positive deflection = remember that number
Add the two numbers together, suspect LVH if the sum equals 35 or more
The product of R and S waves determines LVH.
Remember: Final product must be ≥ 35 mm.
The sum is important, not which of the two parts is greater
LVH is often mistaken for AMI because of the
ST-segment elevation and depression associated with it.
*Pay attention to how the tallest or deepest waves have the most ST-segment variations.
right ventricular hypertrophy is usually seen in
RV pressure overload
Potential causes:
*Pulmonary valve stenosis
*Pulmonary emboli
*Pulmonary hypertension
*COPD
signs of RVH on ECG
first thing you should see is a large R wave on the QRS complex.
*Result of adding energy generated by the initial QRS vector to the larger vector generated by the enlarged RV
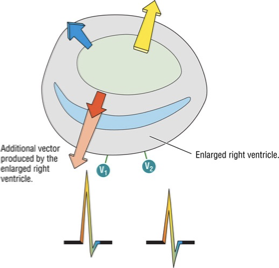
RVH

*Figure A shows a typical pattern for RVH in V1.
*In Figure B, the R:S ratio is still greater than 1, but the ST segment and T waves look different (strain pattern).
RVH is diagnosable/likely if
the R:S ratio is greater than or equal to 1 in leads V1 and/or V2.
in RVH on an ECG, the R wave is a
tall R wave is present in leads II, III, and V1
R wave is usually 7 mm or more in height in lead V1.
It is equal to or greater than the S wave in depth in this lead.
A relatively tall R wave is also present in the adjacent precordial leads V2 to V3.
in RVH on an ECG, the S wave is
relatively deeper-than-normal S wave is present in lead I and the left precordial leads V4 to V5.
in lead V6, the depth of the S wave may be greater than the height of the R wave.