Chapter 19- Species Diversity in Communities
1/91
There's no tags or description
Looks like no tags are added yet.
Name | Mastery | Learn | Test | Matching | Spaced | Call with Kai |
|---|
No analytics yet
Send a link to your students to track their progress
92 Terms
Concept 19.1- Species diversity differs among communities due to…
variation in regional species pools
abiotic conditions’
Species interactions
Figure 19.1- Tilman Powered By Prairies Experiment
This figure refers to a long-term ecological experiment by David Tilman and colleagues at the Cedar Creek Ecosystem Science Reserve in Minnesota.
Design Summary:
Researchers planted prairie plots with different numbers of species: some had just 1 species, others had 2, 4, 8, or more.
They measured biomass production and resource use (e.g., energy input).
The goal was to determine whether higher biodiversity leads to more efficient use of resources and greater overall productivity.
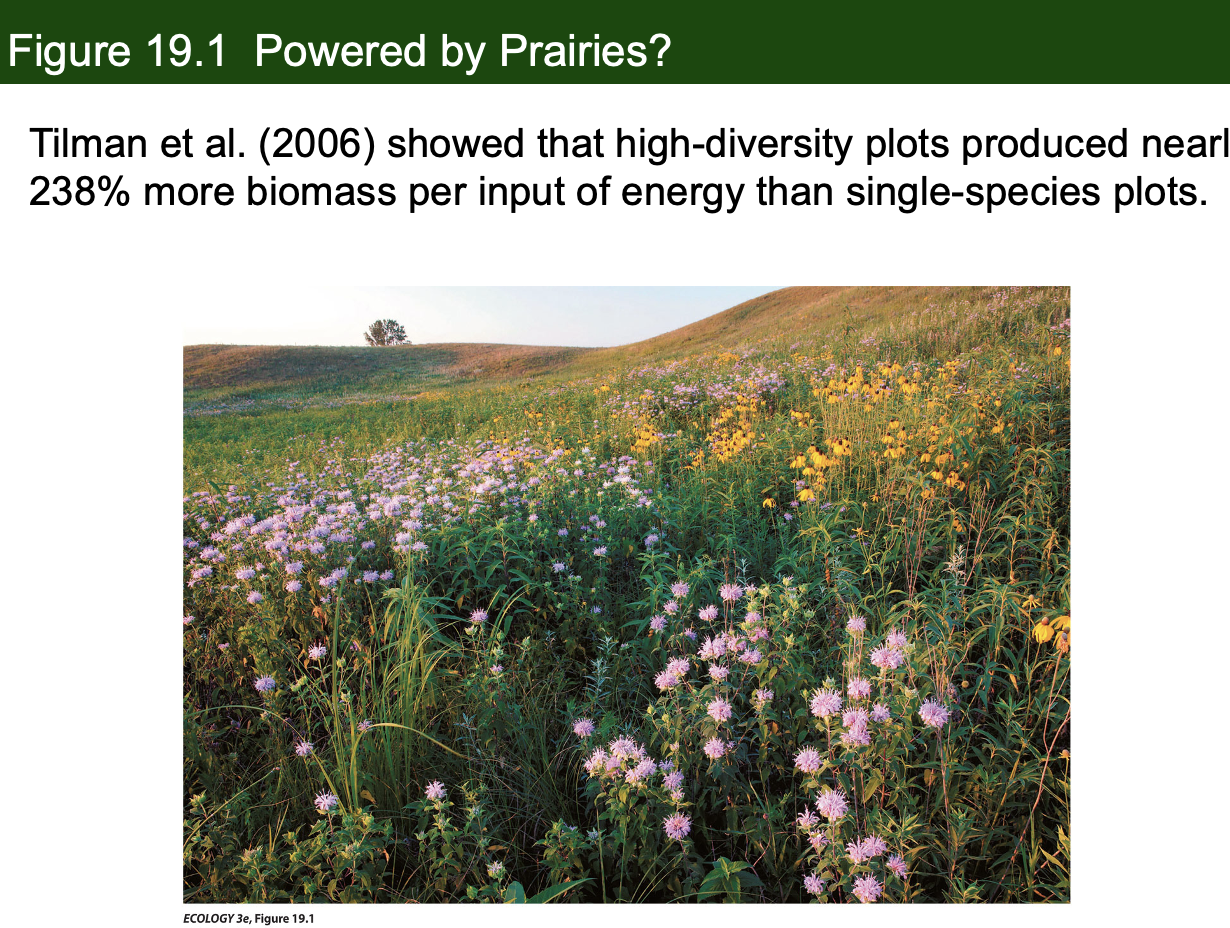
Figure 19.1- Tilman Powered By Prairies
What did Tilman et al. (2006) find regarding the effect of species diversity on ecosystem productivity
Tilman et al. (2006) found that high-diversity prairie plots produced nearly 238% more biomass per input of energy than single-species plots.
This shows a strong positive relationship between species richness and ecosystem function—specifically, energy efficiency in biomass production.
This result is quantitative evidence that:
Ecosystems with greater species diversity are more efficient at converting energy into biomass.
Diverse communities use resources more completely, due to complementarity (i.e., species differ in how they acquire and use resources, leading to synergy).
Can Species Diversity Suppress Human Diseases?
Zoonotic diseases are hosted by wildlife and are infectious to humans.
Many have emerged recently, including hantavirus (SNV), Zika virus, Ebola, avian influenza, and SARS-CoV2 (COVID-19).
Factors that affect emergence are complex but may include climate change, species invasions, pollution, and land use conversion.
Declining species diversity may also facilitate…
emergence and transmission of zoonotic diseases.
Increased hantavirus SNV infections in deer mice have been correlated with…
decreases in small mammal diversity.
Experimentally reducing small mammal diversity increased…
rodent hosts, and number of hantavirus infections.
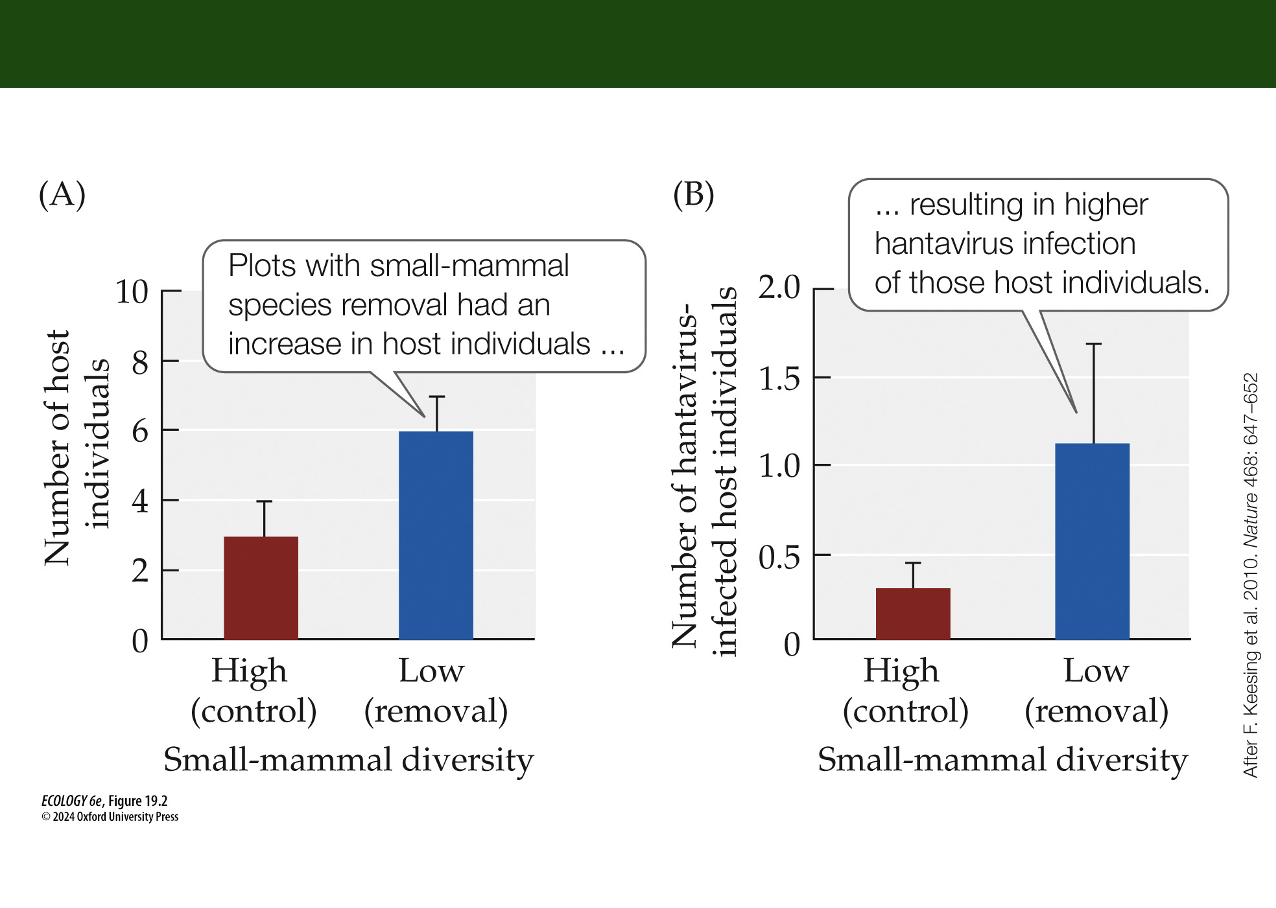
FIGURE 19.2 – Suzan Disease Transmission Increased with Species Diversity Loss
Experimental Components
Gerardo Suzan et al. (2009) conducted a controlled field study in Panama.
They removed small-mammal species that do not host hantavirus, creating low-diversity plots.
Control plots retained natural high diversity.
They measured:
Abundance of deer mice (hantavirus hosts)
Hantavirus infection rates in those hosts
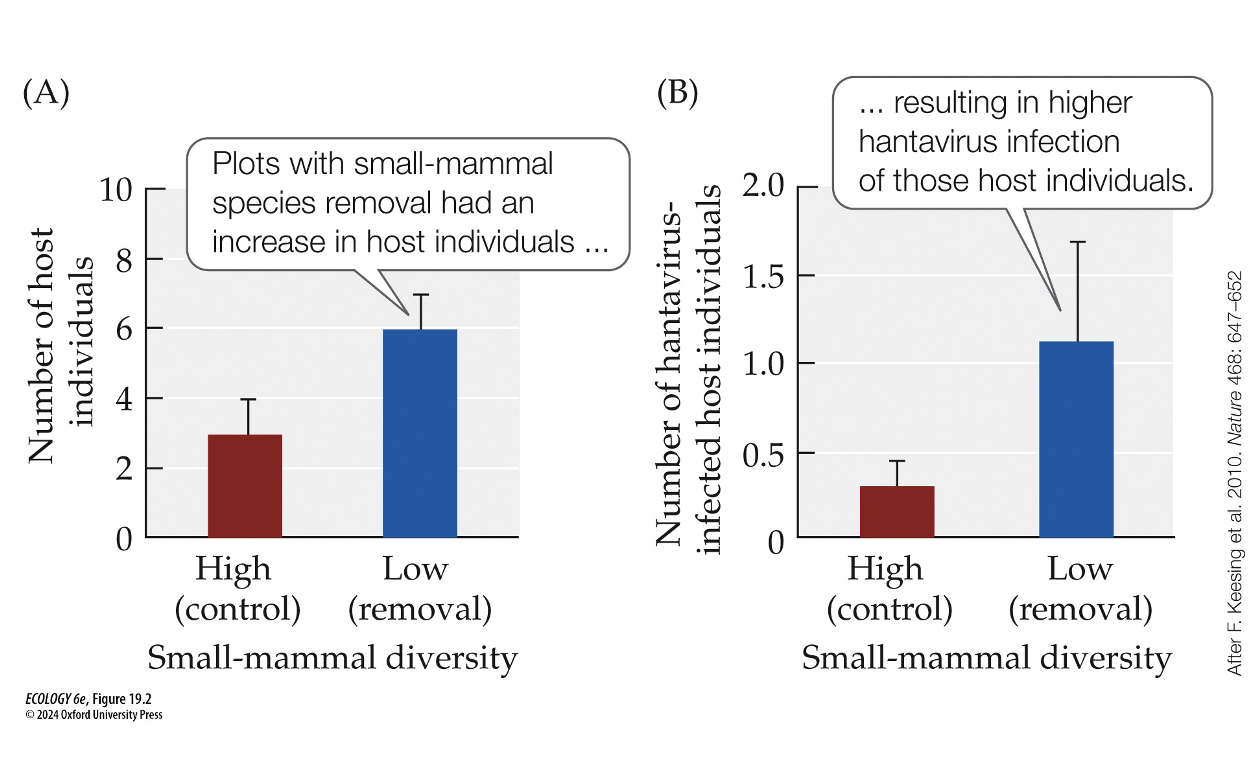
FIGURE 19.2 – Suzan Disease Transmission Increased with Species Diversity Loss
What evidence shows that reducing small-mammal diversity increases hantavirus transmission?
Low diversity leads to more host individuals and higher hantavirus infection rates, suggesting biodiversity acts as a buffer against disease emergence.
Membership in a community depends on…
Regional Species Pool:
Dispersal and Immigration
Environmental Conditions
Species Interactions (Local Communities)
Key drivers of species diversity variation among communities
Regional Species Pool→ Sets the upper limit of species available
Abiotic Conditions→ Temp, salinity, light, etc filter species
Species Interactions→ Competition, mutualism, predation, etc further filter community members
The regional species pool provides…
An upper limit on the number and types of species that can be present in a community.
The importance of dispersal can be seen in cases of …
non-native species invasions.
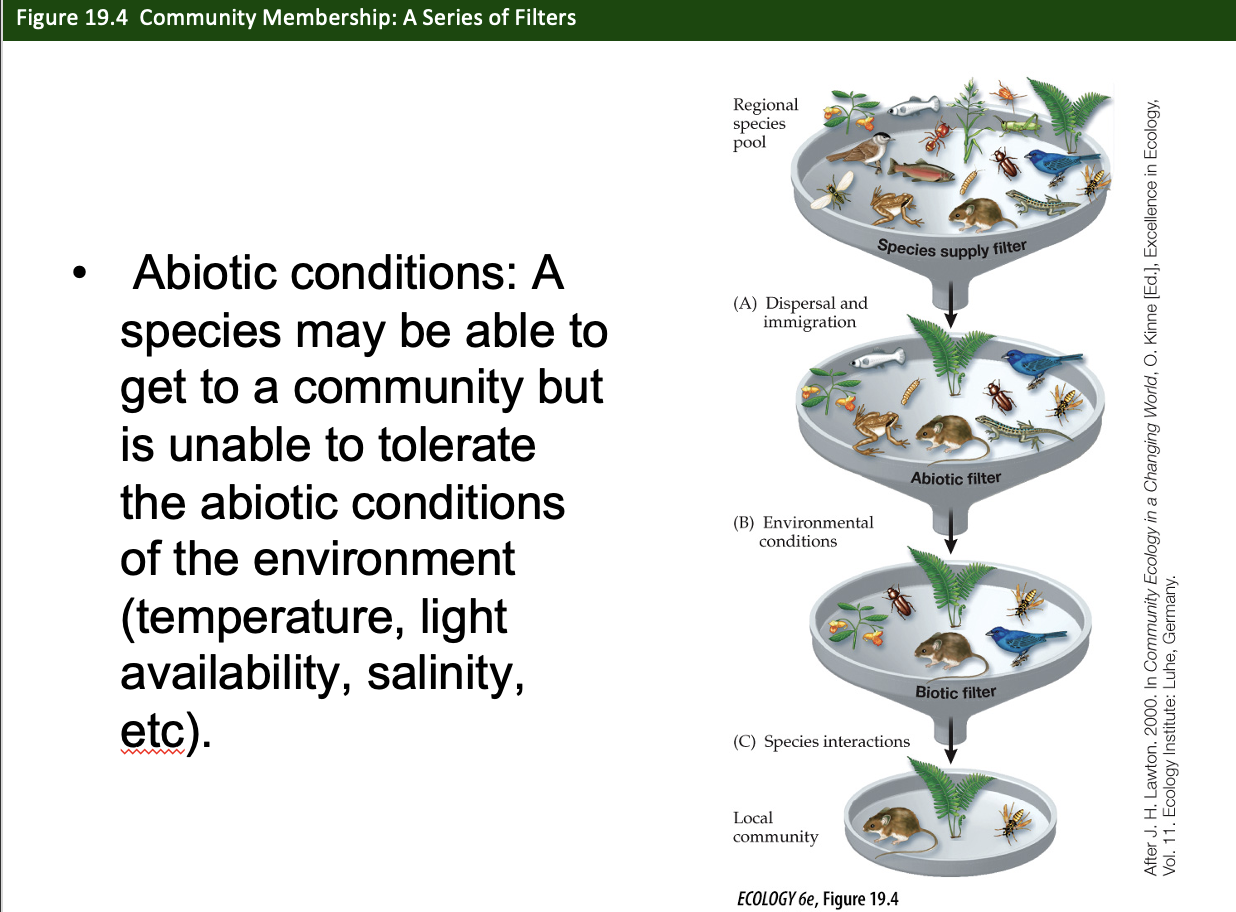
Abiotic Conditions
A species may be able to get to a community but is unable to tolerate the abiotic conditions of the environment (temperature, light availability, salinity, etc).
Species Interactions
Coexistence with other species is also required for community membership
Other species may be required for growth, reproduction, or survival.
Species may be excluded by competition, predation, parasitism, or disease.
Biotic Resistance
Biotic Resistance
occurs when interactions with the native species exclude the invader
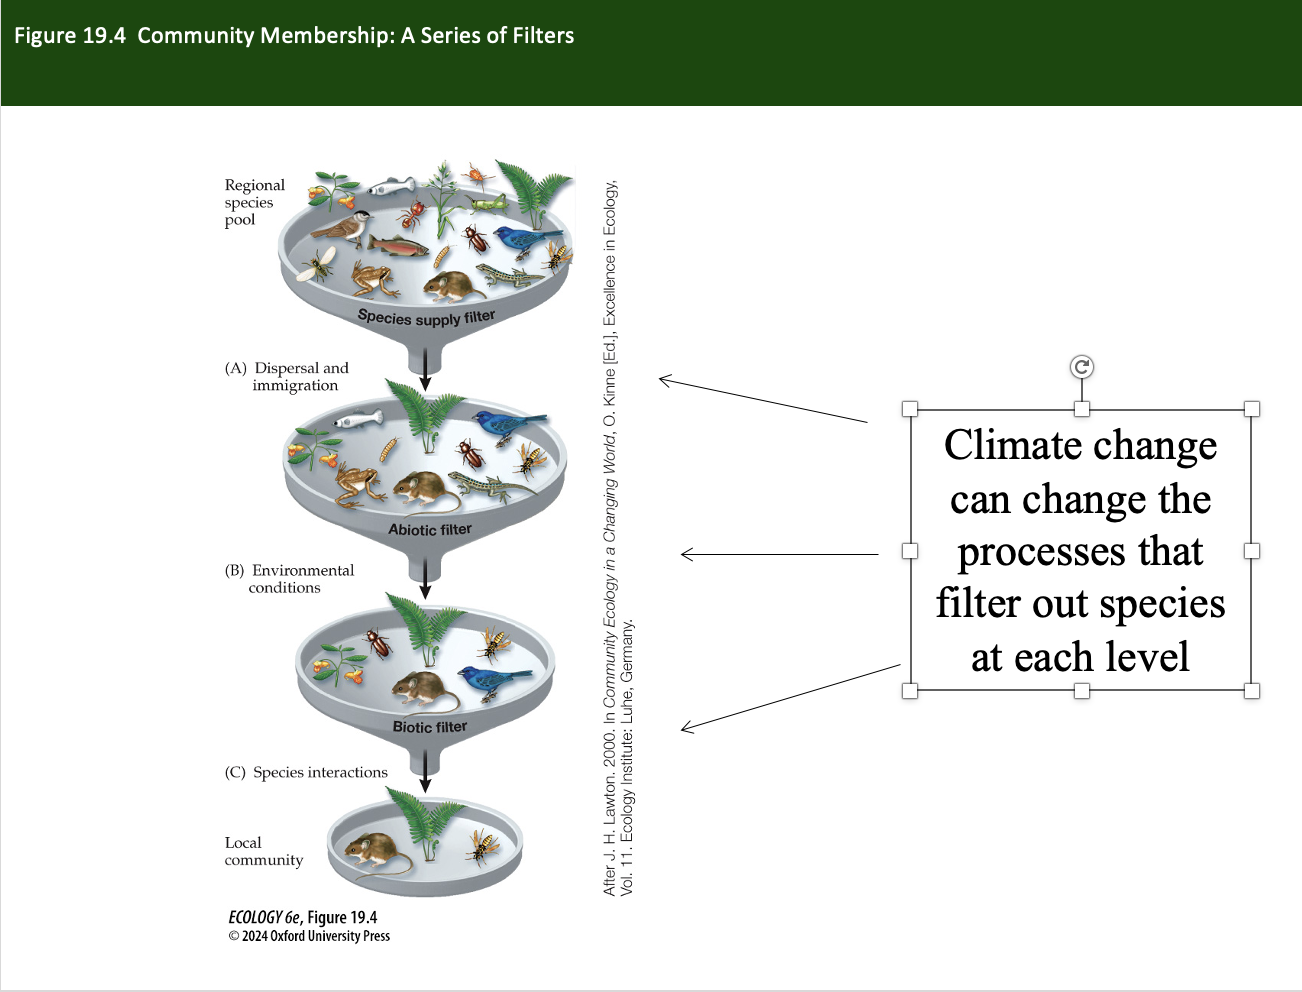
Climate Change can change the processes that…
filter out species at each level
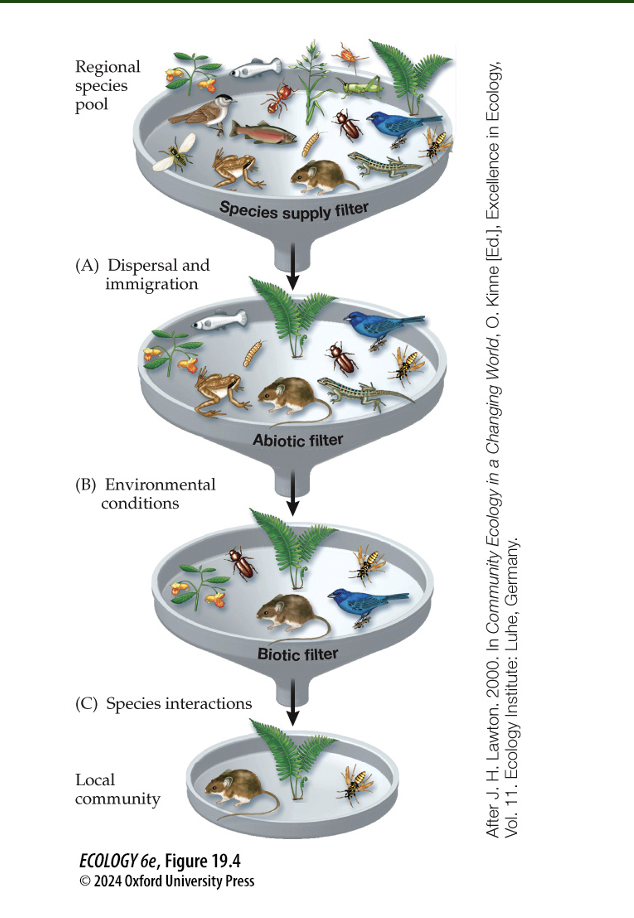
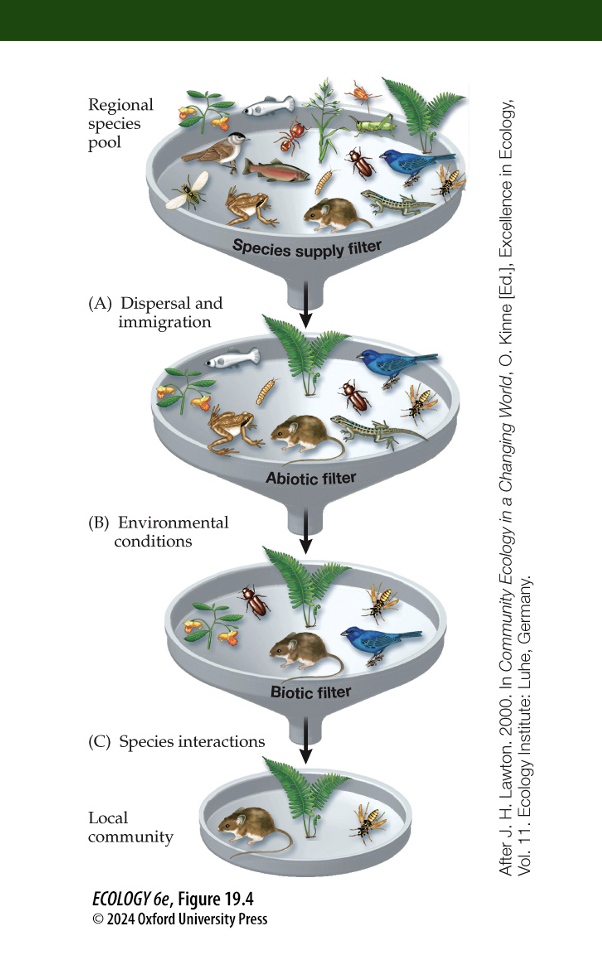
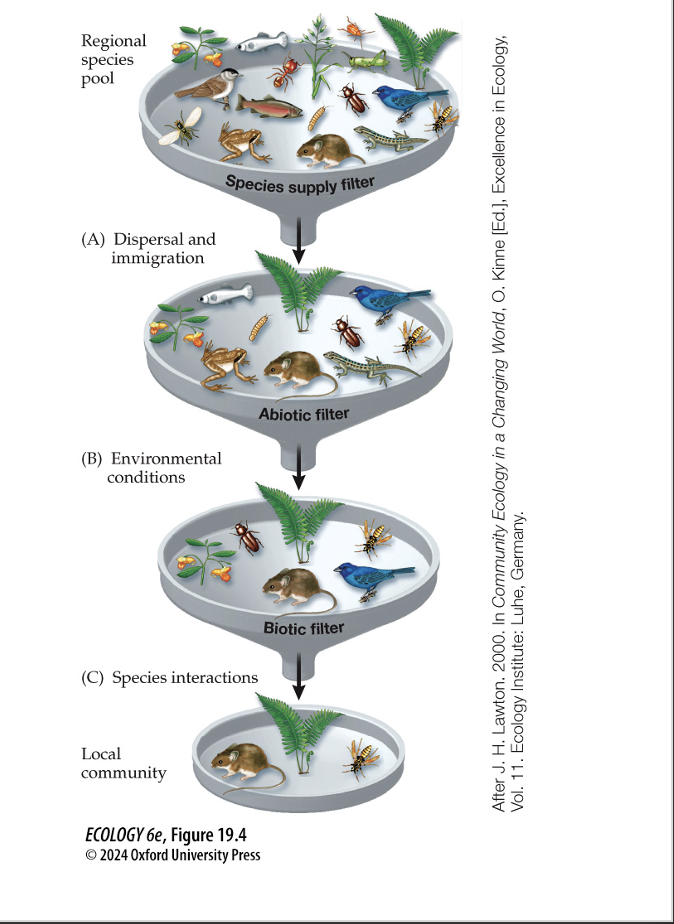
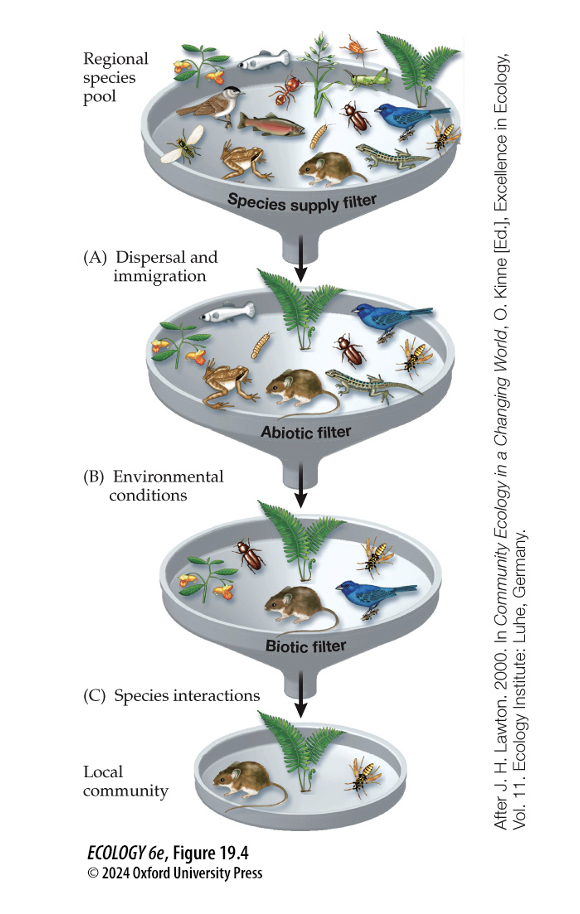
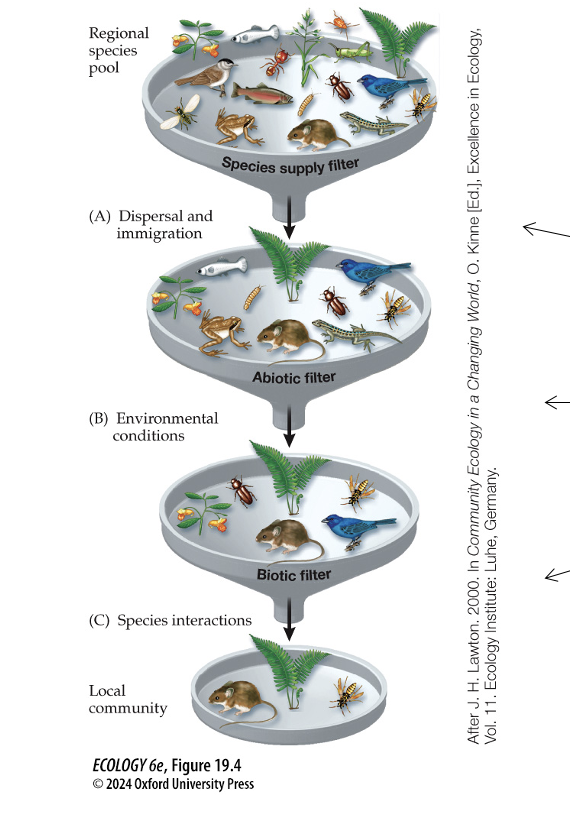
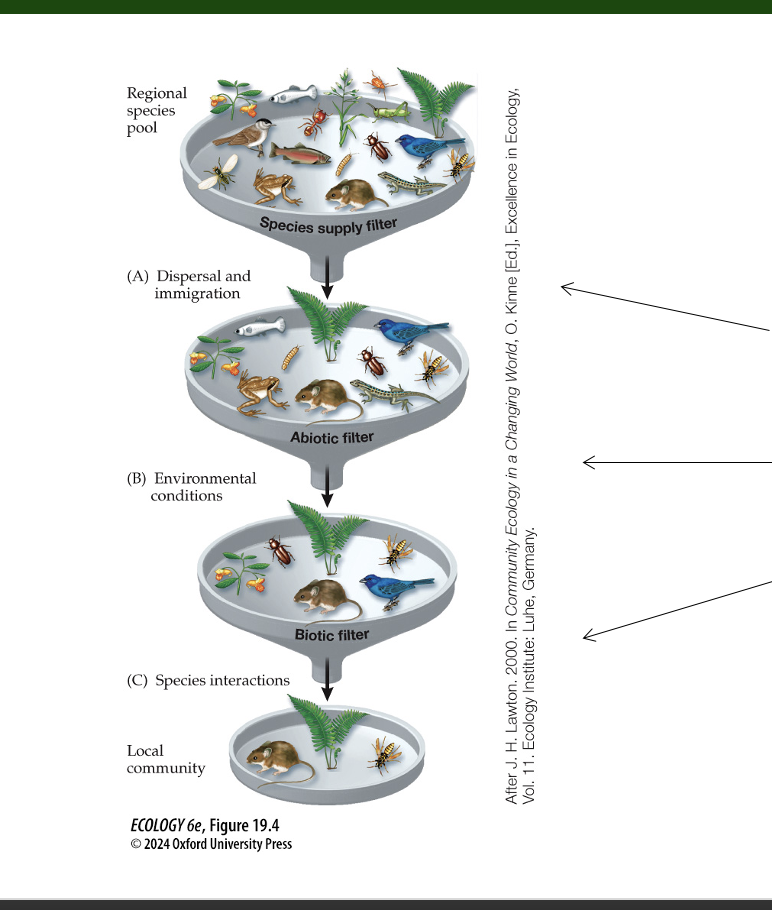
Figure 19.4 – Community Membership: A Series of Filters
What are the three filters that determine community membership and how do they operate?
We can think of these three factors as ‘filters’ that act to exclude species from (or include them in) particular communities
It illustrates how species from a regional pool become members of a local community via three filters:
Species Supply Filter (Dispersal ability): Can they reach the area?
Abiotic conditions Filter (Tolerance of environment): Can they tolerate conditions like salinity, light, temp?
Biotic interactions Filter (Coexistence with other species): Can they survive competition/predation/disease?
Only a subset of regional species makes it into the local community.
Species like fish and frogs in the figure do not make it past abiotic or biotic filters in this scenario.
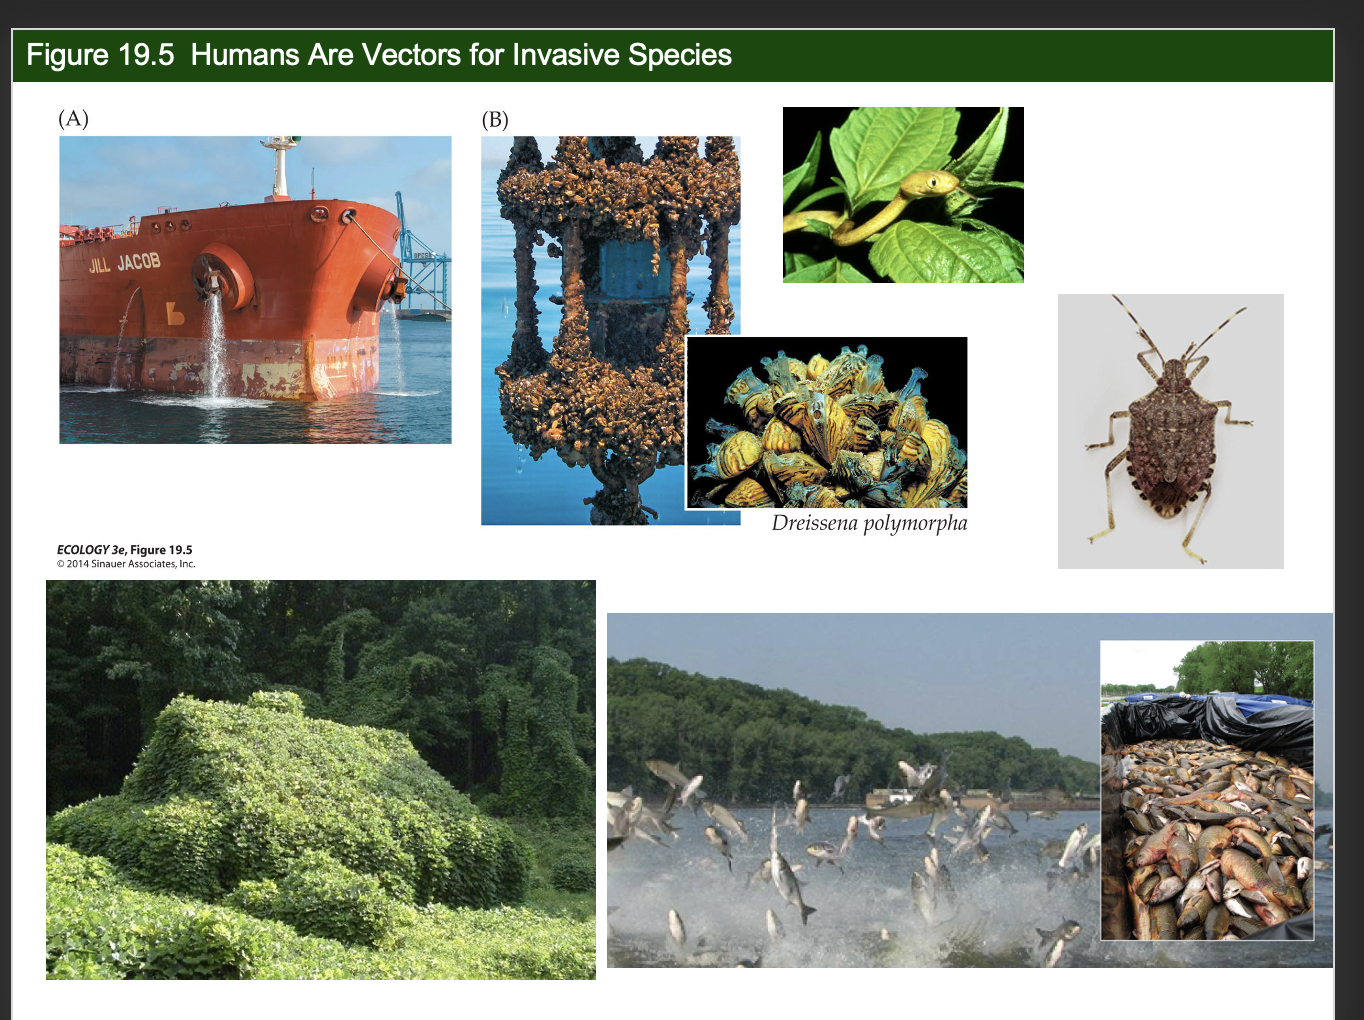
Figure 19.5 – Humans Are Vectors for Invasive Species
What does Figure 19.5 show about the role of humans in species invasions?
Ballast water in cargo ships unintentionally moves marine organisms globally.
Zebra mussels became invasive in U.S. waters after accidently being carried there from Russia in Ballast water, outcompeting native species and clogging pipes, disrupting ecosystems.
Ships move species via ballast water, allowing invasive species like zebra mussels to bypass natural filters and colonize new ecosystems.
Hellman’s Five climate-related consequences for species invasions
Δ Pathways (e.g., current changes)
Δ Environmental Constraints (e.g., warming tolerances)
Δ Distributions (range shifts)
Δ Impacts (altered ecological effects)
Δ Management Effectiveness
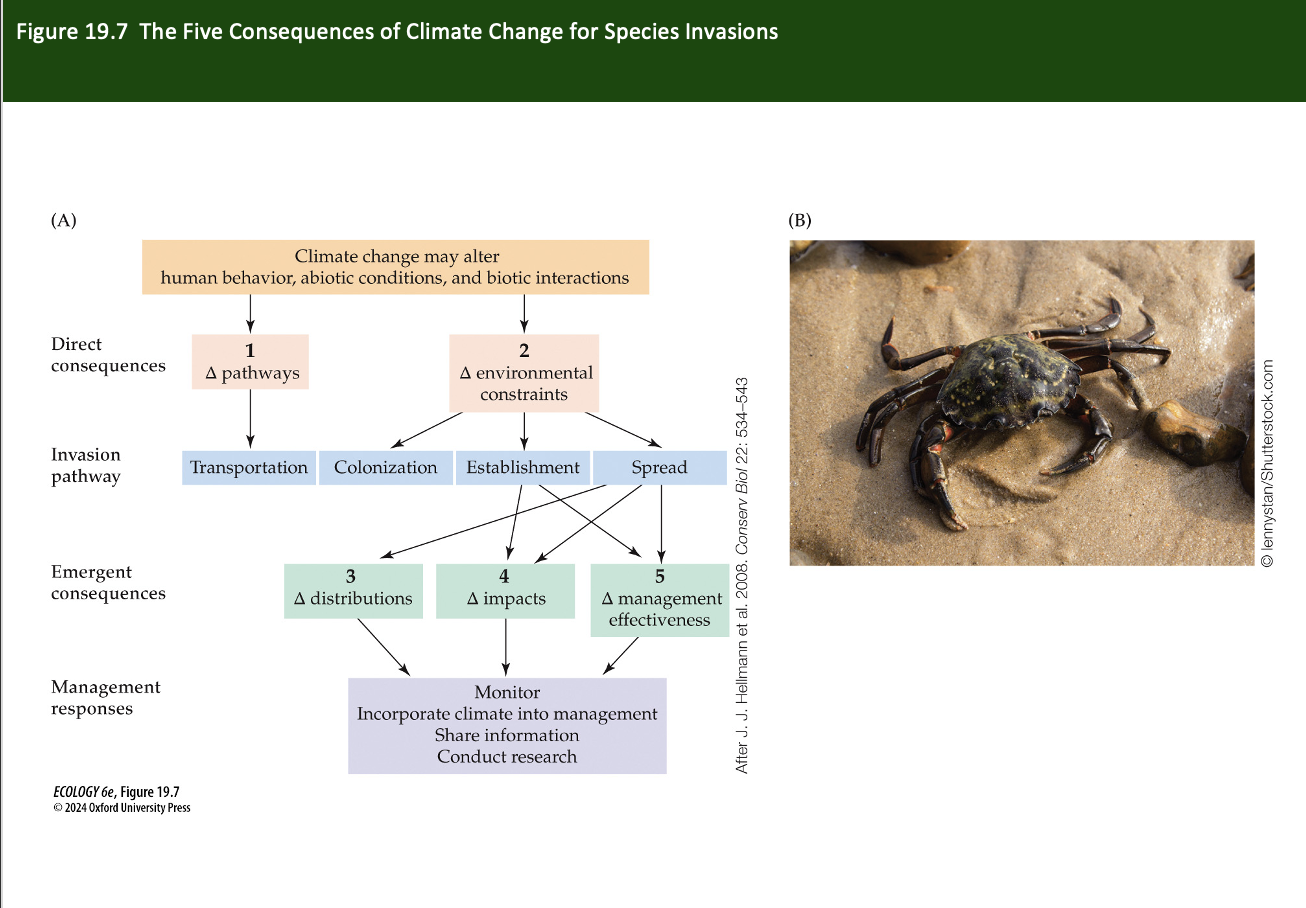
Figure 19.7- Hellman and Sylvia Behrens Yamada Five Consequences of Climate Change for Species Invasions
What does this figure show?
Climate change:
Alters ocean currents and temperature, aiding crab larvae dispersal
Allows green crabs to survive in areas once too cold
Enhances reproduction and impacts on native species
Shows how climate acts on all stages of invasion—from arrival to control.
Demonstrates how climate change can amplify invasions and make management harder.
Climate change affects all phases of invasion—altering dispersal, survival, impact, and management—illustrated by the green crab's spread due to warming waters.
Concept 19.2- Resource partitioning is theorized to…
reduce competition and increase species diversity.
Resource partitioning
Competing species are more likely to coexist if they use resources in different ways such as utilizing different parts of a resource spectrum (e.g., prey size, nutrients, or habitat)—allowing them to coexist with reduced direct competition.
We can think of each type of resource as varying along a…
“resource spectrum,” representing different nutrients, prey sizes, habitat types, etc.
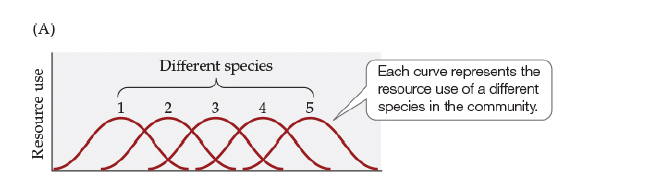
J. Hill and R. Hill.- What does Figure 19.8A illustrate about species resource use?
In a simple model, each species’ resource use falls on a spectrum of available resources.
It shows how species can overlap in their use of a shared resource spectrum; less overlap means more resource partitioning and weaker competition, promoting coexistence.
The greater the overlap of resource use, the more competition between species.
More species can be “packed” into a community if overlap is small.
Or, if the resource spectrum is broad, a diversity of resources would be available for use by a wide variety of species.
Think of a spectrum of prey sizes from small to large. If species A and B both feed on medium-sized prey, their niches overlap → high competition. But if A specializes on small prey and B on large prey, there's less overlap → less competition and better coexistence.
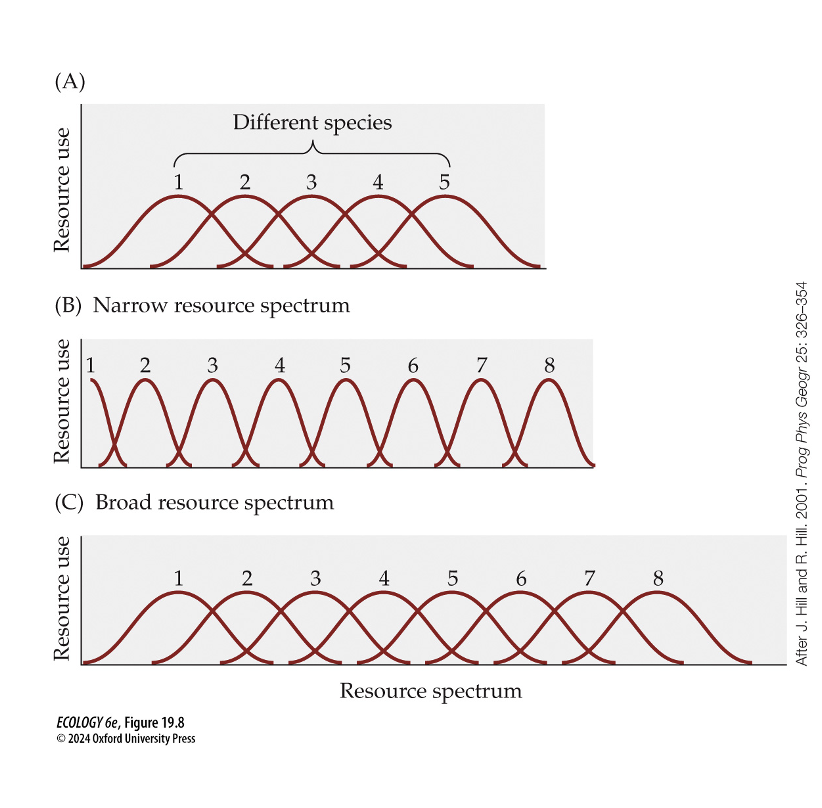
What is the difference between Figures 19.8B and 19.8C (J. Hill and R. Hill)?
Figure 19.8B shows more species packed along a narrow resource spectrum with minimal overlap, while Figure 19.8C shows a broader resource spectrum supporting high species richness due to a greater diversity of available resources.
In this example, you need more types of resources (indicated by the longer x-axis) to support the same number of species when there is considerable overlap between resource use
Two ways to support more species:
Narrow spectrum, low overlap → species are highly specialized.
Wide spectrum, some overlap → more total resources, so even generalists can coexist.
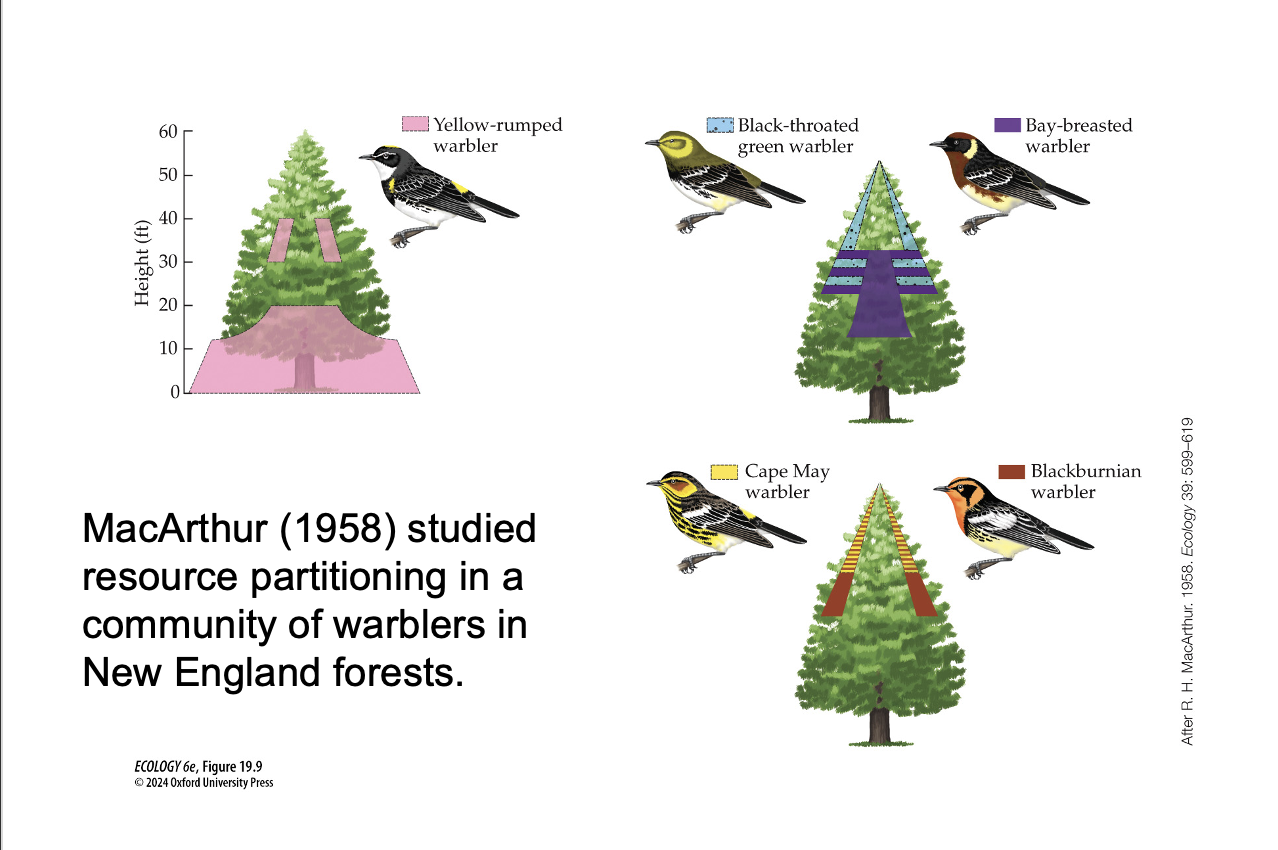
How did MacArthur’s warbler study (Figure 19.9) demonstrate resource partitioning?
MacArthur (1958) studied resource partitioning in a community of warblers in New England forests.
MacArthur observed that five warbler species foraged in different parts of the tree canopy, used different nesting heights, and maintained separate territories, showing how subtle habitat differentiation enabled their coexistence.
This classic study showed that species could partition a single resource (insects in tree canopies) by using different parts of that resource. MacArthur’s observations laid the foundation for understanding how small behavioral differences can allow biodiversity to persist.
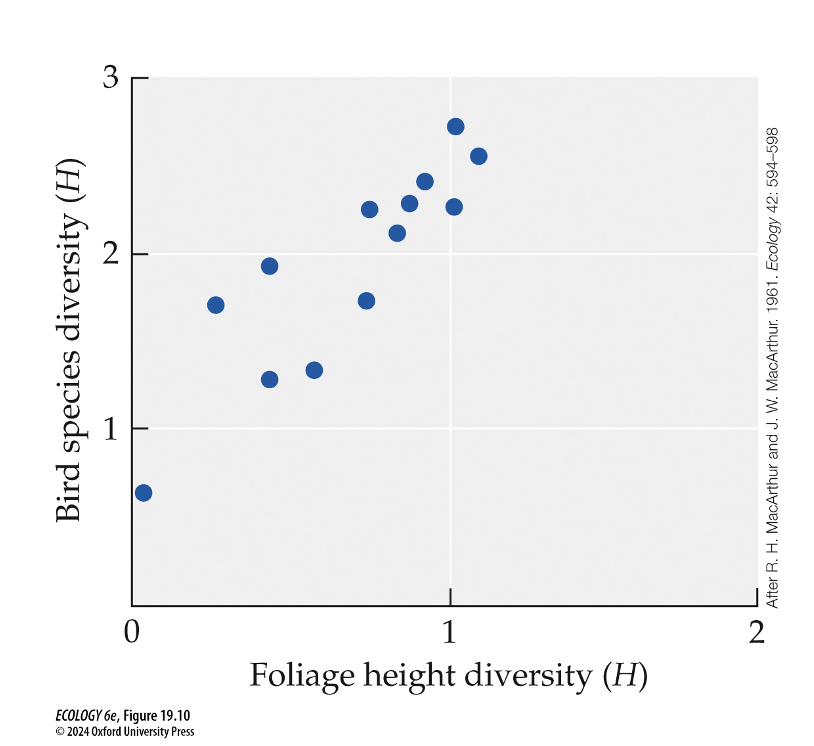
What does Figure 19.10 (MacArthur Study) tell us about habitat complexity and bird diversity?
MacArthur and MacArthur (1961) looked at bird communities in 13 different habitats.
Species diversity increased with foliage height diversity (a proxy for the width of the resource spectrum)
Tree species identity was less important than structural complexity of the habitat.
It shows a positive correlation between bird species diversity and foliage height diversity, suggesting that more structurally complex habitats allow more niche space and higher species richness.
Rather than the identity of trees, it's the structure of the habitat (layers, depth) that matters. This supports the idea that physical heterogeneity promotes resource partitioning by creating more niches.
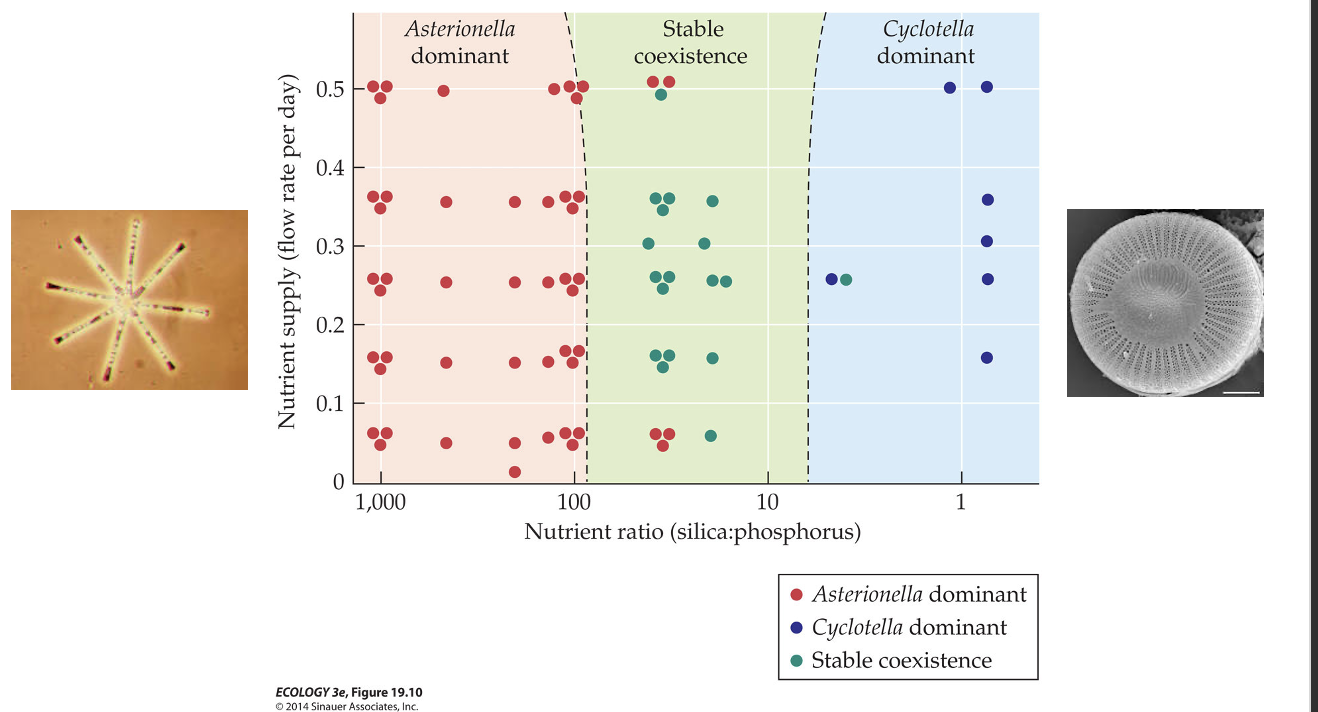
What is the resource ratio hypothesis proposed by Tilman (1977)?
Experimental Design
Species of diatoms can coexist by using resources in different proportions (Tilman 1977).
It states that species can coexist by using the same limiting resources in different proportions.
Tilman's experiments with diatoms showed that species could coexist only at intermediate silica:phosphorus ratios.
What is the resource ratio hypothesis proposed by Tilman (1977)?
Results
Even though both species needed the same nutrients, their requirements differed. One thrived when silica was limiting; the other when phosphorus was. In environments with intermediate ratios, neither had a full advantage → coexistence occurred.
Figure 19.11- Robertson et al. (1988) looked at the spatial variability of soil resources (N, water)
Experiment
🔬 Purpose of the Experiment
To map and quantify the spatial heterogeneity of two critical soil resources:
Nitrate (NO₃⁻) — a key nutrient for plant growth
Soil moisture — essential for nutrient uptake and survival
The researchers sampled across a 69m × 69m field site to see how these resources vary across the landscape.
📊 Panel A – Soil Nitrogen (NO₃⁻) Concentrations
Darker brown areas = higher nitrate concentrations (≥ 8.9 µg/cm²)
Lighter tan areas = lower nitrate concentrations (0.5–3.8 µg/cm²)
Conclusion: Nitrate is patchily distributed, with high and low areas forming irregular patterns.
Panel B – Soil Moisture
Darker blue = wetter soil (≥ 1.06 µg/cm²)
Pale blue and patterned areas = drier soil (0.10–0.75 µg/cm²)
Conclusion: Moisture is also patchy, but the pattern differs from nitrate distribution.
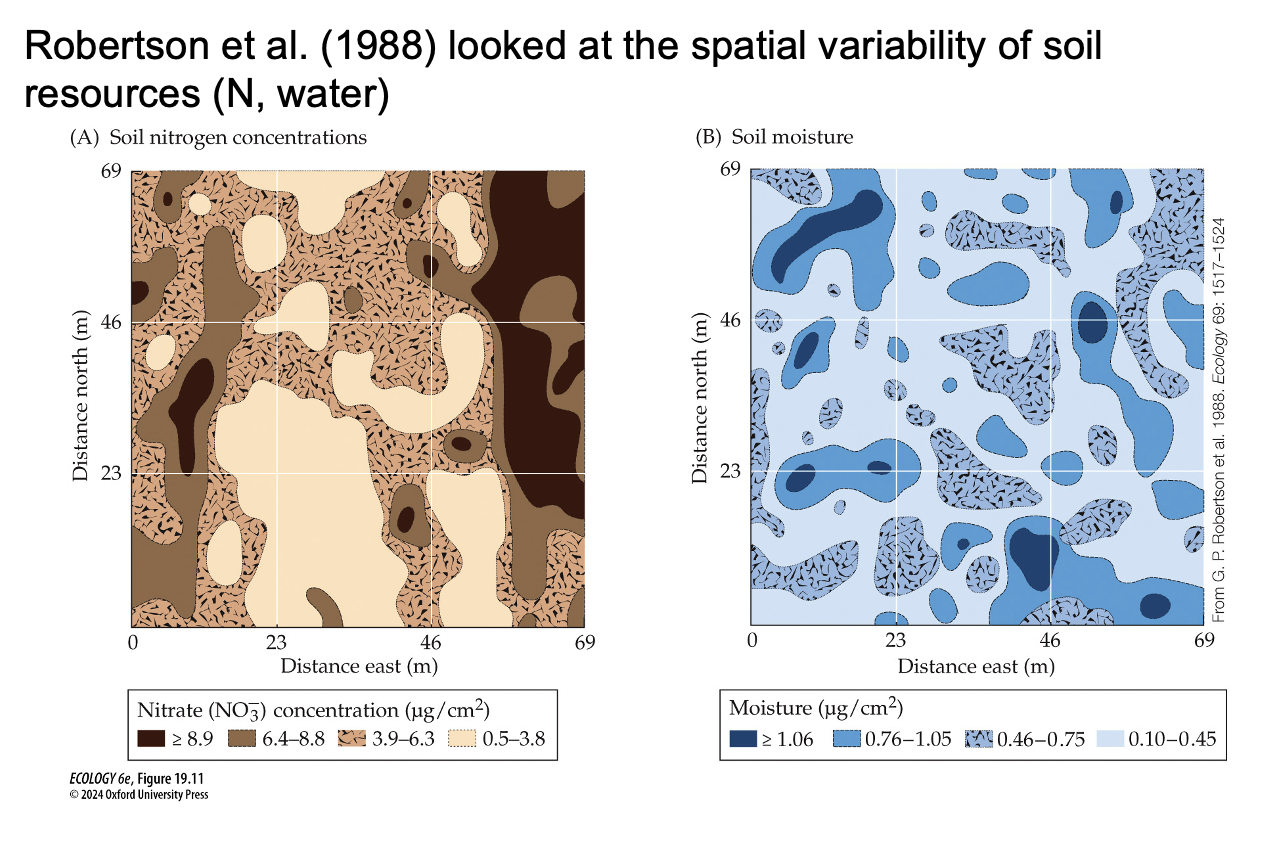
What does Figure 19.11- Spatial Resource Heterogeneity reveal about resource distribution in plant communities?(Robertson et al. (1988) looked at the spatial variability of soil resources (N, water))
This supports real-world applicability of Tilman’s lab findings. In nature, resources are rarely uniform. Variation allows species to specialize in different spots, reducing competition and supporting higher diversity.
They showed that soil nitrate (NO₃⁻) and moisture are spatially variable, even over small areas. This heterogeneity in resource distribution creates diverse microhabitats, promoting species coexistence and higher diversity by allowing species to specialize in different resource patches.
How does a broader resource spectrum increase species richness?
It increases the number of resource types available (e.g., more prey sizes, more nutrients, more light levels), which means more niches are available for different species to exploit. This allows for greater species packing
(Think of a food court. If it only serves pizza, only a few types of customers can be satisfied. But if it offers pizza, sushi, tacos, and salads, more people with different preferences can coexist. The same is true for species.)
Why does structural habitat complexity matter for species coexistence?
Because it increases the diversity of niches (e.g., vertical zones in vegetation), reducing direct competition and supporting more species
Concept 19.3- Processes such as disturbance, stress, predation, and positive interactions can mediate…
Resource availability, thus promoting species coexistence and species diversity.
What does Concept 19.3 state about species diversity?
Processes like disturbance, stress, predation, and positive interactions modify resource availability, allowing more species to coexist, which increases species diversity. These factors can prevent competitive exclusion by dominant species.
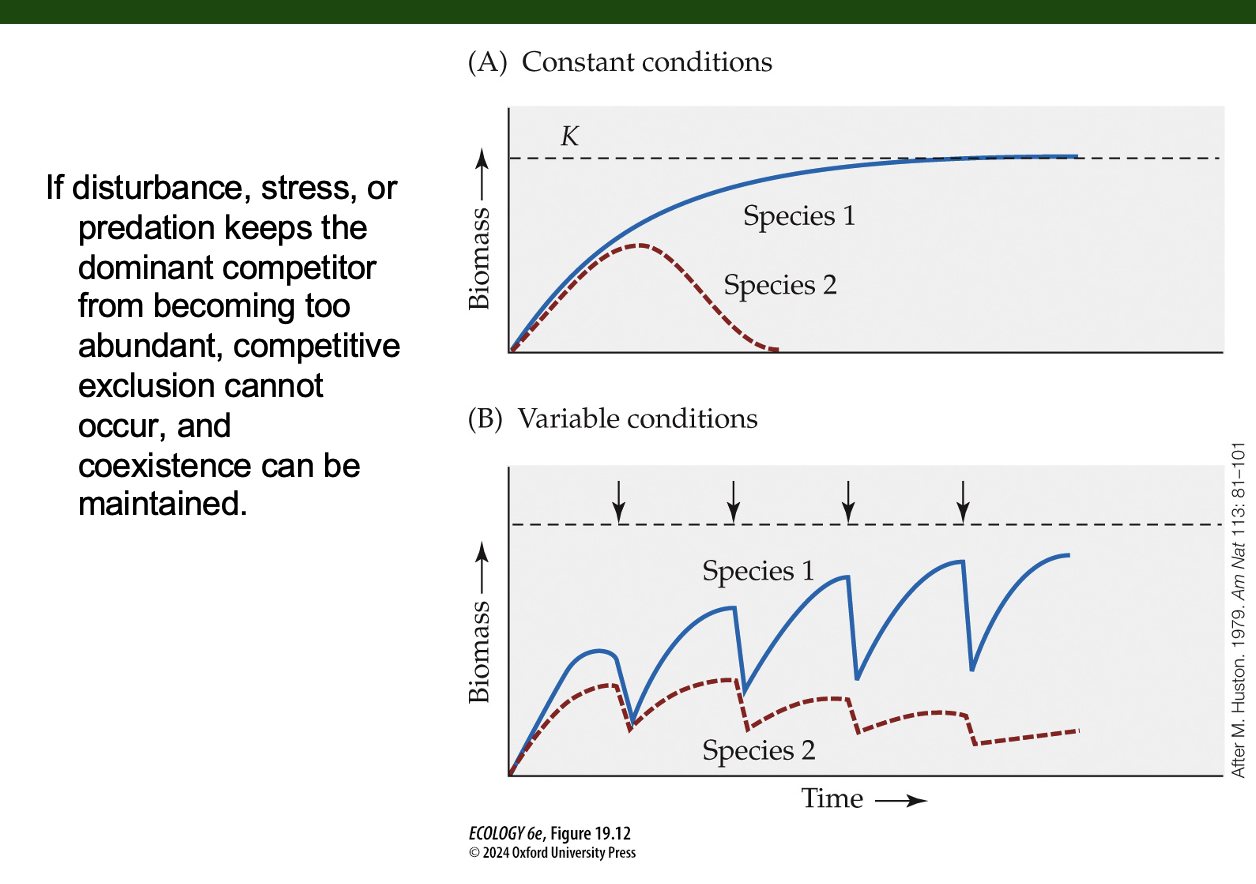
What does Figure 19.12 show about competition and disturbance?
(A) In undisturbed environments, the dominant species reaches carrying capacity and excludes others.
(B) If disturbance, stress, or predation reduce the growth of the dominant, the weaker species can coexist. This demonstrates that variable environments promote coexistence.
If disturbance, stress, or predation keeps the dominant competitor from becoming too abundant, competitive exclusion cannot occur, and coexistence can be maintained.
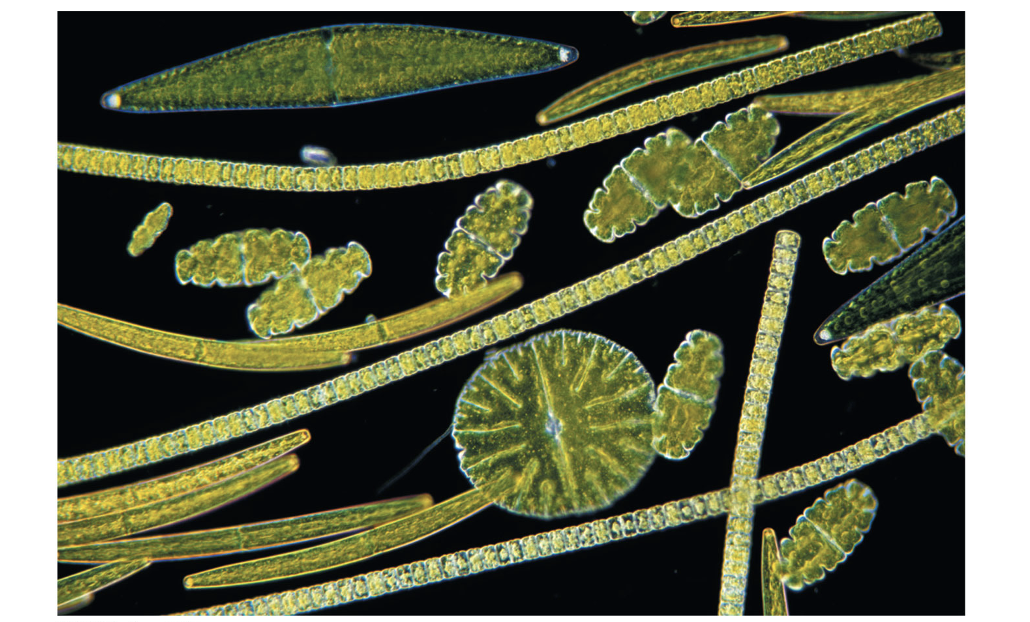
G. E. Hutchinson (1961) - the paradox of the plankton
Lake phytoplankton communities have very high species richness (30–40 species), all using the same limited resources, in a homogeneous environment
What ecological paradox did Hutchinson explore with phytoplankton (Figure 19.13)
Despite limited, uniform resources, 30–40 species coexist in lakes. Hutchinson proposed that fluctuating environmental conditions prevent exclusion of weaker competitors, allowing high diversity.
Hutchinson’s explanation was that conditions in the lake…
changed seasonally, which kept any one species from outcompeting the others.
2 components of Hutchinson’s model:
•tc – time required for one species to exclude another (depends on species growth rates)
•te– time it takes environmental variation (disturbances) to impact population growth
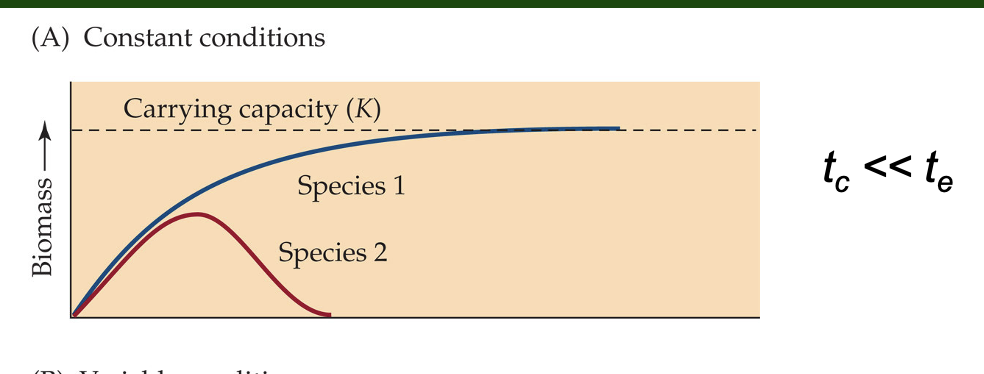
If tc << te, coexistence cannot be achieved.
•This could occur in environments with little variability or if the dominant species had very fast growth rates.
In a fluctuating environment, tc >> te,
only a few species can tolerate the fluctuations and are well adapted to it, and competitive exclusion can still occur.
Coexistence can occur only when…
tc = te
Explain Hutchinson’s model using tc and te.
tc = time for competitive exclusion,
te = time for environmental change.
When tc ≈ te (time for exclusion is about the same as time for environmental change):
Species coexist because before any one species can dominate through competition, the environment changes, shifting the advantage to another species. This balance prevents long-term dominance.
If tc << te (competitive exclusion happens much faster than the environment changes):
Exclusion occurs, because one species quickly outcompetes the others and takes over before the environment can shift and give others a chance.
If tc >> te (competitive exclusion takes much longer than environmental change):
Competition still dominates, because the frequent changes prevent any single species from consistently benefiting. This unpredictability means species that can tolerate variation are favored, but dominance still arises in some form due to consistent competitive advantages.
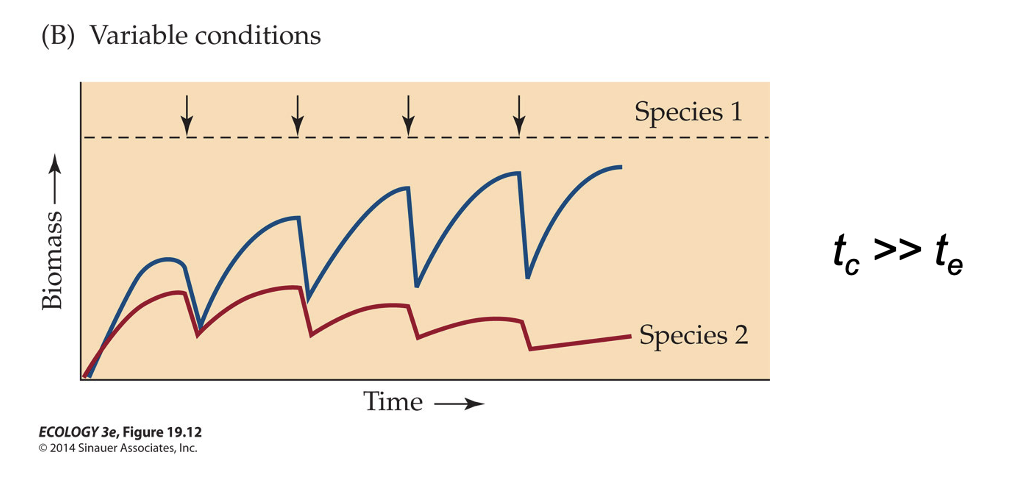
Intermediate disturbance hypothesis (Connell 1978)
species diversity will be greatest at intermediate levels of disturbance (Connell 1978)
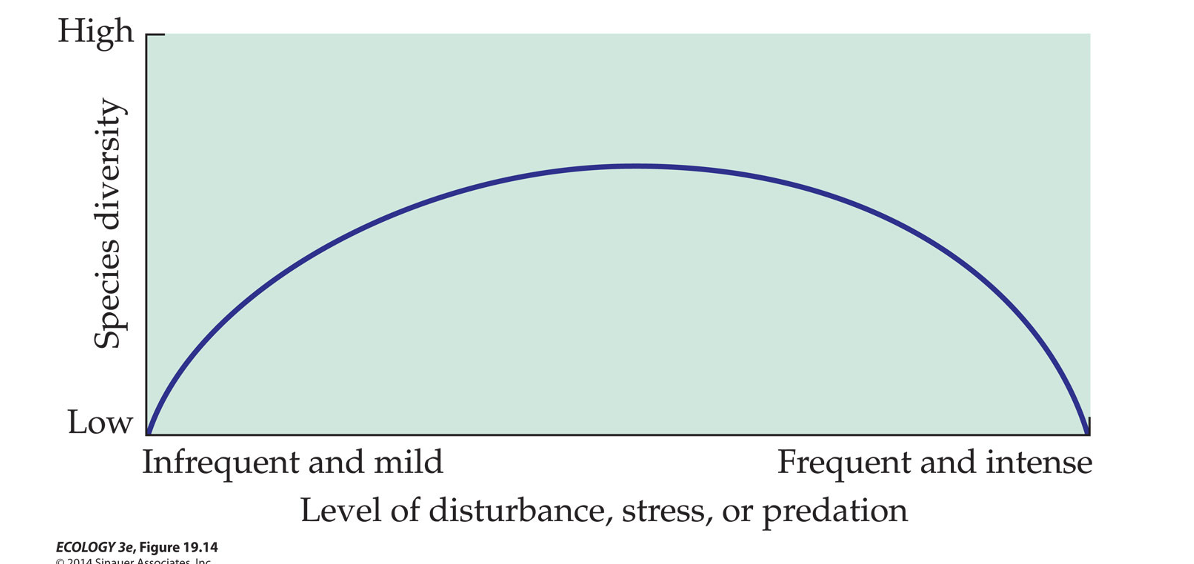
Explain Components' of Connell’s Intermediate disturbance hypothesis
At low levels of disturbance= competition regulates diversity.
At high disturbance levels= many species cannot survive
Low disturbance = exclusion by dominant species
high disturbance = high mortality; intermediate = balance promotes diversity.
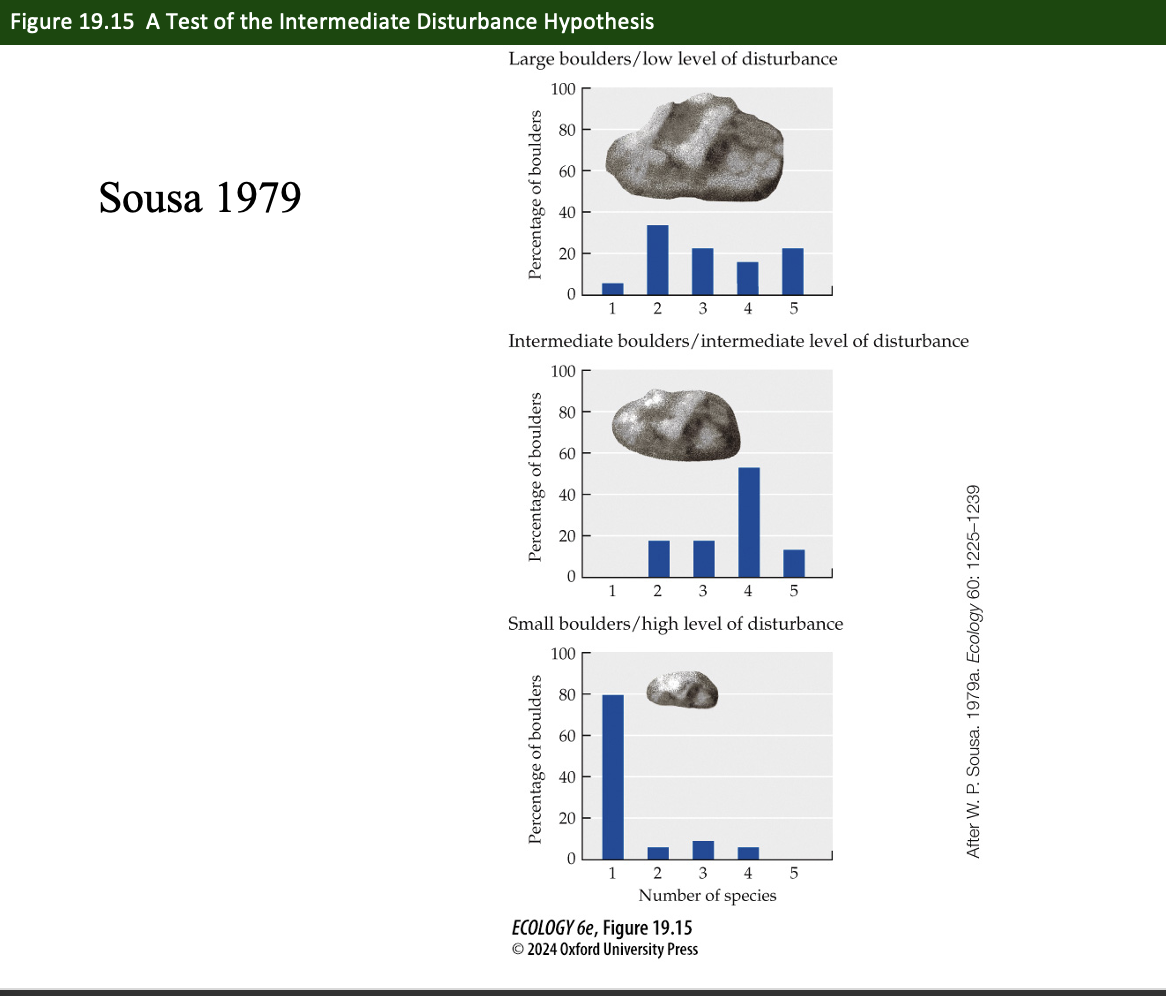
Figure 19.15- Sousa’s Boulder Field Study
Experiment
Goal: Test the intermediate disturbance hypothesis experimentally.
What was done: In California intertidal zones, Sousa measured boulder size (a proxy for disturbance):
Small boulders = frequently rolled → high disturbance
Large boulders = rarely moved → low disturbance
Medium boulders = intermediate disturbance
He recorded the number of species on each boulder type over 2 years.
Results:
Small boulders: 1–2 early successional species (e.g., Ulva)
Large boulders: 2 late successional species (e.g., Gigartina)
Intermediate boulders: Up to 7 species (mix of early, mid, late)
Interpretation: Intermediate disturbance = highest diversity, supporting Connell’s hypothesis (Figure 19.14).
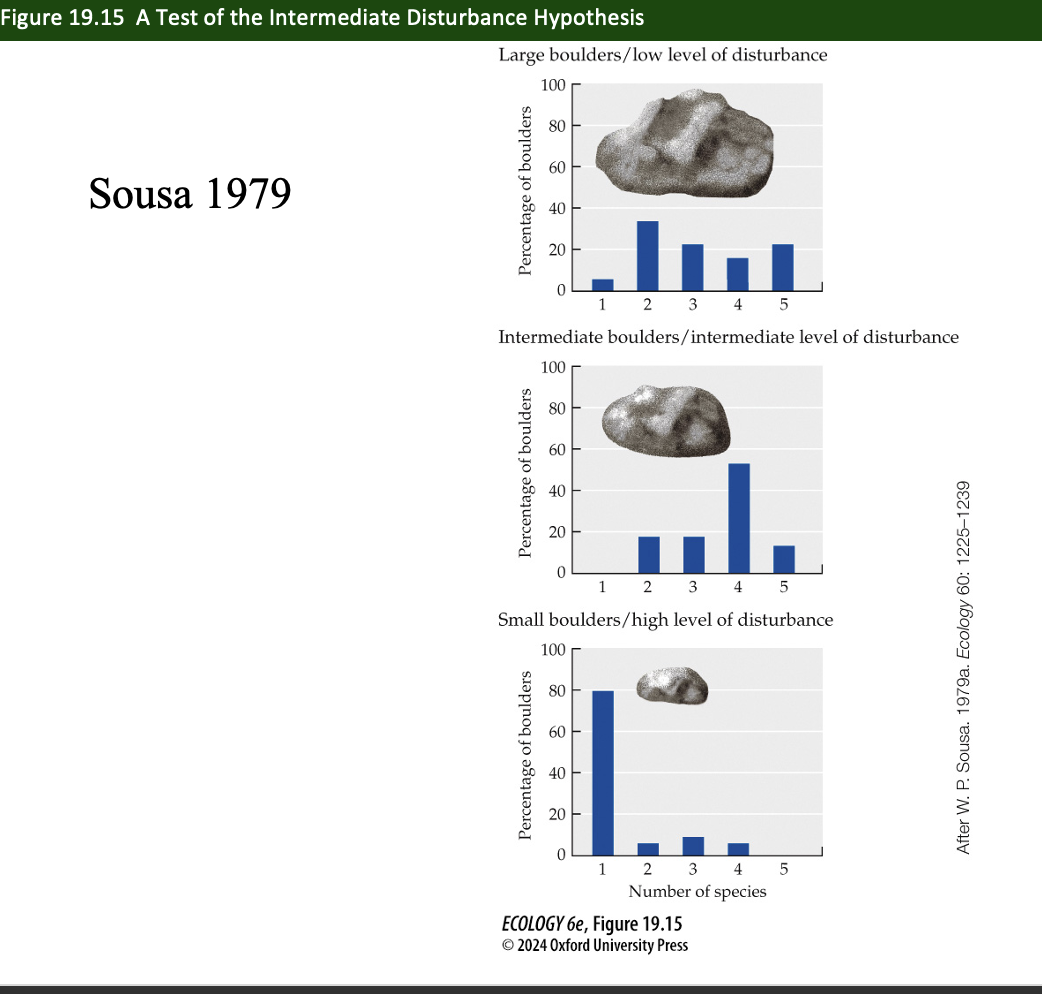
How did Sousa test the intermediate disturbance hypothesis (Figure 19.15)
On intertidal boulders:
Small boulders = high disturbance = few species
Large boulders = low disturbance = few late species
Intermediate boulders = most species (up to 7)
This supported the hypothesis that moderate disturbance maximizes species richness.
Huston (1979) added ? to the intermediate disturbance model
Competitive displacement
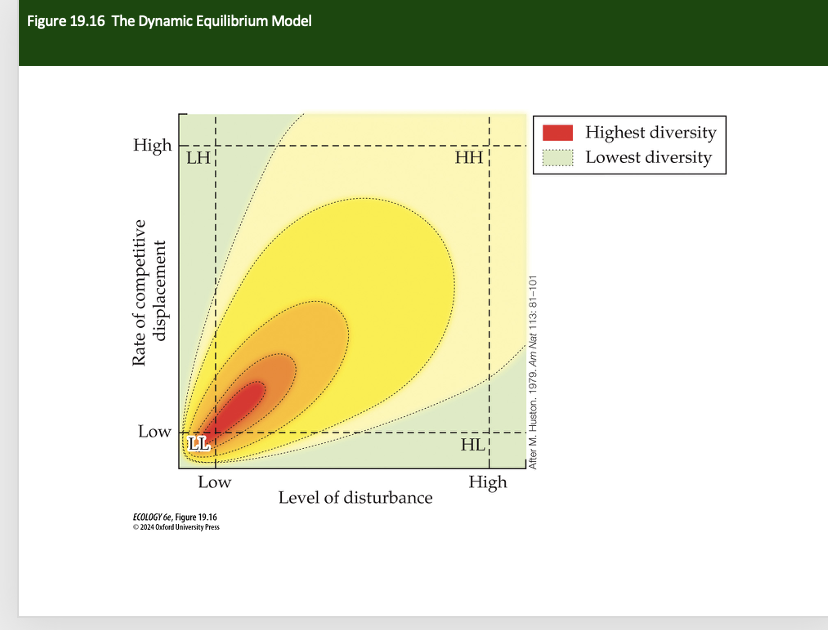
Huston’s Dynamic Equilibrium Model (Figure 19.16)
Goal: Add complexity to intermediate disturbance hypothesis by factoring in competitive displacement.
What was done: Theoretical model (no experiment). Huston predicted:
High diversity when disturbance and competition both at low-intermediate
Low diversity if either process dominates
Interpretation: Supports a balance between mortality (from disturbance) and competitive exclusion, explaining more real-world variation.
The best competitor uses the…
limiting resources, reducing the weaker competitor’s population growth to the point of extinction
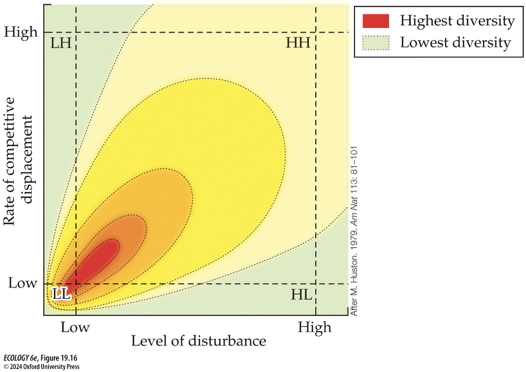
Huston’s dynamic equilibrium model…
combines disturbance frequency and rate of competitive displacement to determine species diversity.
Huston’s dynamic equilibrium model experiment
Experiment Type: Theoretical model.
What Was Done: Modeled how combinations of disturbance frequency and competitive displacement affect diversity.
Results:
Maximum diversity at intermediate levels of both disturbance and competition.
Low diversity when one dominates.

Huston’s dynamic equilibrium model experiment
Conclusion
Conclusion: Diversity is highest when disturbance and competition rates are balanced.

Explain Hacker & Gaines Salt Marsh Facilitation Experiments (Figures 19.17 & 19.18)
Experiment: Field transplant experiments in New England salt marsh.
What Was Done: Transplanted plant species across high, middle, and low intertidal zones with/without dominant species (Iva or Juncus).
Results:
High zone: Iva excluded other species.
Low zone: Stress led to high mortality regardless.
Middle zone: Juncus facilitated survival by reducing salt and hypoxia stress.
Conclusion of Hacker & Gaines Salt Marsh Facilitation Experiments (Figures 19.17 & 19.18)
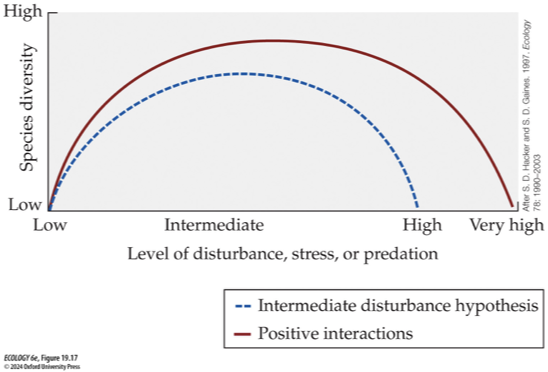
extension of the intermediate disturbance hypothesis, mutualisms and other positive interactions should promote species diversity, especially at high levels of disturbance
At high levels of disturbance, positive interactions should increase the survival of individuals of the interacting species, increasing diversity
At intermediate levels of disturbance, positive interactions should help release species from competition, increasing diversity.
At all levels of disturbance, positive interactions should lead to higher diversity than competitive interactions alone
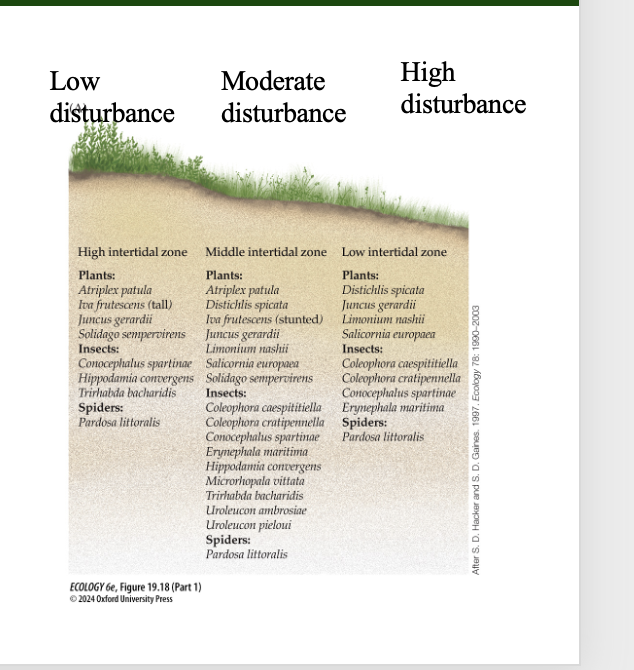
Hacker and Gaines tested this in a New England salt marsh:
Three intertidal zones were identified with different species composition.
The middle intertidal zone had greatest species richness
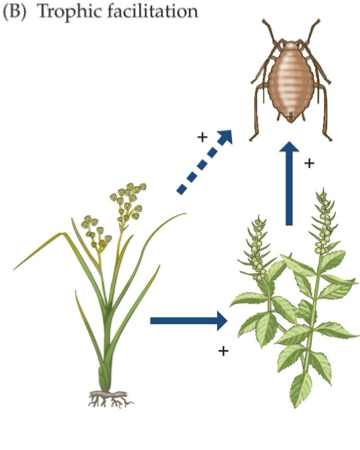
Juncus can facilitate Iva through…
shading, which keeps soil moist and reduces salt stress, and also by aerating the soil
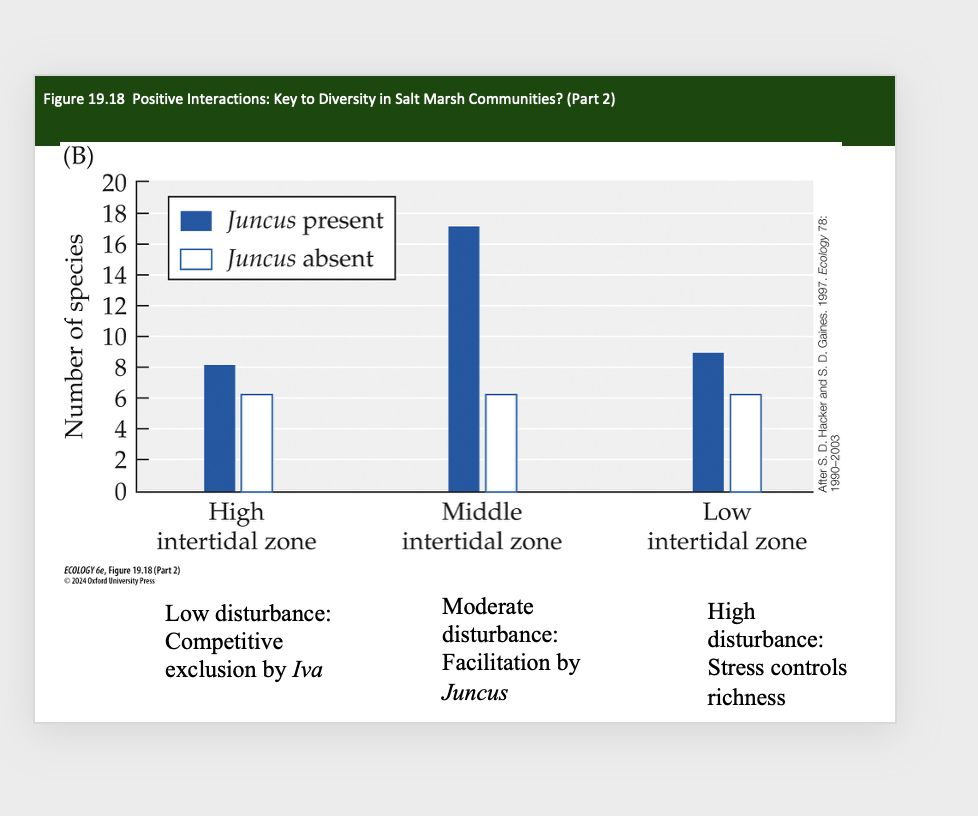
Figure 19.18 Positive Interactions: Key to Diversity in Salt Marsh Communities?
Surveys of plant and arthropod species diversity in a New England salt marsh show diversity to be greatest in the middle intertidal zone.
(B) Experiments suggest that the high diversity of plants and arthropods in this zone is controlled by the direct and indirect effects of the facilitating rush species Juncus gerardii as well as by a decrease in the effect of the dominant competitor, Iva frutescens, due to physical stress.
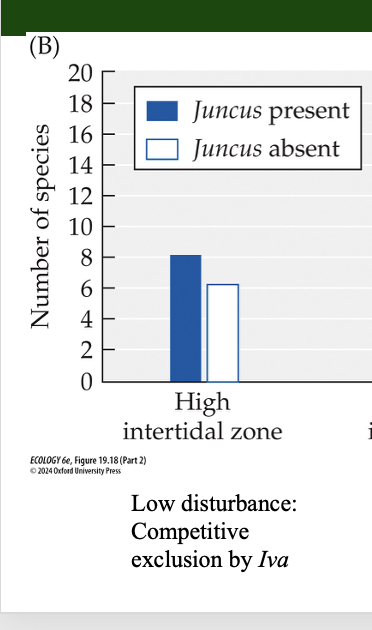
Figure 19.18 Positive Interactions: Key to Diversity in Salt Marsh Communities?
High Intertidal Zone
Low disturbance
Competitive exclusion by Iva
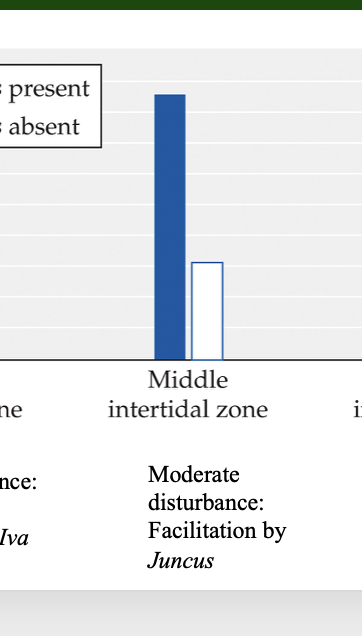
Figure 19.18 Positive Interactions: Key to Diversity in Salt Marsh Communities?
Moderate Intertidal Zone
Moderate disturbance
Facilitation by Juncus
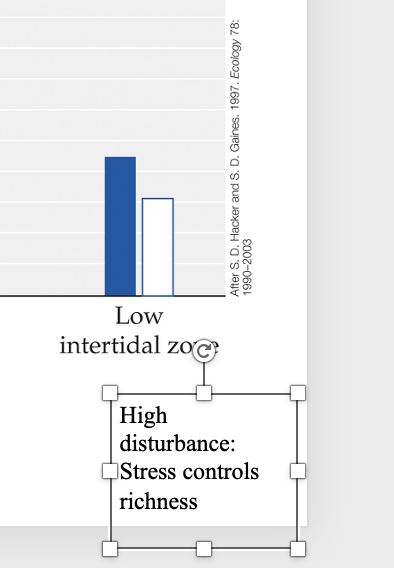
Figure 19.18 Positive Interactions: Key to Diversity in Salt Marsh Communities?
Low Intertidal Zone
High disturbance
Stress controls richness
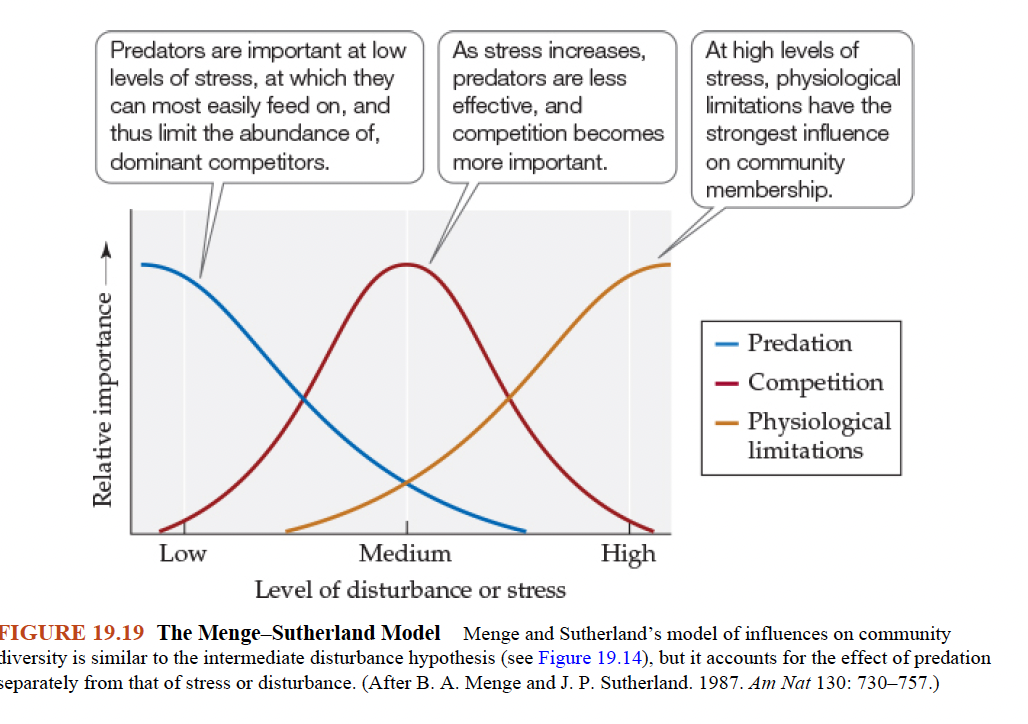
Menge–Sutherland Model (Figure 19.19)
Predicts that predation should be relatively important in maintaining species richness at low levels of stress (or disturbance),
at which predators can most easily feed on, and thus limit the abundance of, competitively dominant species
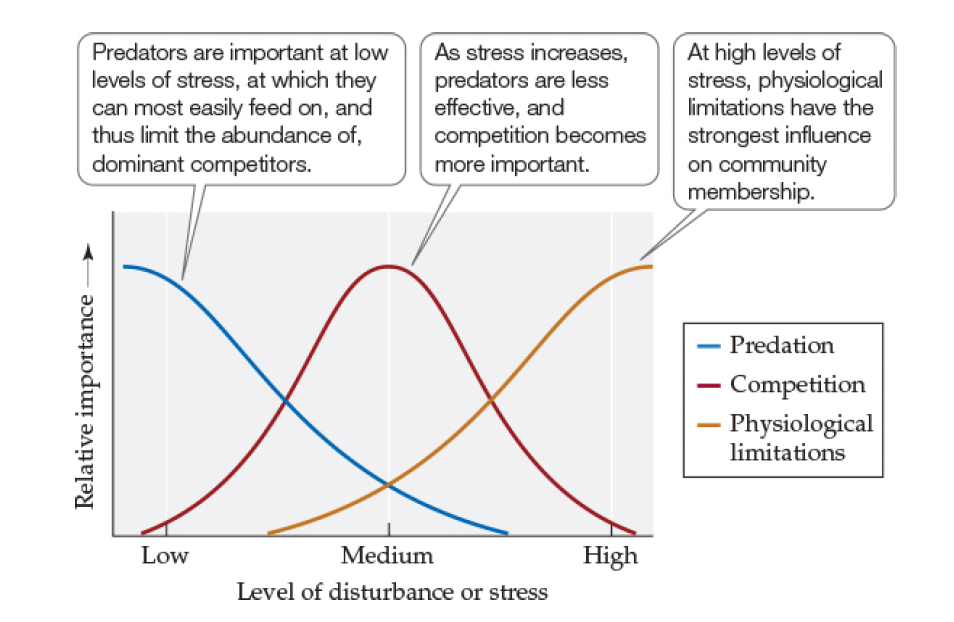
What does Blue Line Show in Menge–Sutherland Model (Figure 19.19)
Predators are important at low levels of stress, at which they can most easily feed on, and thus limit, the abundance of dominant competitors

What does Red Line Show in Menge–Sutherland Model (Figure 19.19)
As stress increases predators are less effective, and competition becomes more important
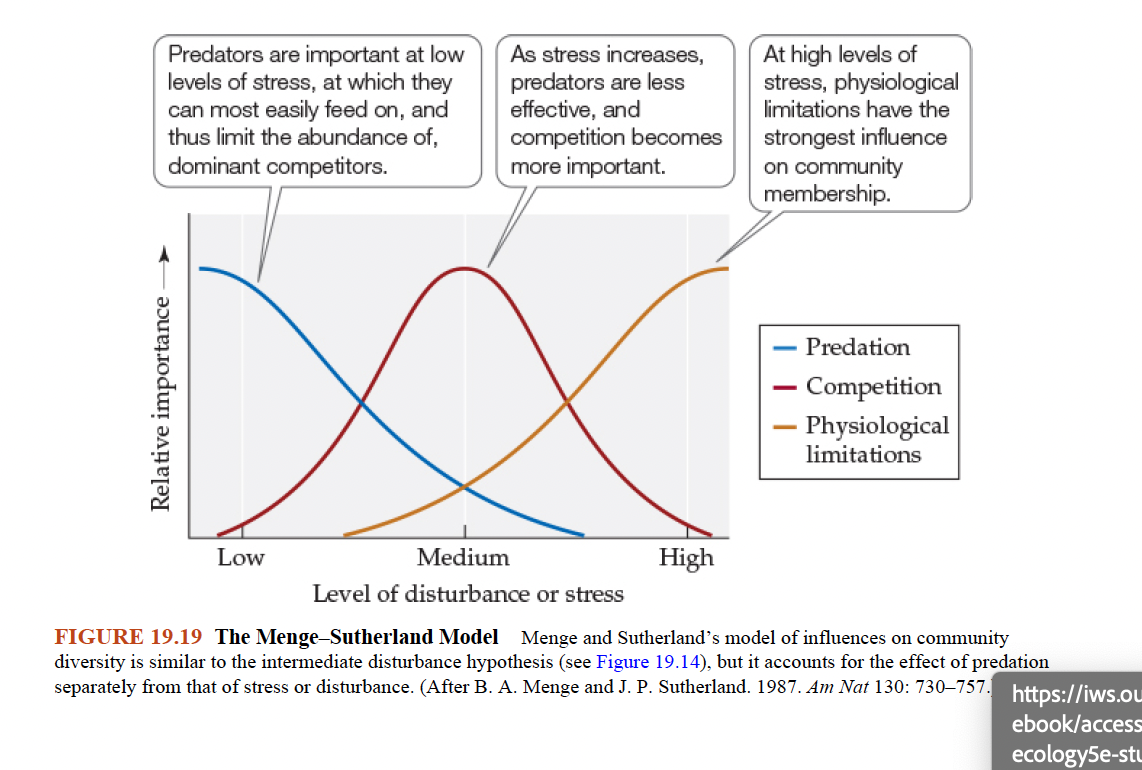
What does Red Line Show in Menge–Sutherland Model (Figure 19.19)
At high levels of stress, physiological limitations have strongest influence on community membership
Recruitment
The addition of young individuals to population.
Lottery models and neutral models emphasize
the role of chance in maintaining species diversity.
Components of Lottery models and neutral models
•all species have equal chances of obtaining resources that were made available by disturbances, and this allows coexistence.
•Species must have similar interaction strengths and growth rates and be able to respond quickly to disturbances
In reef fishes, space is often limiting, and…
new territories open unexpectedly when occupants die.
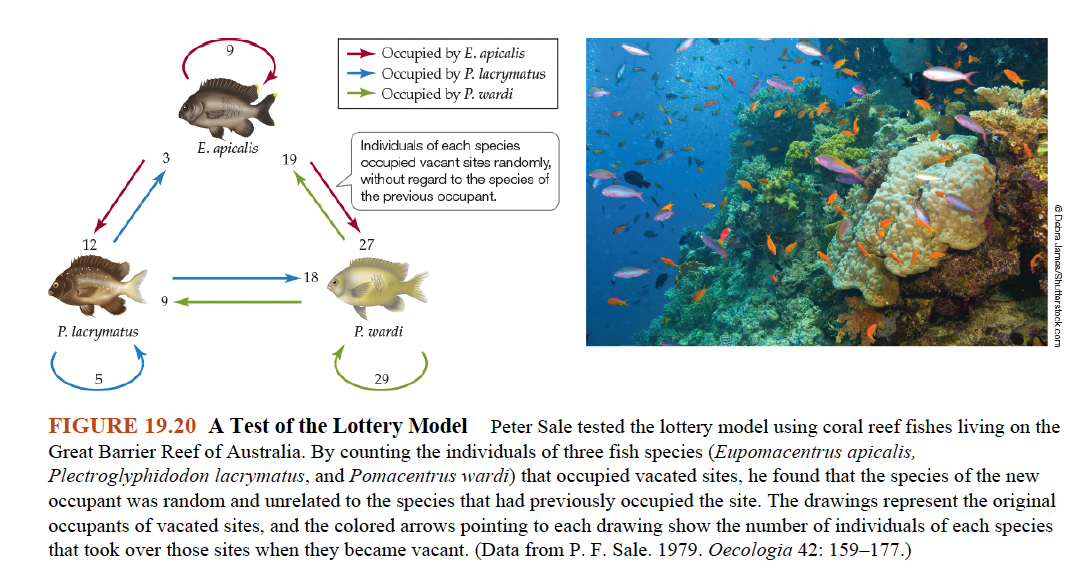
Peter Sale’s Coral Reef Fish Lottery Model Test (Figure 19.20)
Experiment: Observational study of three damselfish species on Great Barrier Reef.
What Was Done: Looked at patterns of occupation of new sites among fish species with similar resource use and growth rates.
Peter Sale’s Coral Reef Fish Lottery Model Test (Figure 19.20)
Results
Results: Colonization was random. Identity of previous occupant didn’t affect new colonizer. One species was more active but didn’t dominate.
Conclusion: Supports the lottery model: species coexist because all have equal chances to occupy freed space, not because of competitive advantage.
Fishes produce many mobile juveniles that can saturate a reef and quickly take advantage of open space.
Diversity in marine organisms is greatest at coral reefs…
Yet reefs are in nutrient poor water. Darwin viewed this as a paradox, and noted that reefs were like an oasis in an ocean desert.
CONCEPT 19.4- Many experiments show that community or ecosystem…
function is positively related to diversity.
5 community functions also provide valuable services to humans:
Food and fuel production
Water purification
O2 and CO2 exchange, CO2 sequestration
Protection from catastrophic events, such as floods
Prevent soil / beach erosion
4 hypotheses have been proposed to explain the relationship between species diversity and community function.
Complementarity hypothesis
Redundancy hypothesis
Driver and passenger hypothesis
A variation on the driver and passenger hypothesis
2 variables in all the hypotheses:
Degree of overlap in ecological function of species
Variation in strength of the ecological functions of species
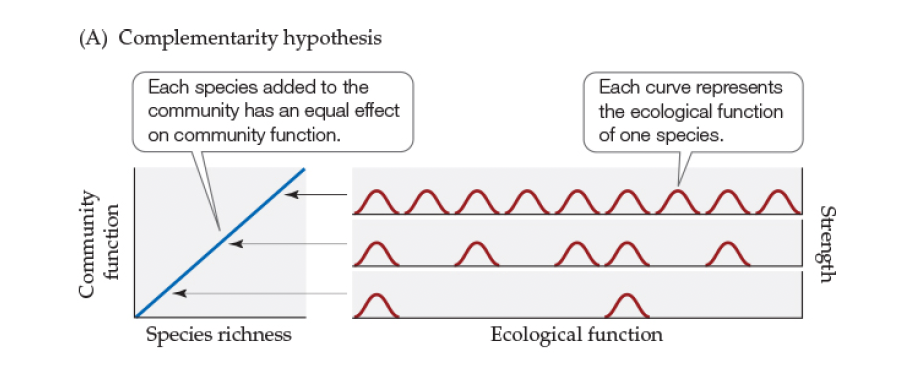
Complementarity hypothesis
As species richness increases, there will be a linear increase in community function.
Each species added has an equal effect.
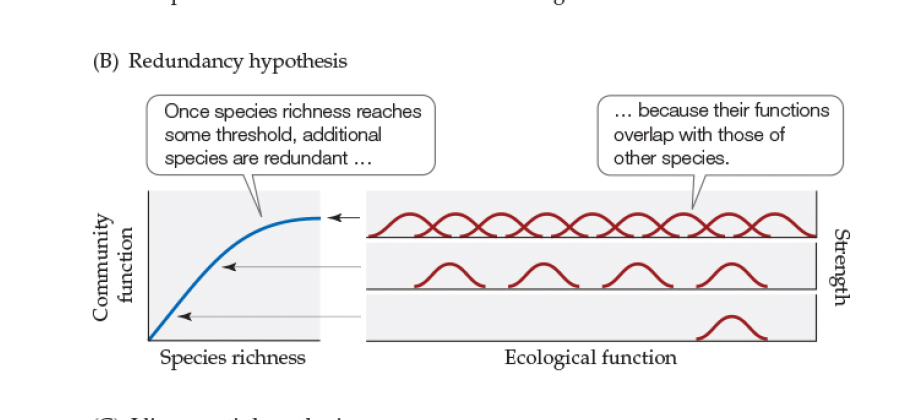
Redundancy hypothesis
The functional contribution of additional species reaches a threshold.
As more species are added, there is overlap in their function, or redundancy among species.
Once spp richness reaches a threshold there is redundancy because niches overlap
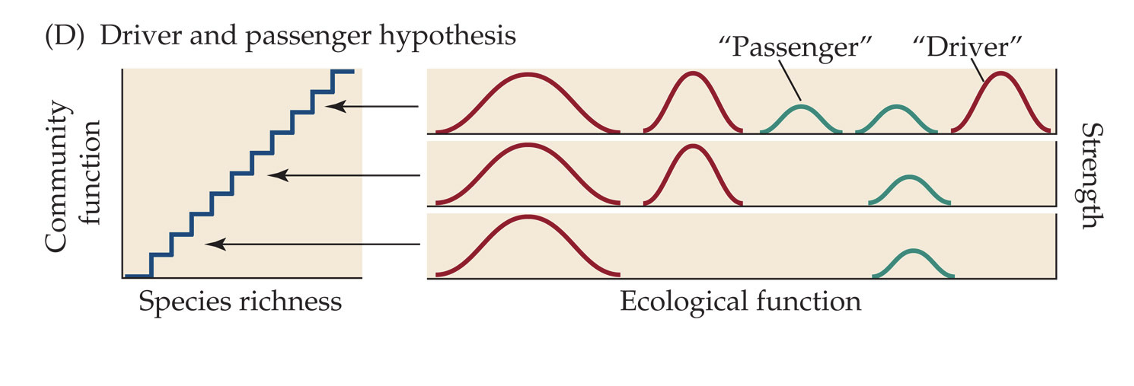
Driver and passenger hypothesis
Strength of ecological function varies greatly. “Driver” species have a large effect; “passenger” species have a minimal effect.
Addition of driver and passenger species will have unequal effects on community function
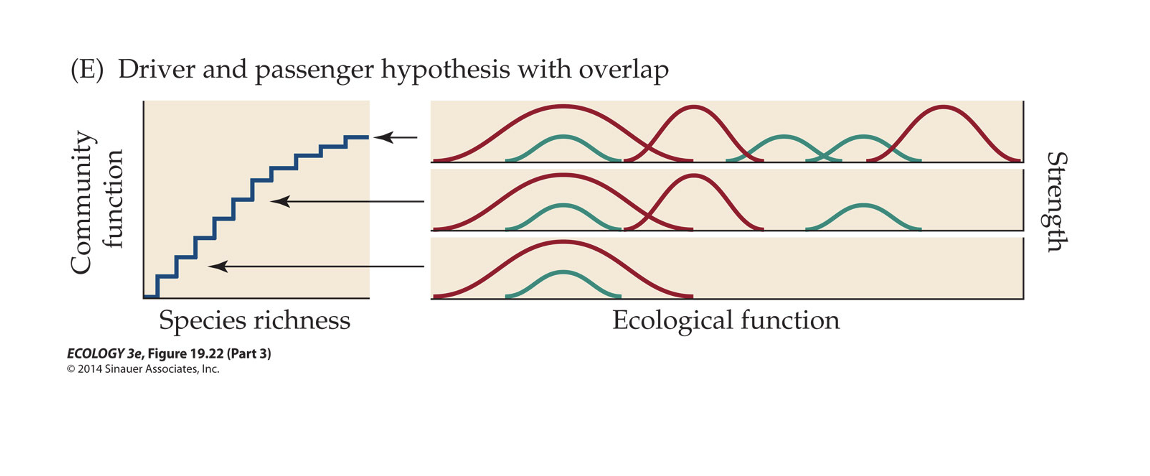
A variation on the driver and passenger hypothesis
It assumes there could be overlap between driver and passenger functions.
Tilman & Downing (1994) – Drought Resistance in Prairie Plots
Experiment:
What they did:
Used long-term experimental plots at Cedar Creek, Minnesota, with varying plant species richness. A drought occurred, and they analyzed how plots with different species richness responded.
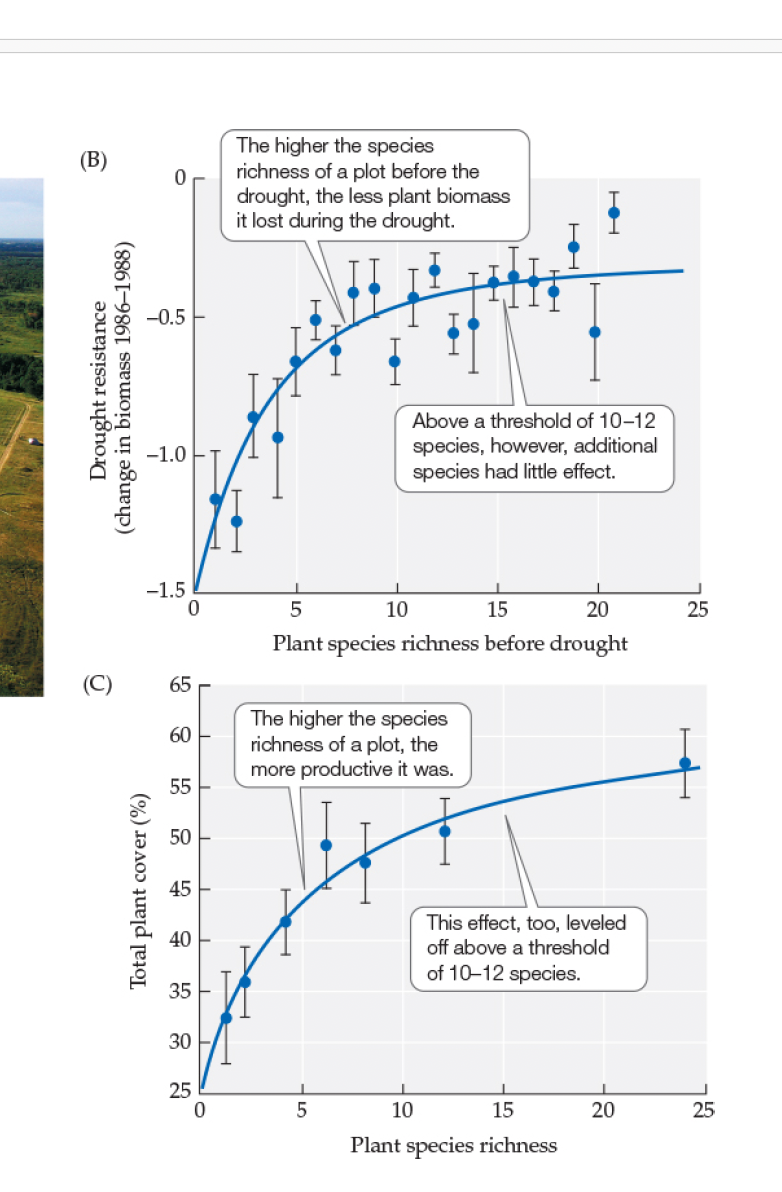
Tilman & Downing (1994) – Drought Resistance in Prairie Plots
Results
Plots with higher species richness had smaller reductions in biomass during the drought. This indicated higher drought resistance in more diverse communities.
More diverse prairie plots lost less biomass during drought, suggesting species diversity increases ecosystem stability up to a functional threshold.
Tilman et al. (1996) – Biomass Production and Diversity
Experiment
What they did:
Manipulated plant species richness in plots (1–24 species) with equal density and resources. Randomized species selection from a 24-species pool. Measured biomass after 2 years.
Tilman et al. (1996) – Biomass Production and Diversity
Results
Results:
Biomass increased with species richness, also showing a curvilinear (redundancy-based) relationship. Nutrient (nitrogen) use efficiency also improved in more diverse plots.
Conclusion:
Confirms that diversity promotes productivity, but the effect plateaus—supporting the redundancy hypothesis (i.e., some species overlap in function).
Biomass and nitrogen use increased with richness but plateaued, showing functional redundancy in diverse communities.
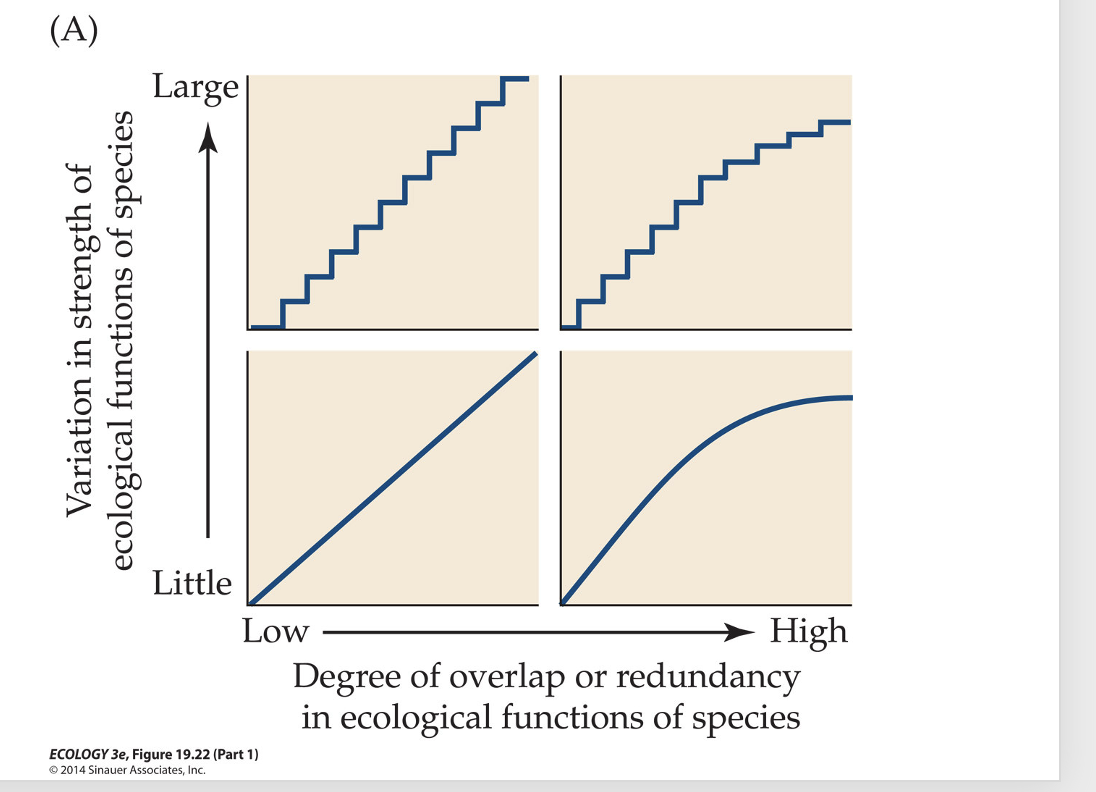
What do the four models in Figure 19.22 imply for conservation strategies?
They suggest that conserving high species richness is critical in systems where species perform unique or variable functions, while in more redundant systems, preserving functional group diversity is key. In all models, maintaining diversity enhances ecosystem stability and function.
The Diversity–Stability Theory
A long-standing idea in ecology is that species richness is positively related to community stability—
The tendency of a community to remain the same in structure and function, or to return after a disturbance
Stability is often measured in terms of…
total community biomass.
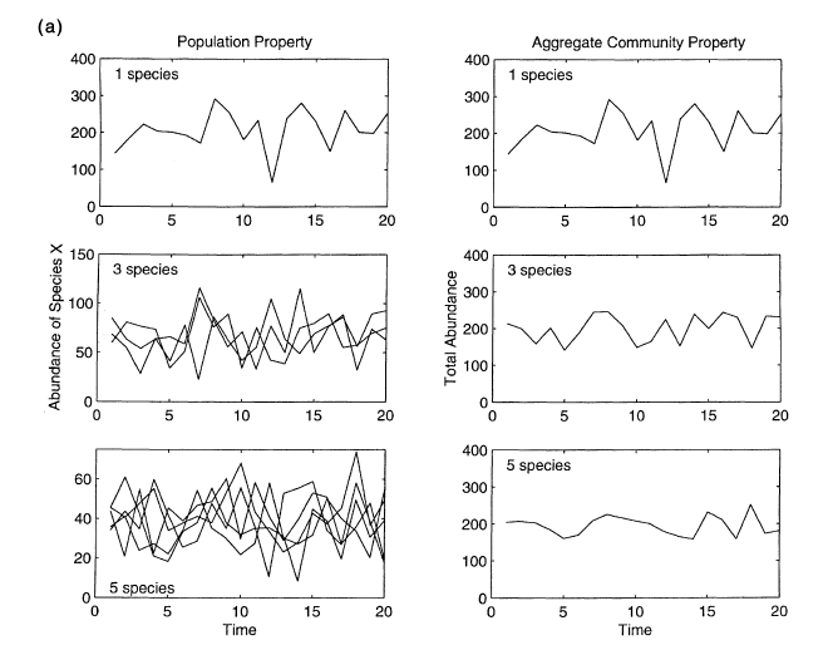
The portfolio effect
diversified communities are more stable.
This term gets its name from investing – the more diverse your investment portfolio, the more stable your net worth will be against market fluctuations
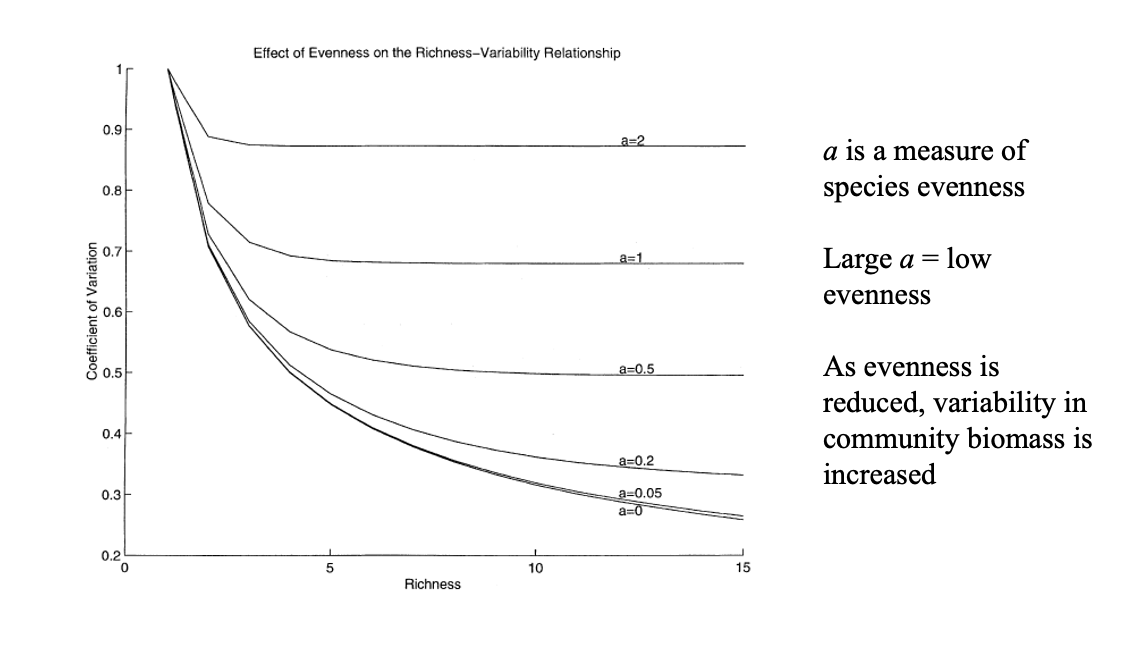
Doak et al. (1998) showed that…
As evenness is reduced, variability in community biomass will increase
Monoculture means the potential for…
greater variability in crop yields in response to disease (amount of crop harvested changes more drastically from year to year)
Fusarium wilt in bananas
Aspegillis fungus in corn