BIOL 300 Final Memorize
1/54
There's no tags or description
Looks like no tags are added yet.
Name | Mastery | Learn | Test | Matching | Spaced | Call with Kai |
|---|
No study sessions yet.
55 Terms
what are 24 tests covered in BIOL 300
binomial test
x² goodness of fit test
x² goodness of fit using a poisson distribution
x² contingency test
fisher’s exact test
one-sample t-test
paired t-test
two-sample t-test
single factor ANOVA
correlation
linear regression
welch’s t-test
shapiro-wilk test
mann-whitney u test
levene’s test
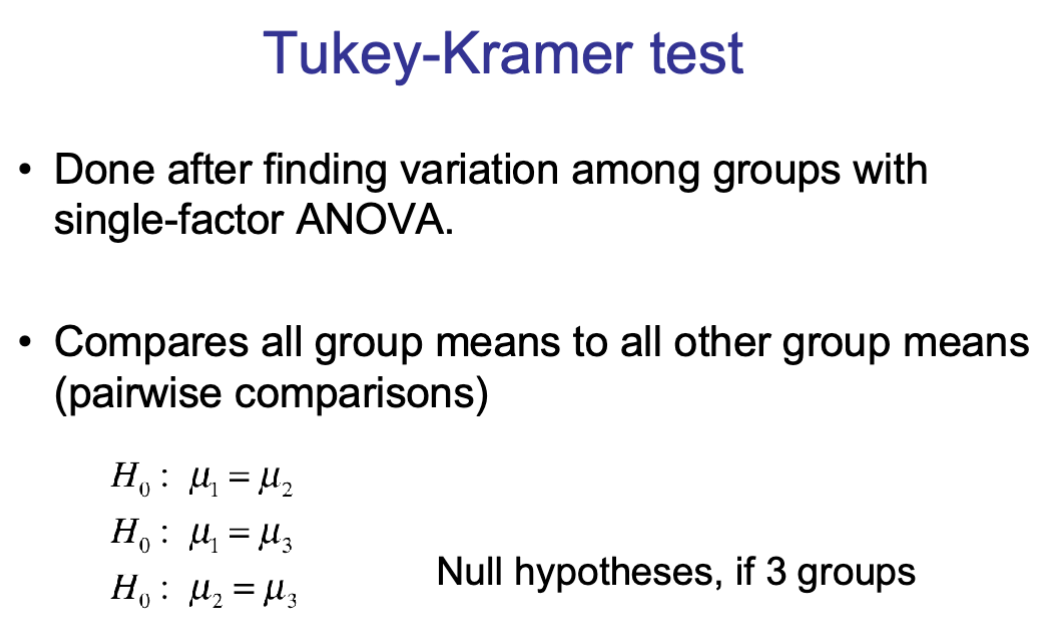
tukey-kramer test
kruskal-wallis test
spearman’s (rank) correlation
logistic regression
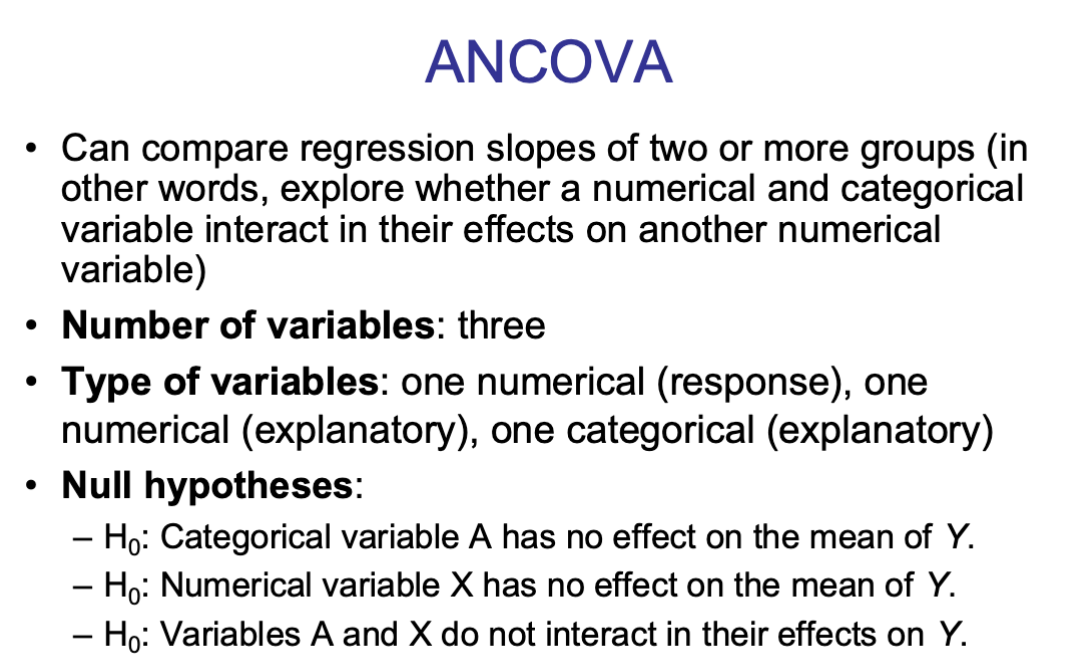
ANCOVA
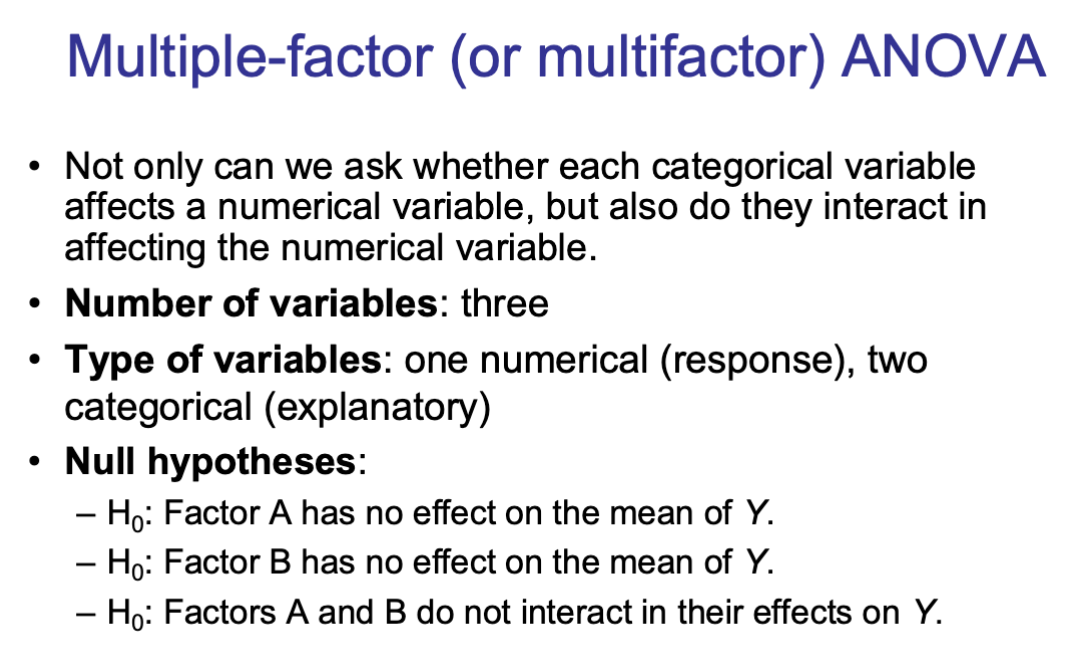
Multifactor ANOVA
Simulation
Randomization
Bootstrapping
which 10 tests do you need to know how to do by hand?
binomial test
x² goodness of fit test
x² goodness of fit test using a poisson distribution
x² contingency test
one-sample t-test
paired t-test
two-sample t-test
single factor ANOVA
correlation
linear regression
which tests can you perform when one variable is involved?
binomial test
x² goodness of fit test (proportional model)
x² goodness of fit test (poisson distribution)
one sample t-test
shapiro-wilk test
which tests can you perform when two variables are involved?
x² contingency test
fisher’s exact test
paired t-tets
two-sample t-test
welch’s t-test
mann-whitney u test
ANOVA
Kruskal-Wallis test
Tukey-Kramer test
regression
logistic regression
correlation
spearman’s rank correlation
which tests can you perform when three variables are involved?
multi-factor ANOVA
ANCOVA
which tests can you pick from if you are analyzing 1 categorical variable + how do you decide which one to use for which case?
binomial test
x² GOF with proportional model
which tests can you pick from if you are analyzing 1 numerical variable + how do you decide which one to use for which case?
x² GOF with poission distribution
one-sample t-test
shapiro-wilk test
which tests can you pick from if you are analyzing 2 categorical variables + how do you decide which one to use for which case?
x² contingency test
fisher’s exact test
which tests can you pick from if you are analyzing 1 categorical explanatory variable and 1 numerical response variable + how do you decide which one to use for which case?
paired t-test
two-sample t-test
welch’s t-test
mann-whitney u test
ANOVA
Tukey - Kramer test
which tests can you pick from if you are analyzing 2 numerical variables + how do you decide which one to use for which case?
regression
correlation
spearman’s rank correlation
which test should you pick from if you are analyzing 1 numerical explanatory variable and 1 categorical response variable (binary)
logistic regression
which test should you pick from if you are analyzing 2 categorical explanatory variables and 1 numerical response variable
multi-factor ANOVA
which test should you pick if you are analyzing 1 categorical explanatory variable, 1 numerical explanatory variable and 1 numerical response variable
ANCOVA
brief description of the binomial test; null, test statistic, df (if applicable), assumptions (if applicable), extra notes
uses data to test wether a population proportion p matches a null expectation for the proportion
null: the relative frequency of successes in the population is p0
test statistic: P-hat or X (number of successes of N trials)
*note: works if categorical variable only has two outcomes (eg. “success” or “failure”)
brief description of the x² GOF test; null, test statistic, df (if applicable), assumptions (if applicable), extra notes
the x² GOF test compares counts to a categorical or discrete numerical probability distribution
null: the data comes from a specified probability distribution (proportional, poisson)
test statistic: x²
df: (# of categories) - (# parameters estimated from data) - 1
assumptions: no more than 20% of categories with expected < 5; no category with expected < 1; random sampling
brief description of the x² contingency test; null, test statistic, df (if applicable), assumptions (if applicable), extra notes
tests the association of two or more categorical variables
null: the variables are independent
test statistic: x²
degrees of freedom (#columns - 1) * (#rows - 1)
assumptions: no more than 20% of categories with expected <5; no category with expected < 1; random sampling
brief description of the one-sample t-test; null, test statistic, df (if applicable), assumptions (if applicable), extra notes
the one-sample t-test compares a sample mean to a population mean proposed in a null hypothesis
null: population mean = null mean
df: n - 1
test statistic:
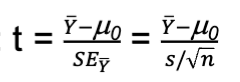
assumptions: variable is normally distributed; random sampling
brief description of the paired t-test; null, test statistic, df (if applicable), assumptions (if applicable), extra notes
the paired t-test compares the mean of the differences between two treatments to a value given in the null hypothesis
null:

test statistic:
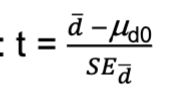
degrees of freedom: number of pairs - 1
assumptions: differences are normally distributed; random sampling
brief description of the two-sample t-test null, test statistic, df (if applicable), assumptions (if applicable), extra notes
the two-sample t-test compares the differences in the means of two treatments to a value given in the null hypothesis
null:
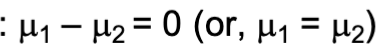
test statistic:
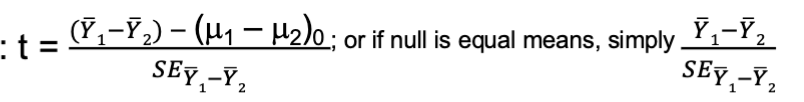
df: n
assumptions: both populations have normal distributions; equal population variances; random
brief description of the ANOVA: null, test statistic, df (if applicable), assumptions (if applicable), extra notes
the analysis of variance (ANOVA) tests differences among means of multiple groups
null:

test statistic:

df:

assumptions: all populations have normal distributions; equal population variances; random sampling
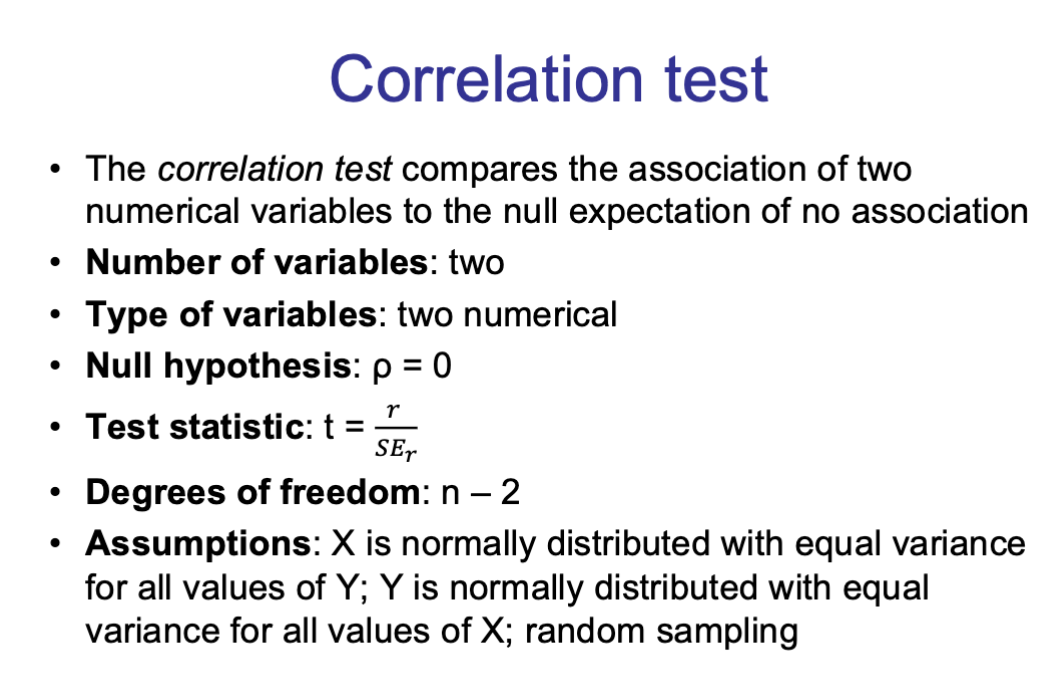
brief description of the correlation test: null, test statistic, df (if applicable), assumptions (if applicable), extra notes
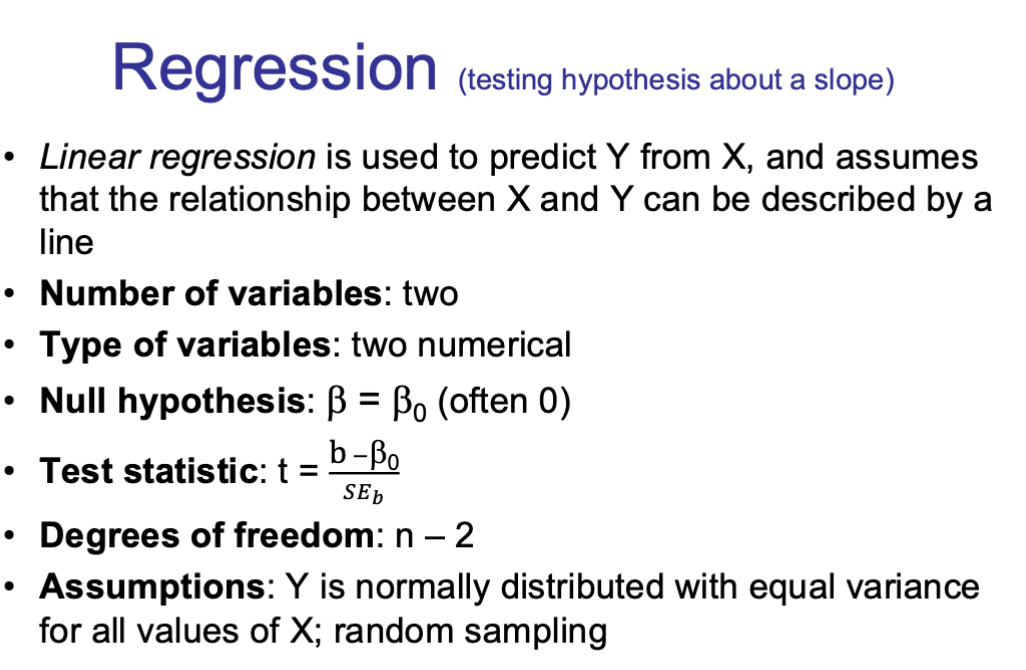
brief description of the regression: null, test statistic, df (if applicable), assumptions (if applicable), extra notes
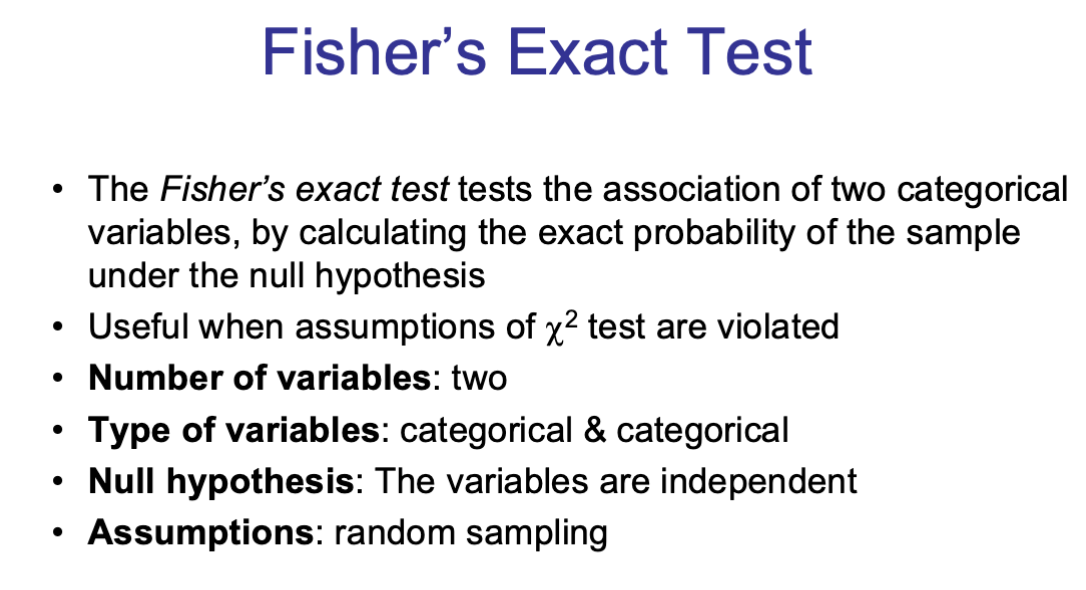
brief description of the fisher’s exact test: null, test statistic, df (if applicable), assumptions (if applicable), extra notes
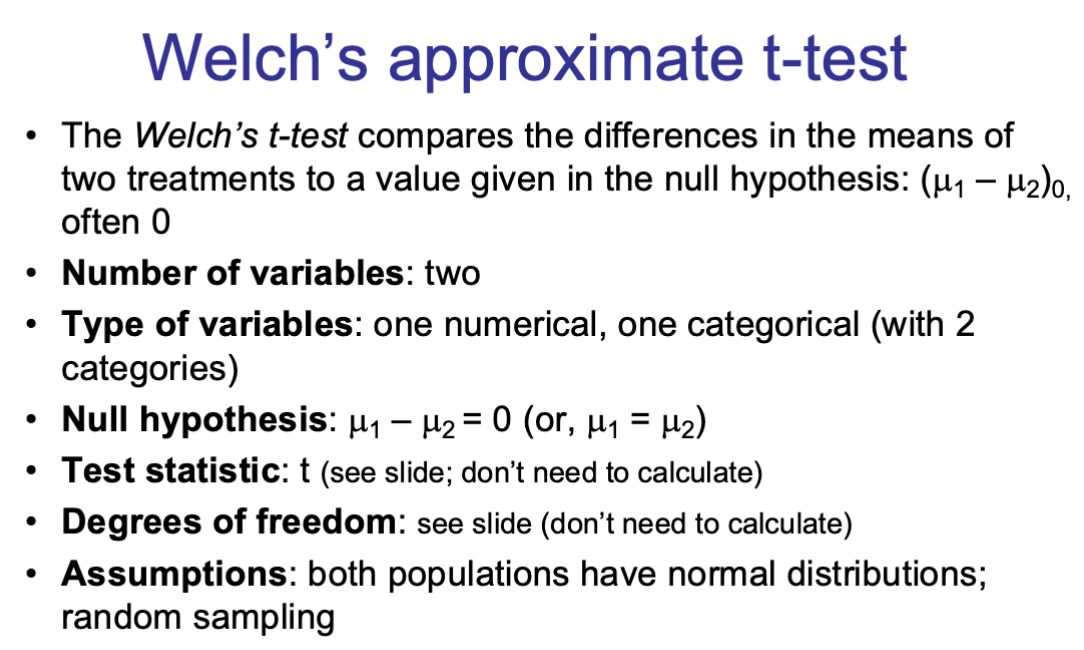
brief description of the welch’s approximate t-test: null, test statistic, df (if applicable), assumptions (if applicable), extra notes
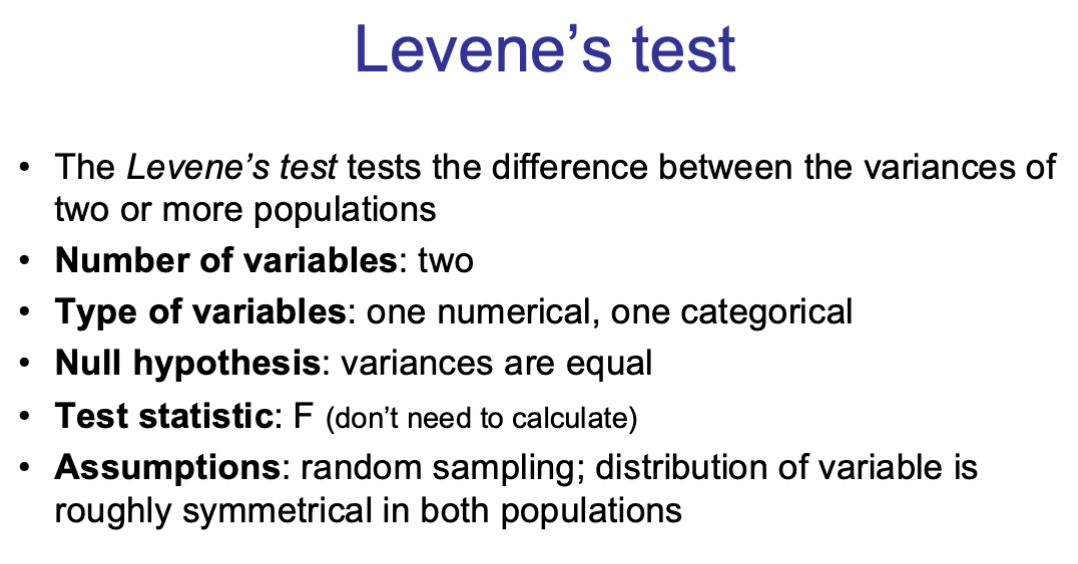
brief description of the levene’s test: null, test statistic, df (if applicable), assumptions (if applicable), extra notes
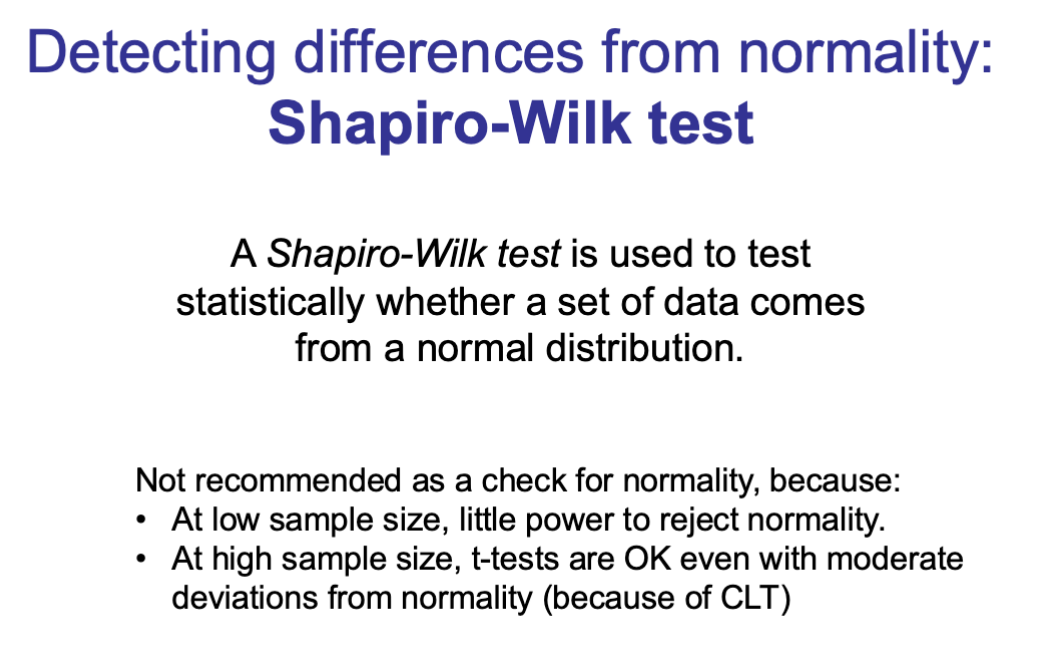
brief description of the shapiro-wilk test
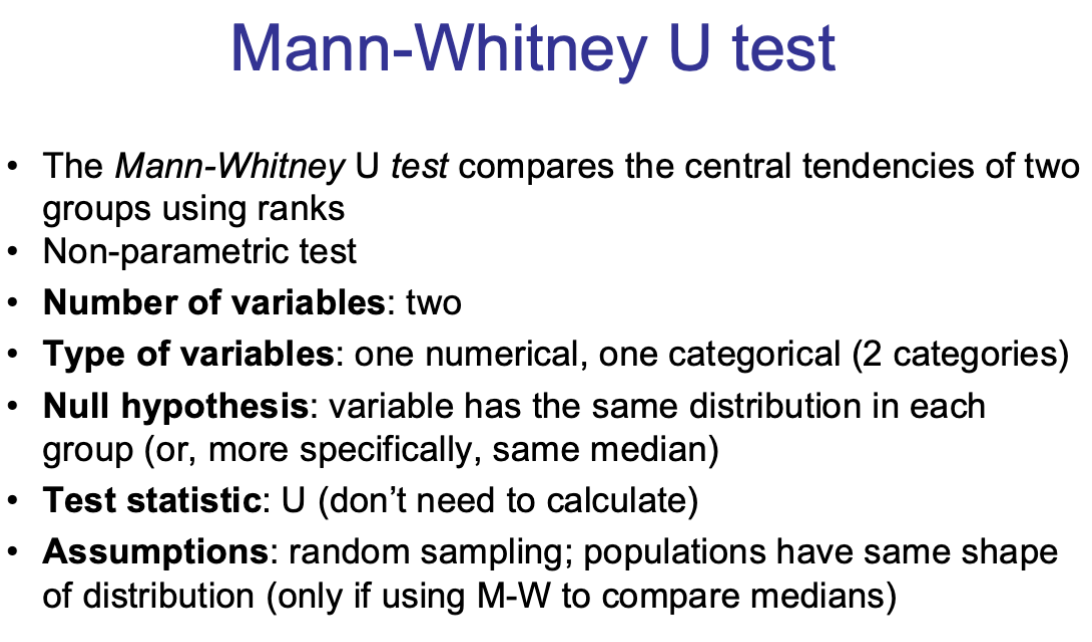
brief description of the mann-whitney u test: null, test statistic, df (if applicable), assumptions (if applicable), extra notes
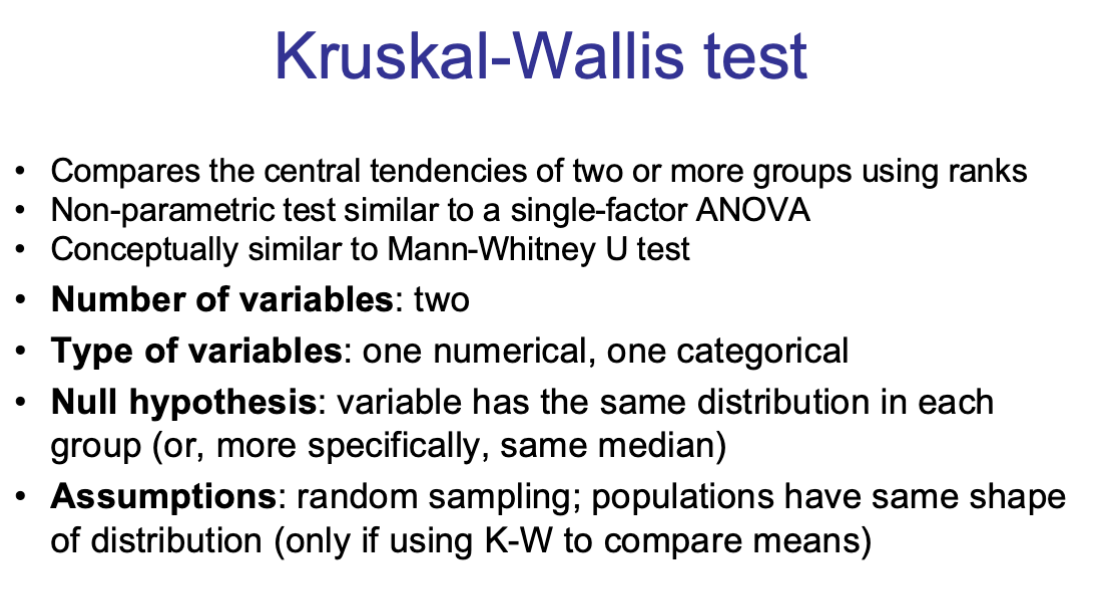
brief description of the kruskal-wallis test: null, test statistic, df (if applicable), assumptions (if applicable), extra notes
brief description of the tukey-kramer test
brief description of the spearman’s rank correlation
brief description of the logistic regression

brief description of the multi-factor ANOVA
brief description of the ANCOVA
what are the computationally intensive methods?
simulation - creates new data from a theory
generates artificial data based on a known theoretical model or set of parameters to study the behavior of a system or estimate probabilities
eg. random number generation
used to calculate probabilities for complex scenarios where you know the “rules” of the world but not the outcome
permutation (randomization) - shuffles existing data with replacement
a statistical significance test that builds a null distribution by repeatedly reshuffling the observed data’s labels without replacement
breaks the relationship between variables by shuffling group assignments (eg. swapping who got the drug and the placebo)
used for hypothesis testing (calculating a p-value) to see if an observed difference is due to chance
bootstrapping - recycles existing data with replacement
a resampling technique that estimates the sampling distribution of a statistic by drawing repeated samples from the original dataset with replacement
treating the sample as if it were the population and drawing from it over and over to see how much the statistic varies
used for creating confidence intervals and estimating standard error
what are the steps for statistical testing
clearly state:
null and alternative hypotheses
name of test
calculate and show the test statistic
indicate alpha and when appropriate df and the critical value of the test statistic
give the p-value as precisely as you can (either from tables or from other info - eg. calculated directly in binomial test, or using software like R)
interpret results in words
how to obtain a proportion confidence interval
how to obtain a mean of a normally distributed variable confidence interval
how to obtain a difference in means confidence intervals
how to obtain a regression slope confidence interval
population variance vs sample variance formula
coefficient of variation formula
power formula
law of total probability
general multiplication rule
addition rule
sample proportion formula
formula for N choose X
How to calculate expected values for x²
z-score formula
formula for t in a correlation test
t = r/SEr
formula for MS
formula for SStotal