z-Score and Normal Distribution
1/14
There's no tags or description
Looks like no tags are added yet.
Name | Mastery | Learn | Test | Matching | Spaced | Call with Kai |
|---|
No analytics yet
Send a link to your students to track their progress
15 Terms
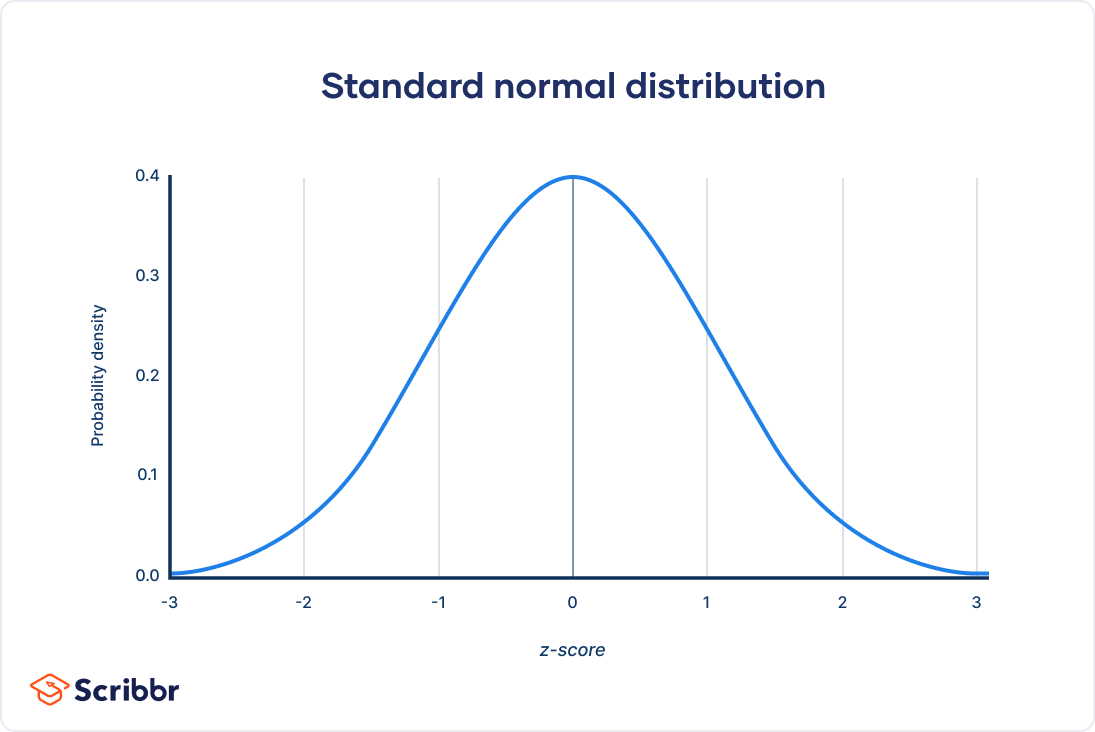
Normal Distributions
This is the most important and widely used distribution - Bell Curve
Normal Distributions Characteristics
Normal distributions are symmetric around their mean
The mean, median, and mode of a normal distribution are equal (all with each other)
The area under the normal curve is equal to 1
Normal distribution is denser in the center (middle highest point/more scores) and less dense in the tails (less scores)
Issues with Raw Scores
Required to calculate mean alongside SD of the distribution for interpretation
Can’t tell if score is good or bad by itself (don’t know where the score stands or how to interpret it) - no frame of reference
z-Scores will resolve this issue by showing us how far or close raw scores are from the mean (tells us how far that score is from the average)
mean = average score
z-Scores
We transform our X values into Z-Scores to tell us how far away score is from mean (in units of the standard deviation and + or - direction)
will show us exactly where our raw scores is located within it’s distribution
can compare Z-Scores to other Z-scores in different distributions
z-Scores Distribution Properties
Mean of z-Score distribution is always 0
The standard deviation of the z-Score is always 1
The shape is always the. same as the original distribution
Interpreting z-Scores
Sign tells us whether the score is above (+) or below (-) the mean
Number tells us the distance between the score and the mean
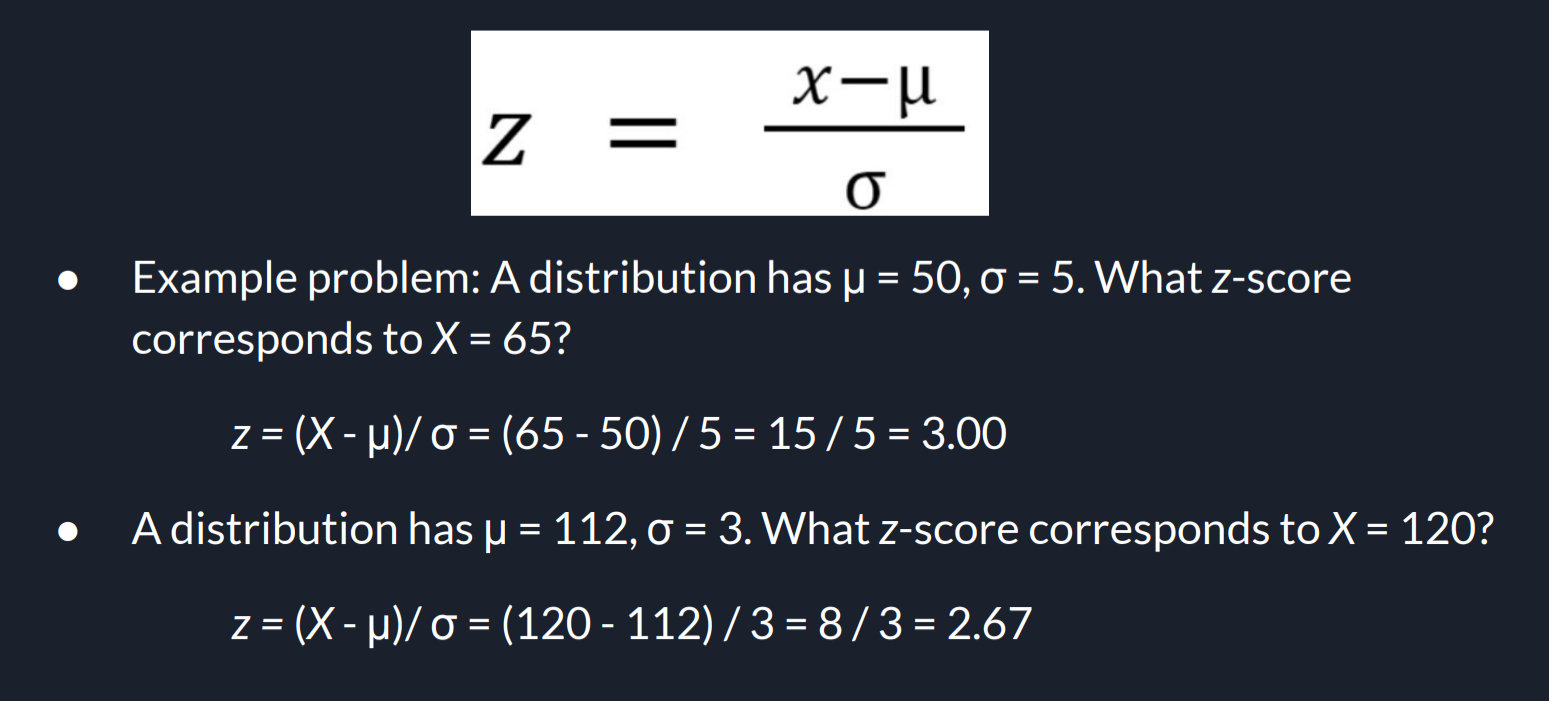
z-Score Formula
take your X-Value (X) and subtract by your Mean Population (μ)
Then divide by your Population Standard Deviation (σ)
You now calculated your z-Score!
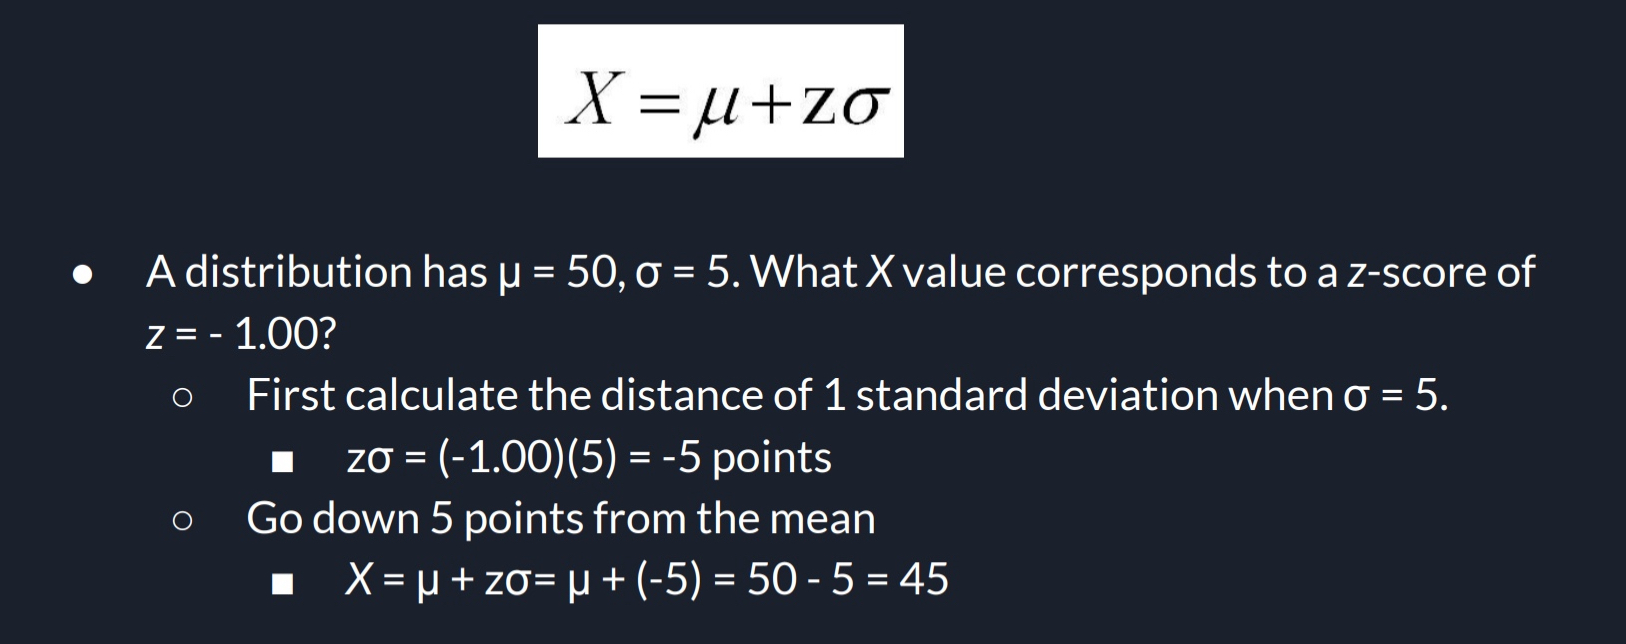
z-Score to Raw Score (X)
Take your Population Mean and add to your calculated/multiplied z-Score and Population SD
Once you calculated that all together, you have your z-Score to Raw Score
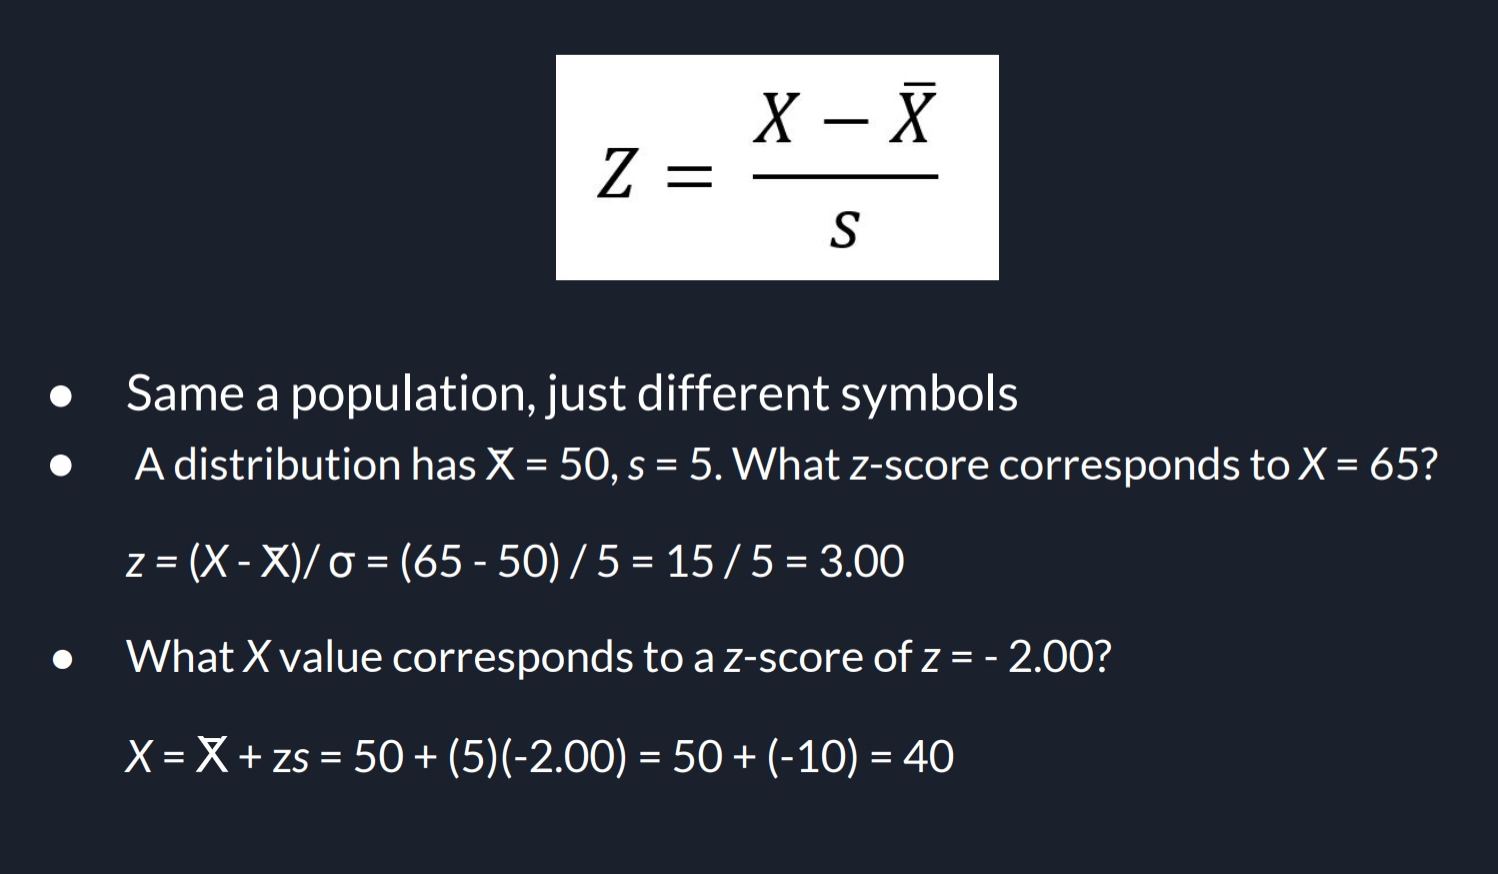
Sample z-Score
Same as population, just different symbols (this is to get z-Score value, so X-Value subtracted by your Mean, then divided by your Sample SD)
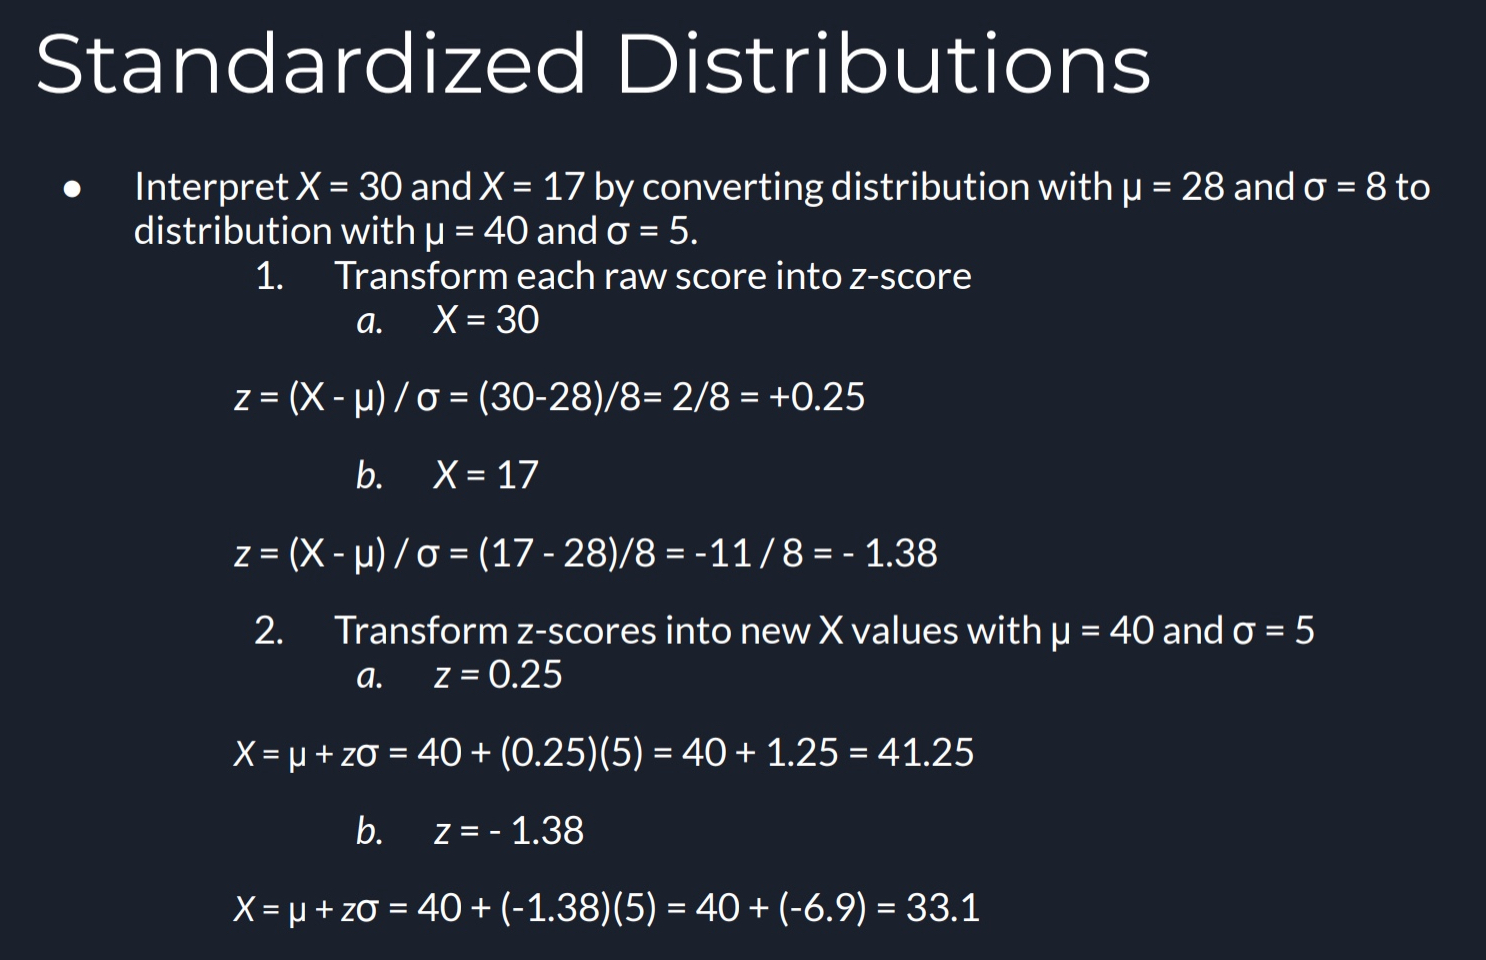
Putting it all together: Standardized Distribution Problem
Find your z-Score, then transform z-Score to raw score
answer is found!
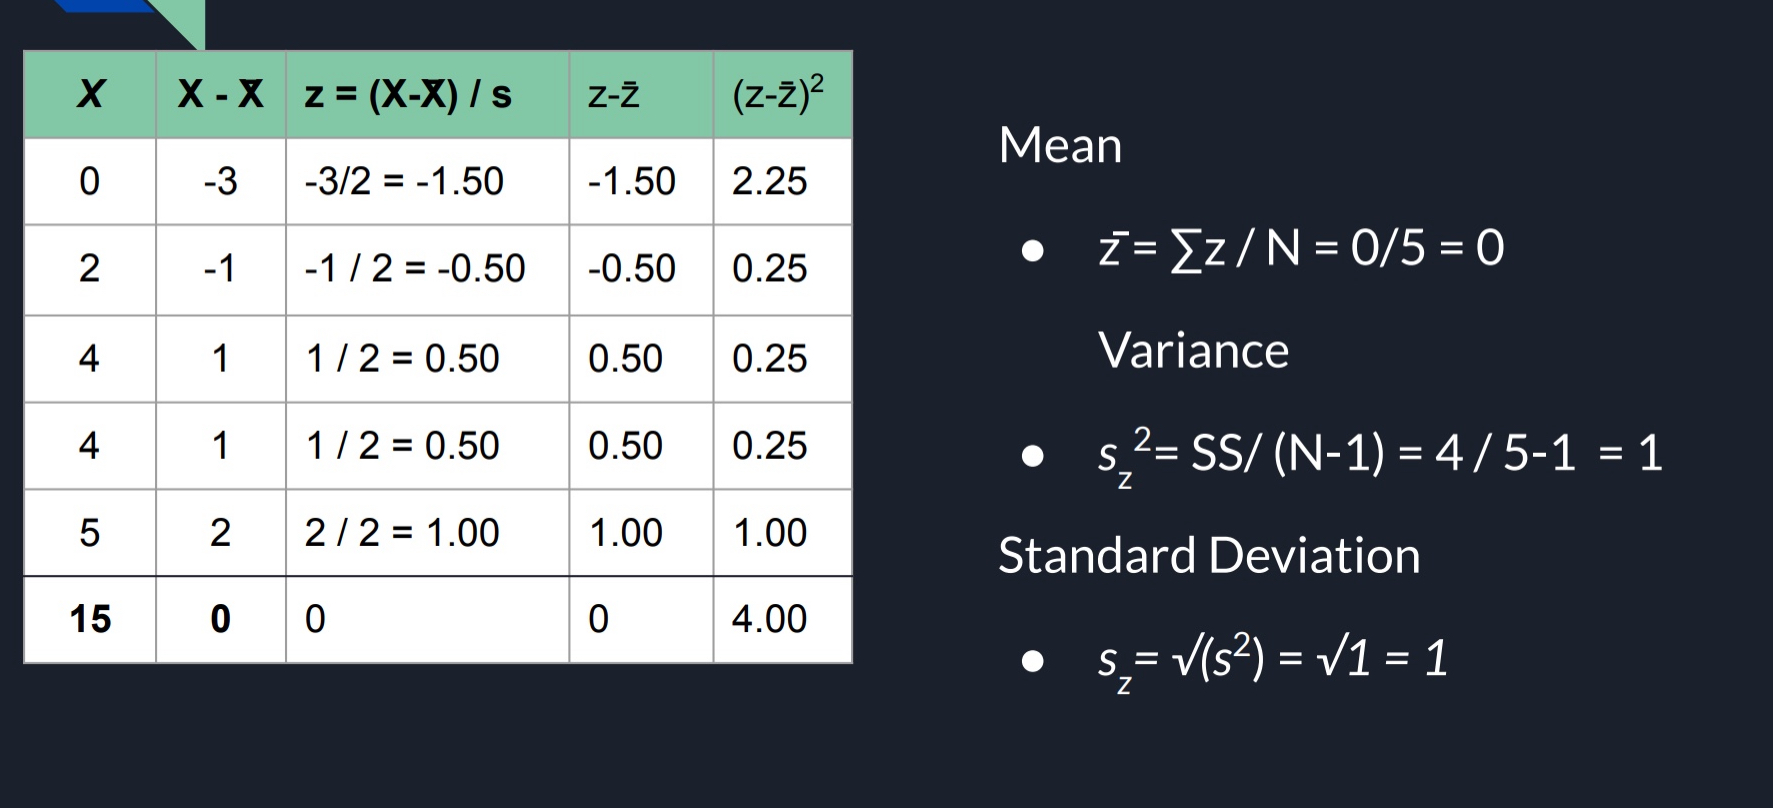
z-Score mean (z̄)
z̄ = ∑z/N
Average z-Score of distribution
remember z-Score mean properties state it’ll always equal (z̄ = 0)
Squared Deviation (SS) AND Sum of Squares (SS)
(z - z̄)² - Squared Deviation (IN GENERAL SENSE)
power by 2 your calculated z-Score subtracted by your z-Score mean
- btw, because z̄ is 0, you’ll just be powering your z-Score
Σ(z - z̄)² - Sum of Squares (IN GENERAL SENSE
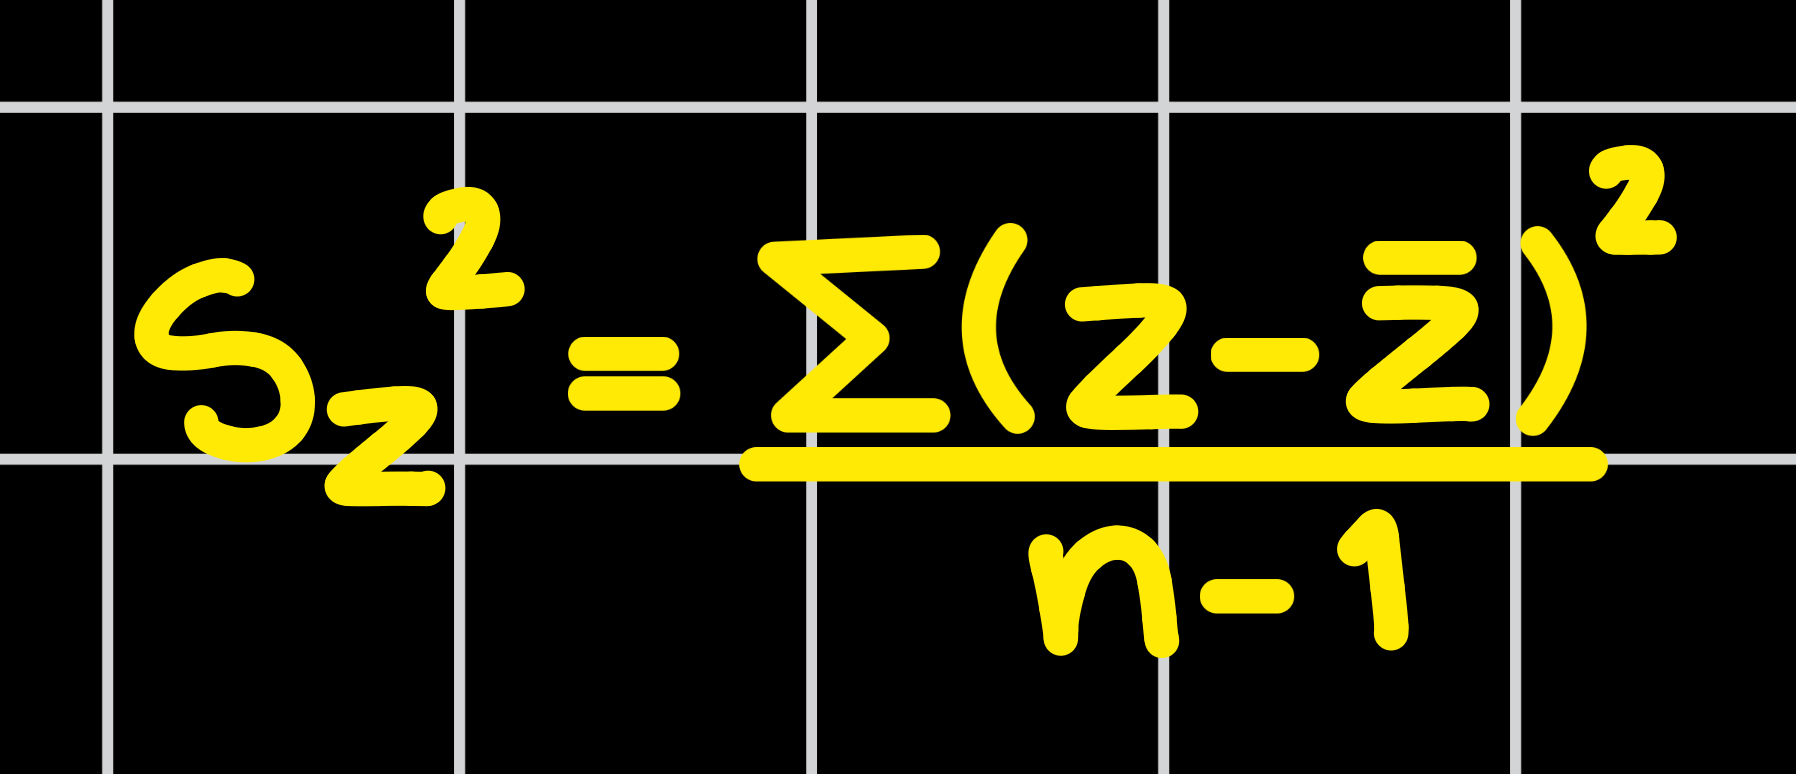
Sample z-Score Variance (S_z²)
find your Squared Deviation (SS)
divide by n-1
YOU’LL ALWAYS GET THE ANSWER 1; z-Score properties state z-Score Variance will always equal 1 (S_z² = 1)
NOTE: when you do anything with a z-Score, you’ll need to have already solved your OG Population and Sample Standard Deviation. You literally need that JUST to get your z-Score. Everything is new after that!
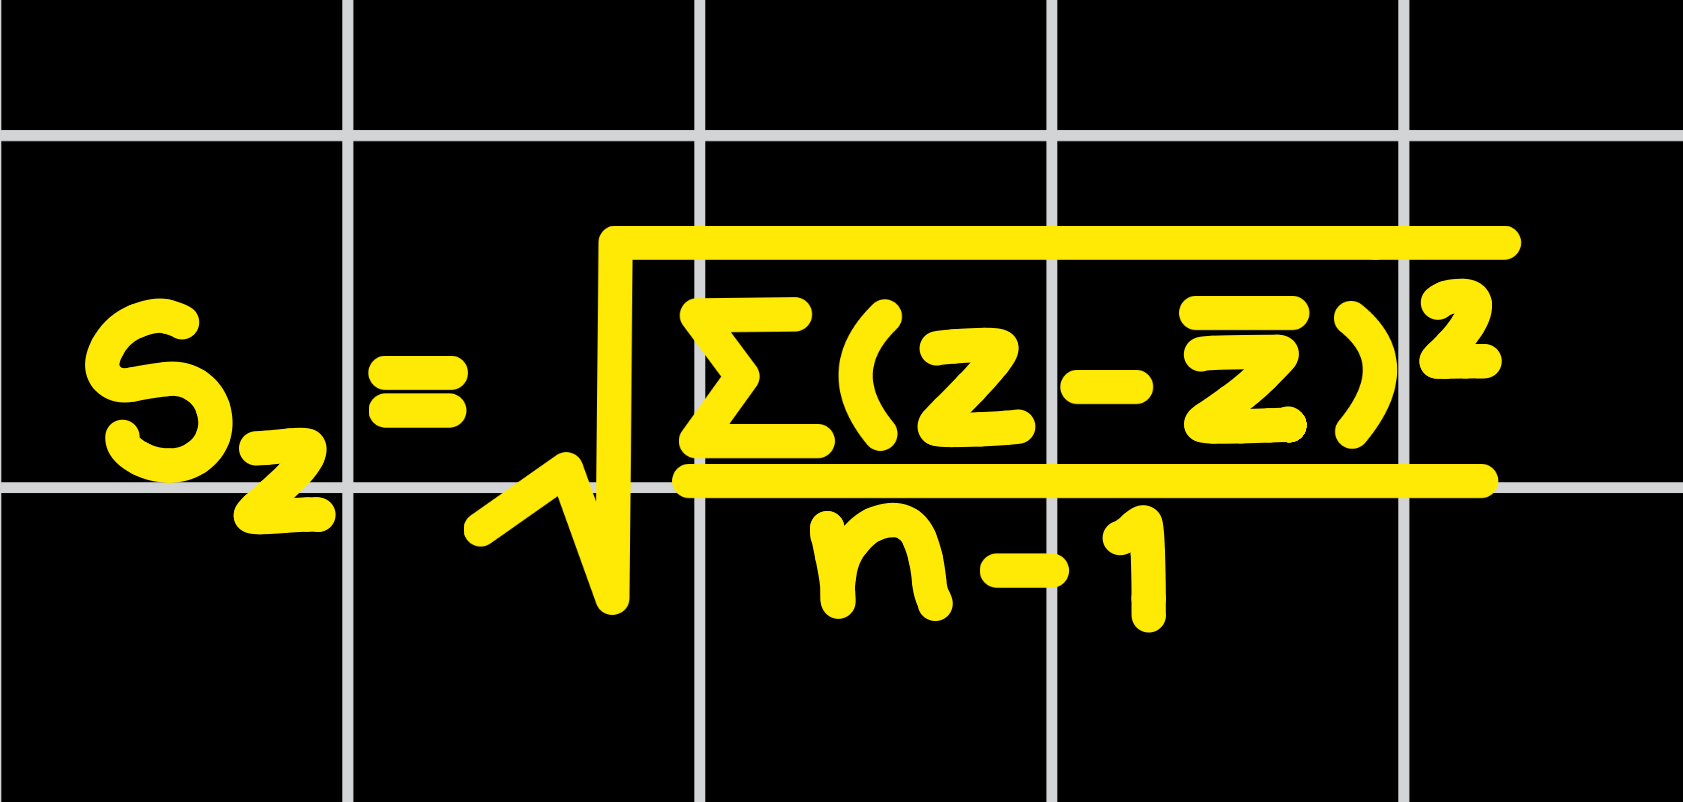
Sample z-Score Standard Devation
square your Sample z-Score Variance
YOU’LL ALWAYS GET THE ANSWER 1; z-Score properties state z-Score Standard Deviation will always equal 1 (S_z = 1)
NOTE: when you do anything with a z-Score, you’ll need to have already solved your OG Population and Sample Standard Deviation. You literally need that JUST to get your z-Score. Everything is new after that!
Putting it all together: Standardized Distribution Table
Find your z-Score
Find your z-Score mean (z̄ = 0)
Find your Sample z-Score Variance (S_z² = 1)
Find your Sample z-Score Standard Deviation (S_z = 1)