Unit 6 (STATS - 1000)
1/83
There's no tags or description
Looks like no tags are added yet.
Name | Mastery | Learn | Test | Matching | Spaced |
|---|
No study sessions yet.
84 Terms
Summary of Learning Outcomes
Estimating with confidence
Confidence interval for a population mean (σ known)
Margin of error
Effect of sample size, confidence level, standard deviation
Effect of population size
Sample size calculation for estimating a population mean
Where do we obtain our data from?
Samples
Are we usually satisfied about the information just about the sample itself?
no, we are not
How do we like to use the sample data
infer something about the population of interest
Statistical inference (def)
provides methods for drawing conclusions about a population from sample data
Can we be certain that our sample data fairly represents the population?
no we can never be certain
Foundation of inference
lies on long - run predictable behaviour
Just like with probability
How can we draw conclusions with a high probability of being correct? (statistical interference)
by using good sampling methods (e.g. SRS)
How “good” of an estimator is ¯X
The probability that ¯X= µ is equal to 0, because of continuity
Reporting the sample mean alone gives us no information as to how accurate we believe our estimate to be
Instead, we would like to use the sample mean to construct an interval of values to estimate the population mean µ
Probability of ¯X= µ is equal to 0
because of continuity
Does reporting the sample mean alone give information as to how accurate we believe our estimate to be.
No, it does not provide accuracy information.
no information as to how accurate we believe our estimate to be
How do we use mean to estimate the population mean
construct an interval of values to estimate the population mean µ
Chance variation
We know that the sample mean will vary from sample to sample,
variation that occurs just “by chance”
Confidence interval
We know that the sample mean will vary from sample to sample, simply because of chance variation (think: variation that occurs just “by chance”). Suppose we were to take many samples of the same size, n.
We would like to use the sample data to construct intervals in such a way that µ is contained in most intervals
That is, we would like to be confident that the intervals contain µ
How do we construct our intervals to be the most confident that contains μ
such a way that µ is contained in most intervals
That is, we would like to be confident that the intervals contain μ
Constructing a 95% Confidence Interval
want to construct an interval that we are “95% confident” will contain µ
want to construct an interval that we are “95% confident” will contain µ
We start by taking a random sample from our population, and calculating its mean, ¯ x
This sample mean is our “best guess” at the value of µ, so it’s logical for us to center our interval at ¯ x
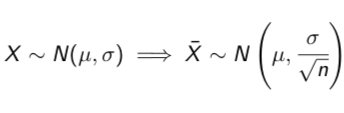
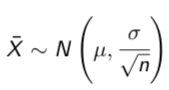
Recall that the 68-95-99.7 rule tells us that approximately 95% of values of ¯X fall within 2 standard deviations of µ
Since this means 95% of all sample means fall within 1.96 (i.e. 1.96 standard deviations) of µ
If ¯ x is within 1.96 standard deviations of µ, then µ is also within 1.96 standard deviations of ¯ x
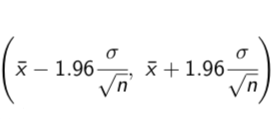
In other words: in 95% of all samples, µ falls between¯x - 1.96(σ/√n) and ¯x + 1.96(σ/√n)
This interval of values, 95% confidence interval for µ , is called the 95% confidence interval for µ
Recall that the 68-95-99.7 rule tells us that approximately 95% of values of ¯X fall within 2 standard deviations of µ (95% confidence interval)
Using the z table, we can be more exact: 95% of sample means fall within 1.96 standard deviations of µ
(this is because P(-1.96 < Z < 1.96) = 0.95)
Since this means 95% of all sample means fall within 1.96 (i.e. 1.96 standard deviations) of µ (95% confidence interval)
fall within 1.96 σ / √n
In other words: in 95% of all samples, µ falls between (95% confident)
¯x - 1.96(σ/√n) and ¯x + 1.96(σ/√n)
95% confidence interval for µ
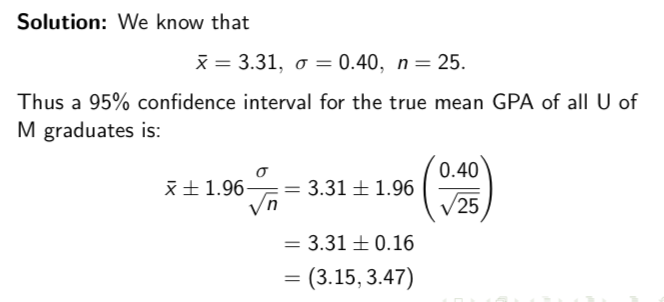
Example: Suppose it is known that GPA’s of University of Manitoba graduates follow a normal distribution with standard deviation σ = 0.40. A simple random sample of 25 graduates is selected, and their mean GPA is calculated to be 3.31. Construct a 95% confidence interval for the true mean GPA of all U of M graduates.
Using the formula 3.31 ± 1.96(0.40/√25), the confidence interval is (3.15, 3.47).
What are the two possibilities when you construct an 95% interval
The true value of µ actually falls within the interval we constructed (this is the case for 95% of all samples), OR
This is one of the rare samples (5%) that produces an interval that excludes the true value of µ
Do we know that our interval contains μ?
We don’t know if our constructed interval, (3.15, 3.47), contains µ, because we do not know what µ is. But we know that if we repeated this process over and over again, then 95% of the time, our constructed interval will contain µ. So we can be reasonably confident that our interval contains µ.
How can we become confident that our interval contains μ
repeated this process over and over again, then 95% of the time, our constructed interval will contain µ.
We interpret the 95% confidence interval for the true mean GPA of U of M graduates as follows:
“If we took repeated samples of 25 U of M graduates and constructed intervals in a similar manner, then 95% of all such intervals would contain the true mean GPA of all U of M graduates.”
How will we encounter confidence intervals in this course?
estimate ± margin of error
What is an estimate?
our best guess at the true value of the parameter of interest
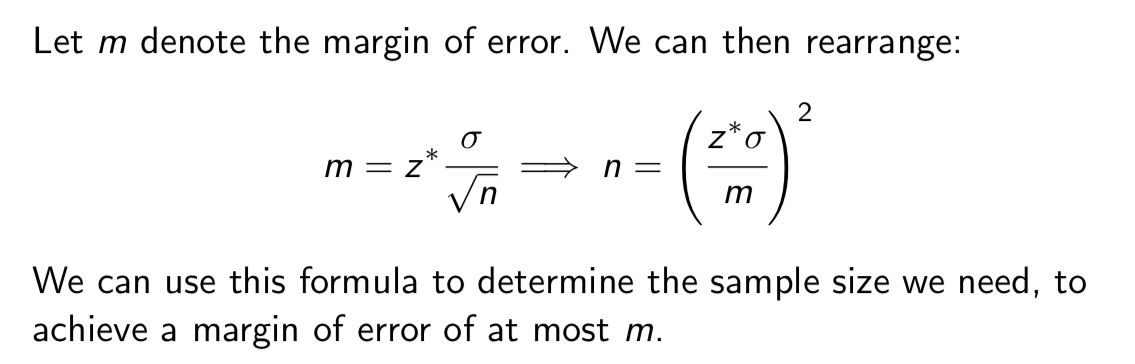
What is margin of error
reflects how accurate we believe our estimate to be
Confidence interval example (95% = estimate, margin of error)
The estimate is ¯ x, and the margin of error is 1.96 (σ/√n)
What is each confidence intervals associated with?
a confidence level C
what is confidence level C
GIves the probability that we construct an interval that contains the true value of the population mean µ
Example confidence level C:
For example, a 95% confidence interval has a confidence level of 95%
Do we choose the confidence level ourselves?
yes
Why do we choose the confidence levels ourselves?
Since our goal is typically to estimate a parameter with a high probability of being correct, we always use a high confidence level (usually 90% or higher)
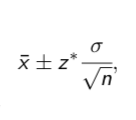
General level C confidence interval {form} for the population mean μ is
Where z* is the value of Z such that
P(-z* ≤ Z ≤ z*) = C
z* is the value of Z such that (general level C confidence intervals)
the area under the standard normal curve equals the confidence level.
P(-z* ≤ Z ≤ z*) = C
What are “critical values” of the distribution?
The values z* that mark o! a specific area under the standard normal curve
What can the critical values for a level C confidence level also be called?
upper critical value
Upper critical value (formula)
1 - C / 2
Find the critical value z* for a 90% confidence interval.
Solution: We need the value of z* so that
P(↔z→ < Z < z→) = 0.90
I.e. we need to catch the middle 90% of the standard normal distribution. To do this, we must leave out 5% in each tail of the distribution (10% in total)
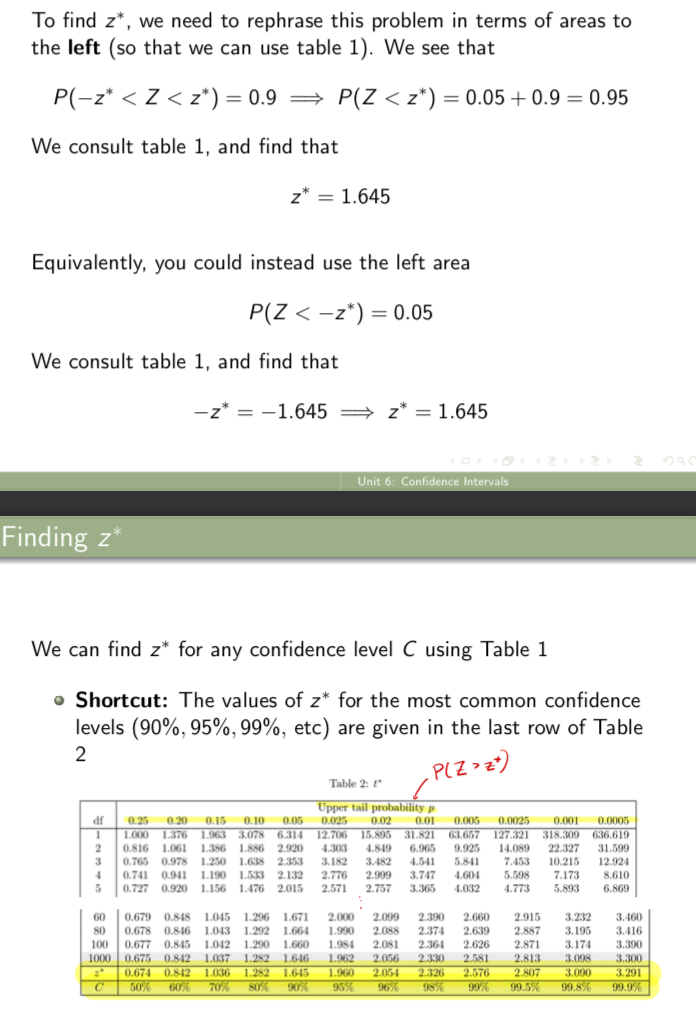
To find z*, we need to rephrase this problem in terms of areas to the left (so that we can use table 1).
We consult table 1, and find that
Equivalently, you could instead use the left area
P(Z < -z*) = 0.05
We consult table 1, and find tha
We can find z* for any confidence level C using Table 1
Shortcut: The values of z* for the most common confidence levels (90%, 95%, 99%, etc) are given in the last row of Table 2
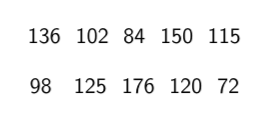
Example: The sentence times for people convicted of a particular crime follow a normal distribution with standard deviation σ = 28.7 months. The sentences (in months) of a random sample of ten people convicted of this crime are shown below:
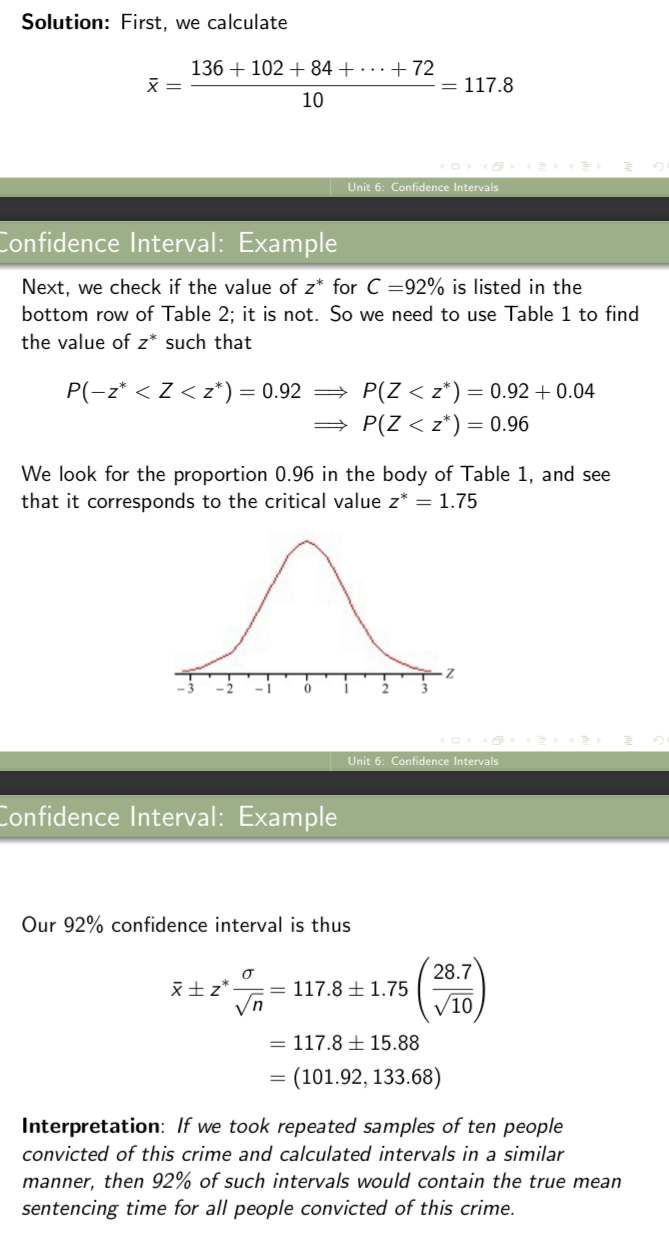
Find a 92% confidence interval for μ
Find a 99% confidence interval for µ
Find a 92% confidence interval for μ
Calculate the critical value z*
Determine the standard error of the mean
Construct the confidence interval using the formula
Find a 92% confidence interval for μ
Interpretation: we took repeated samples of ten people convicted of this crime and calculated intervals in a similar manner, then 92% of such intervals would contain the true mean sentencing time for all people convicted of this crime.
Find a 99% confidence interval for µ
We already calculated ¯ x = 117.8. From the bottom row of Table 2, we see that z→ = 2.576 for a 99% confidence interval. Thus
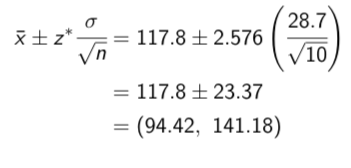
Notice: We see in this example that when the confidence level increases, the margin of error (and thus the length of the interval) also increases:
when C = 92%, m = 15.88 vs. when C = 99%, m = 23.37
when C = 92%, m = 15.88 vs. when C = 99%, m = 23.37
Thus if we increase the confidence level, we must sacrifice our precision of estimation
If we want to be more confident that our interval contains µ, then we have to expand the interval
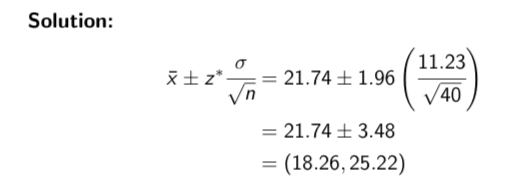
Example: We would like to estimate the true mean hourly wage of all employees of a large national company with 95% confidence. Suppose it is known that the population standard deviation is σ = $11.23 per hour. A random sample of 40 employees have a mean hourly wage of $21.74 per hour.
Find a 95% confidence interval for µ
Interpretation: If we were to take repeated samples of 40 employees and calculate intervals in a similar manner, then 95% of such intervals would contain the true mean hourly wage.
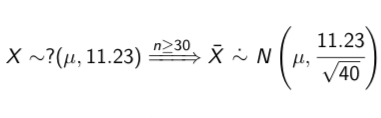
Notice Wage example
we were not told that wages follow a normal distribution (in fact, this is likely not the case: wages typically follow right skewed distributions)
However, our use of the normal distribution is justified because our sample size is high enough to apply the Central Limit Theorem:
Thus the 95% confidence level is approximate
What is best in an ideal world
Always like to have a high confidence level and obtain a narrow confidence interval
why is having a high confidence level and obtain a narrow confidence interval impossible or merely impossible?
Unfortunately, we already saw that there is a trade-off between the confidence level and the margin of error (if we increase the confidence level, then the margin of error increases as well)
is there a way we can reduce the length of the interval without sacrificing our precision of estimation?
Yes, by increasing the sample size or using more precise measurement methods, we can reduce the interval length while maintaining estimation precision.
Confidence level vs. Margin of error example
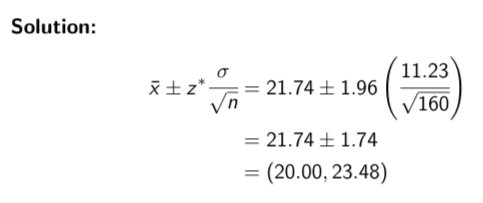
In our previous example, suppose we had selected a sample of 160 employees (instead of 40), and that we had calculated the same sample mean hourly wage of $21.74. Find a 95% confidence interval for µ.
This example shows that a higher sample size results in a lower margin of error (and hence a narrower confidence interval)
when n = 40, m = 3.48 vs when n = 160, m = 1.74
Confidence level vs. Margin of error example (part 2)
In our previous example, suppose we had selected a sample of 160 employees (instead of 40), and that we had calculated the same sample mean hourly wage of $21.74. Find a 95% confidence interval for µ.
Interpretation: If we took repeated samples of 160 employees and calculate intervals in a similar manner, then 95% of such intervals would contain the true hourly mean wage.

when n = 40, m = 3.48 vs when n = 160, m = 1.74
we see that taking a sample that is four times larger results in a margin of error that is only half as large
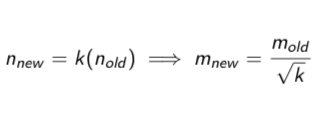
Effect of increasing sample size (In general)
Increasing the sample size by a factor of k reduces the margin of error by a factor of √k
In other words: multiplying the sample size by k means that the margin of error will be divided by √k
Example increasing sample size
If we take a sample with 9 times more individuals (i.e. we increase the sample size by a factor of k = 9)
our margin of error will be only one third its original value (i.e. reduced by a factor of √k =√9 = 3)
Can we always reduce the margin of error by increasing our sample size?
Yes
As is always the case in statistics, a higher sample size leads to more accurate results
VERY very very very very BIG warning:
The interpretation we’ve seen in examples for the confidence interval is the ONLY correct interpretation
The next few slides show common misinterpretations of confidence intervals. They are all in the context of the 95% confidence interval for the true mean wage of employees at a large company, from slide 31. Recall that our confidence interval for this example was (20, 23.48), and the correct interpretation of this interval was
If we took repeated samples of 160 employees and constructed intervals in a similar manner, then 95% of such intervals would contain the true hourly mean wage.
Mis-interpretations of confidence levels
Common errors in understanding confidence intervals.
general note (Mis-interpretations of confidence levels)
the interpretation of a confidence interval should never mention the endpoints of the interval we actually calculated.
Our confidence is not in this one specific interval: our confidence is in the formula.
Misinterpretation example 1
Approximately 95% of all employees earn between $20.00 and $23.48 per hour”
Why this is wrong: The interval estimates the true mean wage, µ. It does not apply to individual wages.
Also, the interpretation should never mention the endpoints of the calculated interval.
Misinterpretation example 2
“If we took repeated samples of 160 employees and constructed intervals in a similar manner, then 95% of all intervals would contain the sample mean wage.”
Why this is wrong: The sample mean ¯ x is always contained in the confidence interval, since we center the interval at ¯ x. The confidence interval estimates the population mean µ, not the sample mean.
Misinterpretation example 3
“About 95% of all samples of 160 employees have means between $20.00 and $23.48 per hour”
Why this is wrong: The interval estimates the population mean µ: it does not apply to other potential values of ¯ x.
Also, the interpretation should never mention the endpoints of the calculated interval.
Misinterpretation example 4
“The probability that µ is between $20.00 and $23.48 is 0.95”
Why this is wrong: The population mean has a fixed value (even though we don’t know what that value is!).
If the true value of µ is actually between $20 and $23.48: then the probability that µ is between those values is 100%
If the true value of µ is not actually between $20 and $23.48: then the probability µ is between those values is 0%
We must be careful to make our probability statements in terms of the interval, rather than in terms of the parameter.
Also, the interpretation should never mention the endpoints of the calculated interval.
The population mean has a fixed value (even though we don’t know what that value is!). {misinterpretation example 4)
If the true value of µ is actually between $20 and $23.48: then the probability that µ is between those values is 100%
If the true value of µ is not actually between $20 and $23.48: then the probability µ is between those values is 0%
We must be careful to make our probability statements in terms of the interval, rather than in terms of the parameter.
What does the length of a confidence interval depend on
On the sample size, but not at all on the population size
For a given sample size, our estimate will be just as precise, regardless of the population size
Example (sample size vs. Population size)
Previously, we wanted to estimate the mean GPA µ for all U of M graduates. Suppose that we instead wanted to estimate the mean GPA µ for all University of Winnipeg graduates.
Suppose we take a sample of 25 students from U of W(the same sample size we took for the U of M). The U of W has a population of approximately 10, 000 students, and the U of M has a population of approximately 30, 000 students.
Assuming equal standard deviations, a 95% confidence interval for µ for UW will have the same margin of error as that for UM, even though the UM population is three times greater
Sample size determination
The process of calculating the number of observations or data points needed to accurately estimate a population parameter with a specified level of confidence and margin of error.
what should we always consider when collecting a sample
the purpose of our data collection
Often, we would like to achieve a certain precision of estimation (i.e. a particular margin of error).
How do we properly accomplish/ consider the purpose of our data set and achieve a certain precision of estimation (i.e. a particular margin of error).
To accomplish this, we need to find out how large our sample size needs to be
Sample size determination: example 1
Example: Suppose it is known that the amount of time adults sleep at night follows a normal distribution with standard deviation 1.27 hours.
We would like to take a sample of people large enough to estimate the true mean time adults sleep at night to within 0.5 hours with 98% confidence. How many people do we need to sample in order to achieve this?
So we need a minimum sample of 35 people
always round up!
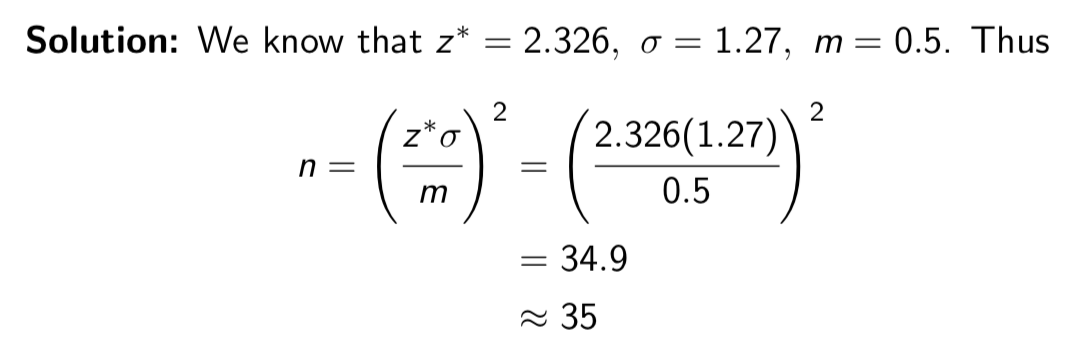
Notice sample size determination (rounding up)
we ALWAYS round up: we calculated that we’d need a sample of at least 34.9 people. A sample of 34 people would be too small.
Sample size determination: example 2
Example: Suppose it is known that the amount of time adults sleep at night follows a normal distribution with standard deviation 1.27 hours.
Suppose we decide that a margin of error of 0.5 hours is too large, and we would like to estimate the true mean time adults sleep at night to within 0.25 hours with 98% confidence (i.e. we are cutting the margin of error in half). How many people do we need to sample in order to achieve this?
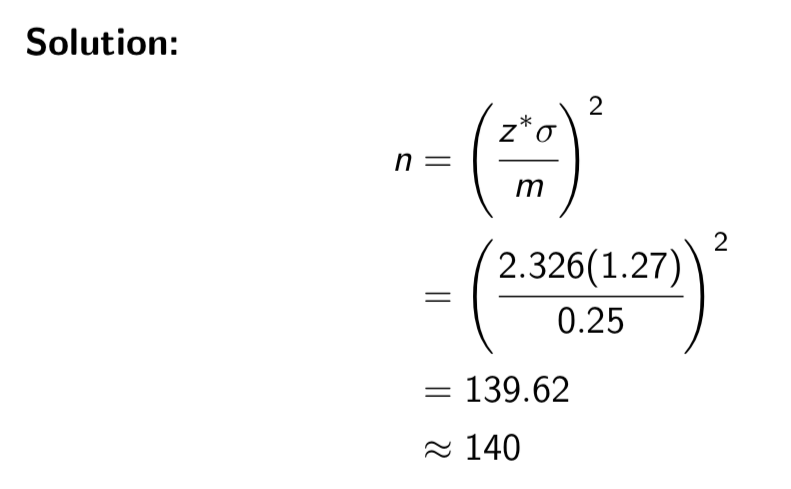
Notice effect of decreasing margin of error
when we cut the margin of error in half (i.e. reduce it by a factor of 2), we require 4 times the sample size
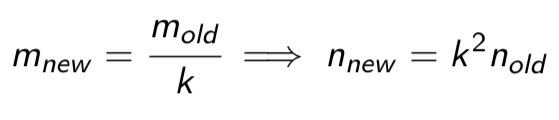
What do we do if we want to reduce the margin of error by a factor or k
we need a sample that is k² times as large
In other words: if we want to divide the margin of error by k, we need a sample size that is k2 times the original sample size
Effect of decreasing margin of error
Example: if we want to reduce the margin of error to one third it’s original value (i.e. reduce it by a factor of k = 3)
Then we need k2 = 32 = 9 times more individuals in our sample
When does our formula for confidence only hold?
if the data were collected using a SRS.
Is there a correct way to do proper inference using data that way collected haphazardly?
No, Good formulas cannot rescue us from poor sampling methods!
Is confidence interval strongly effected/ influenced by outliers?
Yes
Since the sample mean is strongly influenced by outliers, the confidence interval is also strongly influenced by outliers
What does the margin of error cover?
covers only random sampling errors
What is an error?
is a reflection of only the inherent “chance variation” in the population.
It does not mean that we made a mistake: it does not reflect any degree of undercoverage, nonresponse, or other forms of bias
Does an error mean that we made a mistake?
It does not mean that we made a mistake: it does not reflect any degree of undercoverage, nonresponse, or other forms of bias
We are using the true population standard deviation ω in our calculations
In practice, this is not a realistic assumption
We will see in Unit 8 a proper method for constructing confidence intervals when we only have the sample standard deviation s
We are making this unreasonable assumption now to establish the framework for building confidence intervals