Exam 2
 View linked note
 Call Kai
 Learn
Learn Practice Test
 Spaced Repetition
 Match
Match Flashcards
 Knowt Play
1/26

There's no tags or description
Looks like no tags are added yet.
Name | Mastery | Learn | Test | Matching | Spaced | Call with Kai | Chat |
|---|
No analytics yet
Send a link to your students to track their progress
27 Terms
Measure of central tendency
A typical value for a data set.
Measure of dispersion
How different the data points are from one another.
Mean
Central tendency measure for interval data; this is the average.
Median
Central tendency measure for ordinal and interval data; the middle data point.
Mode
Central tendency measure for nominal, ordinal, and interval data; the most frequent value.
Range
Dispersion measure for ordinal and mostly interval data; the span of the data.
Standard deviation
Dispersion measure for interval data; how much a typical data point differs from the mean.
When to use the median instead of the mean
Use the median when there are extreme data points.
Measure of association
Describes statistical strength of the relationship between two or more variables.
Correlation
Tells you the strength of the relationship between two variables.
Levels of correlation
Weak, strong, or no correlation; can be positive or negative.
Perfect positive correlation 1.0

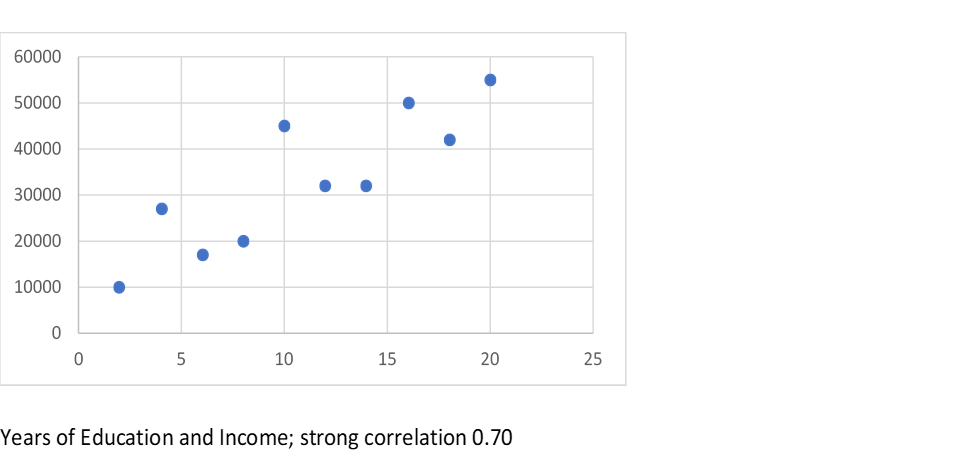
Strong positive correlation .70
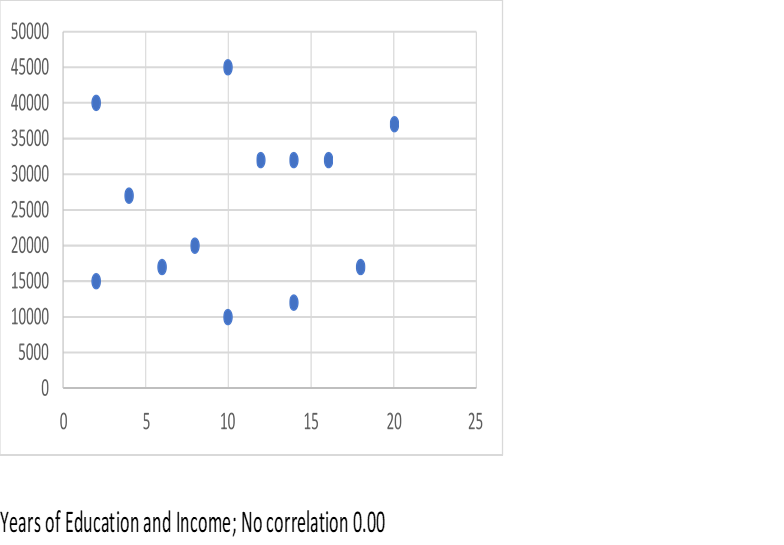
No correlation 0
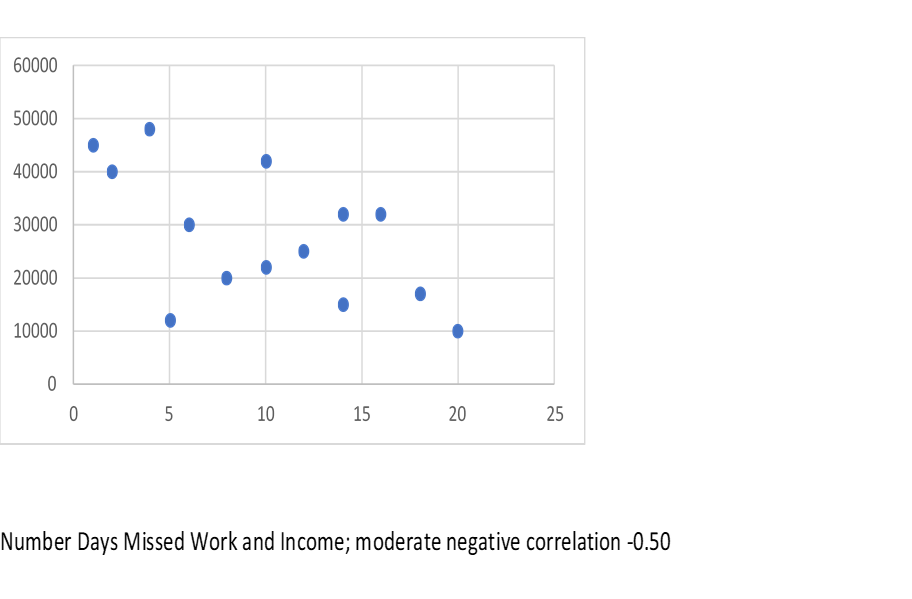
Moderate negative correlation -0.50
Test of significance
Determines if results could simply be due to chance.
Null hypothesis
The negation of the substantive hypothesis.
Substantive hypothesis
The hypothesis you think is correct.
Criterion of significance level
Allows the evaluation of the p-value and is typically set to .05.
How to arrive at the criterion of significance level
Determining the cost of accepting the substantive hypothesis and being wrong compared to the cost of accepting the null hypothesis and being wrong
Comparing the criterion of significance level to p-value
If p-value < significance criterion, accept substantive hypothesis; if p-value > criterion, accept null hypothesis.
Factors affecting p-values
Larger sample sizes lead to smaller p-values; the stronger the correlation between the variables, the smaller the p-value; the type of test
Statistical significance
Unlikely that results were due to chance; findings are consistent across the population.
Practical significance
Whether the magnitude of the difference is relevant is a function of interpretation
Type I error
Incorrectly accepting the substantive hypothesis.
Type II error
Incorrectly accepting the null hypothesis.
Trade-off between Type I and Type II error
Reducing Type I error by decreasing the criterion increases Type II error. Reducing Type II error by increasing the criterion increases Type I error.