RM2 Final Exam
1/57
There's no tags or description
Looks like no tags are added yet.
Name | Mastery | Learn | Test | Matching | Spaced | Call with Kai |
|---|
No analytics yet
Send a link to your students to track their progress
58 Terms
Explain the difference between an IV and DV.
IV is what is being manipulated
DV is what is being measured
What is a confounding variable? Why is it problematic in experiments?
A confounding variable is a controllable or uncontrollable factor that could potentially skew the results or give an alternate explanation of the relationship found. Confounds are problematic because it might discredit a study’s internal validity if not controlled for.
Explain internal, external, and construct validity.
Internal - ability to establish a causal relationship, meaning the cause happened before the effect and the researched cause is what is actually causing the effect
External - ability to generalize to the public and accurately represent the population
Construct - if the experiment actually measures what it is intending to study
Pros and cons of within-subjects experiments
Pros - requires less participants, individuals act as their own control
Cons - smaller population could threaten external validity, possibility for fatigue and familiarity if there’s no control for order of effects
Pros and cons of between-subjects experiments
Pros - higher external validity from large sample, no need for order of effects
Cons - requires more participants and more money/time, no control for individuality which could effect the means
A research study finds that a group of participants who received relaxation training had lower exam anxiety scores than a group who did not receive training. However, the researcher suspects that the difference between groups may be caused by the fact that the participants in one group are generally smarter than those in the other. This study has a problem with ____.
correlational validity
internal validity
external validity
construct validity
internal validity
A researcher designs a study to determine whether female preschoolers prefer sweetened or unsweetened cereal. The researcher first presents the children with the sweet cereal and measures how much they ate. Later, during the same session, the researcher presents the children with the unsweetened cereal and measures how much they ate. The researcher finds that the group of preschoolers ate more of the sweetened cereal and therefore prefers the sweetened cereal. Is this conclusion justified?
No; this conclusion is not justified. Individual differences could threaten the results.
No; this conclusion is not justified. An order effect could threaten the results.
No; this conclusion is not justified. Children’s gender could threaten the results.
Yes; this conclusion is justified.
No; this conclusion is not justified. An order effect could threaten the results.
*Dr. Learner wants to examine how much students in her introductory psychology class are learning. In order to test how much knowledge they gain throughout the semester she administers a pre-test on the first day of class to see how much students already know. Then she administers the same test as the students’ final exam. She finds that students performed significantly better on the final than they did on the pre-test. Dr. Learner concludes she must be a good teacher because the students learned a lot during the semester. Which of the following is the most serious threat to internal validity in this study?
Instrumentation
Attrition
Regression toward the mean
Testing effect
Testing effect
What is the consequence of a Type II error?
Concluding that a treatment has no effect when it really has no effect
Concluding that a treatment has no effect when it really does
Concluding that a treatment has an effect when it really does
Concluding that a treatment has an effect when it really has no effect
Concluding that a treatment has no effect when it really does
A(n) _____ test has more statistical power; however, a(n) _____ is more conservative.
effect-size; hypothesis
two-tailed; one-tailed
one-tailed; effect-size
one-tailed; two-tailed
one-tailed; two-tailed
*Which of the following best describes the relationship between sample size and significance testing?
In large samples even small effects can be significant
Large effects tend to be significant only in large samples
Large effects tend to be significant only in small samples
In small samples only small effects will be significant
In large samples even small effects can be significant
*If your hypothesis test results were not statistically significant (i.e., you failed to reject the null hypothesis), but your measure of effect size is relatively large, what does this suggest about the study you conducted?
Your study had low power and if you ran the study again with a larger sample size the hypothesis test may be significant
Your study resulted in a Type I error
You made a mistake in the conclusion of your hypothesis test
The findings of your study may have an effect statistically, but this effect may not be very meaningful if applied to a real world setting
Your study had low power and if you ran the study again with a larger sample size the hypothesis test may be significant
Hypothesis testing indicates:
what the size of an effect is.
whether two distributions overlap at all.
what results are significant, but no details regarding the importance of the significant results.
which group differences are of practical importance.
what results are significant, but no details regarding the importance of the significant results
The assumption of homogeneity of variance is met when
The variances in different groups are significantly different
The underlying population distribution is normally distributed
The variances in different groups are approximately equal
The variances across groups is proportional to the means of those groups
The variances in different groups are approximately equal
In null hypothesis significance testing we typically set the probability of making a Type I error known as alpha (α) at
p = .10
p = .05
p = .50
p =.001
p = .05
Unnithan, Houser, and Fernhall (2006) were interested in whether playing the game Dance Dance Revolution (DDR) affected the heart rate of overweight and non-overweight adolescents differently. A group of 22 adolescents, 10 classified as overweight and 12 as not overweight played DDR for 12 minutes, during which time the researchers measured each participant's heart rate. Which statistical test should the researchers use to analyze their data?
binomial test
independent-samples t test
dependent-samples t test
single-sample t test
independent-samples t test
A Type I error occurs when
The data we recorded is different from the data collected
We conclude that there is an effect in the population when in fact there is not
We conclude that there is not an effect in the population when in fact there is
We conclude that the test statistic is significant when in fact it is not
We conclude that there is an effect in the population when in fact there is not
A researcher measured a group of people’s physiological reactions while watching horror films and compared them to when the same people were watching comedy films. The resulting data were normally distributed. What test should be used to analyze the data?
Independent samples t test
Mann-Whitney test
Binomial test
Paired samples t test
Paired samples t test
A sports psychologist is interested in whether athletes tend to train harder after a win or a loss. To study this, she simulates winning and losing situations in her laboratory. She exposes 28 athletes to each situation and assesses the intensity of their training routine after each experience. How might she control the confounding variable of order effects in this within-groups design?
She could use a different measure to assess the training routine after each of the two situations; this would prevent participants from knowing what is being measured.
She could use different participants in each group, but still use within-subjects statistics.
She could expose half of the athletes to the winning situation first and the other half to the losing situation first.
She could separate the assessments in time, perhaps waiting a month before having participants experience the second manipulation.
She could expose half of the athletes to the winning situation first and the other half to the losing situation first.
Which of the following research situations is most likely to use an independent-samples t test to evaluate the results?
Evaluate the effectiveness of a pain reliever by measuring how much pain is reduced after taking the medication
Evaluate the development of verbal skills between age two and age three for a single sample of girls
Evaluate the difference in self-esteem between student athletes and non-athletes
Evaluate the effectiveness of a cholesterol medication by comparing cholesterol levels before and after the medication
Evaluate the difference in self-esteem between student athletes and non-athletes
*When we report statistics, what does our p value represent?
p is the probability that the results are not due to chance, the probability that the null hypothesis (H0) is false
p is the probability that the results would be replicated if the study was conducted a second time
p is the probability that the results are due to chance, the probability that the null hypothesis (H0) is true
p is the probability of observing a test statistic at least as extreme/rare as the one we found if there was no effect in the population (i.e., the null hypothesis were true)
p is the probability of observing a test statistic at least as extreme as the one we found if the null hypothesis were true
*Statistical power is a measure of the ability to reject the null hypothesis when:
there are no significant differences.
the sample size cannot be increased.
it is true.
it is false.
it is false.
*Other things being equal, compared to the paired-samples t test, the independent-samples t test
Has more power to find an effect
Has less power to find an effect
Has the same amount of power, the data are just collected differently
Is less robust to violations of assumptions
Has less power to find an effect
An independent t test evaluates ___________while a paired samples t test evaluates _________.
raw scores; standard deviations
difference between means; mean difference scores
mean difference scores; difference between means
within-subjects designs; between-subjects designs
difference between means; mean difference scores
Explain the difference between main effects, interactions, and simple main effects.
Main effects - effect of one IV on DV ignoring other IVs
Interaction - combined effect of IVs on DV
Simple main effects - effect of one IV at each level of the other IV
The university was interested in the effects of different statistics classes on aggression in undergraduates. Following one of three types of statistic classes (workshops, lectures and an exam) six unique students per condition were placed in a relaxation room in which there was a dartboard with the face of their instructor pinned to it. The number of darts that each student threw at the dartboard was measured.
What is (are) the IV(s) and levels?
IV1 - type of statistic class (workshop, lecture, and exam)
The university was interested in the effects of different statistics classes on aggression in undergraduates. Following one of three types of statistic classes (workshops, lectures and an exam) six unique students per condition were placed in a relaxation room in which there was a dartboard with the face of their instructor pinned to it. The number of darts that each student threw at the dartboard was measured.
What is the statistical null hypothesis?
Students with exams and lectures will be more aggressive than those with workshop classes.
Students with exams will be more aggressive than students in the other groups.
There will be a difference, on average, between aggression levels of the three courses.
There will be no difference, on average, between aggression levels of the three courses.
There will be no difference, on average, between aggression levels of the three courses.
The university was interested in the effects of different statistics classes on aggression in undergraduates. Following one of three types of statistic classes (workshops, lectures and an exam) six unique students per condition were placed in a relaxation room in which there was a dartboard with the face of their instructor pinned to it. The number of darts that each student threw at the dartboard was measured.
What is the statistical research/alternative hypothesis?
There will be a difference, on average, between aggression levels of the three courses.
The lectures will be more aggressive than those with workshop classes.
ms will be more aggressive than students in the other groups.
There will be no difference, on average, between aggression levels of the three courses.
There will be a difference, on average, between aggression levels of the three courses.
A researcher hypothesized that physical attractiveness produces higher ratings of intelligence, but only for women. To test this, people who trained on rating attractiveness categorized images of men and women as unattractive, neutral, or attractive. These images were then presented with a job application that was the same for all conditions. Participants were randomly assigned to read and evaluate one of the job applications (with its corresponding image) on perceived intelligence using a seven point Likert scale. The higher the score, the more positive the rating.
What is (are) the independent variable(s) and the levels?
IV1 - physical attractiveness (unattractive, neutral, and attractive)
IV2 - gender (men and women)
A researcher hypothesized that physical attractiveness produces higher ratings of intelligence, but only for women. To test this, people who trained on rating attractiveness categorized images of men and women as unattractive, neutral, or attractive. These images were then presented with a job application that was the same for all conditions. Participants were randomly assigned to read and evaluate one of the job applications (with its corresponding image) on perceived intelligence using a seven point Likert scale. The higher the score, the more positive the rating.
What is (are) the statistical null hypothesis (es)?
1 - There will be no effect of attractiveness on intelligence rating.
2 - There will be no effect of image gender on intelligence rating.
3 - There will be no combined effect of attractiveness and image gender on intelligence rating.
A researcher hypothesized that physical attractiveness produces higher ratings of intelligence, but only for women. To test this, people who trained on rating attractiveness categorized images of men and women as unattractive, neutral, or attractive. These images were then presented with a job application that was the same for all conditions. Participants were randomly assigned to read and evaluate one of the job applications (with its corresponding image) on perceived intelligence using a seven point Likert scale. The higher the score, the more positive the rating.
What is (are) the statistical research/alternative hypotheses?
1 - There will be an effect of attractiveness on intelligence rating.
2 - There will be an effect of image gender on intelligence rating.
3 - There will be a combined effect of attractiveness and image gender on intelligence rating.
A researcher was interested in examining the effects of stress and emotional valence of words on participants’ ability to recall words. She randomly assigned participants to either a stress condition where participants were interviewed about a recent stressful experience or a control condition where participants were interviewed about a recent everyday experience. Then all participants were given six separate lists of words to learn. Two word lists included positive words, two lists included negative words, and two lists included neutral words. After a brief distractor task, participants were given a sheet of paper and asked to write down as many words as they could remember. The student then compared the mean number of words recalled across all three lists and between the stress groups.
How many factors were included in this researcher’s study?
4
2
1
3
2
In the 2 x 2 factorial experiment, the primary goal is to
Examine the four overall main effects
Examine the four simple main effects
Examine the two overall main effects
Examine two main effects and the interaction
Examine two main effects and the interaction
What can be concluded if a researcher rejects the null hypothesis after using conducting a one-way ANOVA?
There is a difference between means that one expects just by chance.
There is no difference between means, which is what one would expect if the null hypothesis were true.
There is no difference between means.
There is a difference between means that is larger than one would predict if the null hypothesis were true.
There is a difference between means that is larger than one would predict if the null hypothesis were true.
What value should the value of the F-ratio for ANOVA be near if the null hypothesis is true (i.e., the factor or independent variable does not have an effect)?
0.00
3.00
It depends on the degrees of freedom in the denominator
1.00
1.00
In a one-way ANOVA, when F is significant:
one fails to reject the null hypothesis.
the values of the means that are farthest apart are the only ones that are significant.
the values of the means that are closest together are the only ones that are significant.
one does not know which specific means differ significantly.
one does not know which specific means differ significantly

A researcher conducted a factorial design to examine the effect of arousal (low versus high) and task difficulty (easy versus hard) on performance on math problems. Participants were randomly assigned to either a low or high arousal condition. In addition, each participant was randomly assigned to either a set of 10 easy math problems (easy task difficulty) or a set of 10 hard math problems (hard task difficulty). The dependent variable was the number of math problems answered correctly out of 10.
The researcher plotted the different groups means in a line graph to examine the potential effects of arousal and task difficulty on math problem performance. The figure is presented below.
Based on the figure above, which statement provides the BEST interpretation of the effects found in this study?
The figure depicts a main effect of arousal and a main effect of task difficulty
The figure depicts a main effect of arousal
The figure depicts an arousal by task difficulty interaction
The figure depicts a main effect of task difficulty
The figure depicts a arousal by task difficult interaction
A researcher wants to examine people's enjoyment of pet types by having different people act as “foster owners” for four different types of family pets: dogs, cats, birds, and fish. The participants will foster one type of pet for one week and a scale measure will be used to assess how much they enjoyed having a pet. Which research design should be used?
one-way between-groups ANOVA
one-way within-groups ANOVA
paired-samples t tests
correlation
one-way between-groups ANOVA
In a one-way ANOVA, a post hoc test is needed when a researcher:
finds the ANOVA is significant and there are more than two groups.
fails to reject the null hypothesis in an ANOVA.
has an a priori prediction about which group means will differ.
rejects the null hypothesis when performing an independent-groups t test.
finds the ANOVA is significant and there are more than two groups
In an experiment examining the effects of an easy or hard task for women and men, the factors are:
Women and men
Women, men, easy, and hard
Easy and hard
Task difficulty and gender
task difficult and gender
Obtaining a significant interaction means both factors A and B have significant main effects.
True
False
False
How many separate groups of participants (i.e., how many conditions are there?) would be needed in a 3 x 4 between-subjects ANOVA?
12
4
7
3
12
Any ANOVA with at least two independent variables is a _____.
between-groups ANOVA
within-groups ANOVA
factorial ANOVA
one-way ANOVA
factorial ANOVA
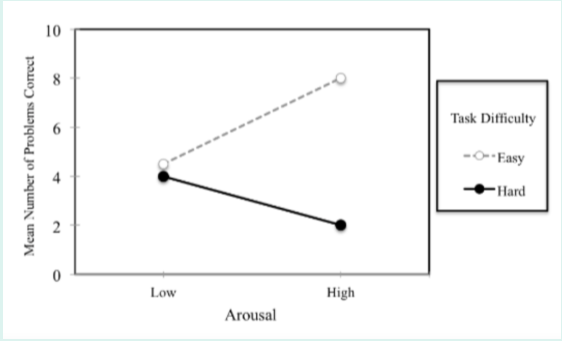
A researcher conducted a factorial design to examine the effect of arousal (low versus high) and task difficulty (easy versus hard) on performance on math problems. Participants were randomly assigned to either a low or high arousal condition. In addition, each participant was randomly assigned to either a set of 10 easy math problems (easy task difficulty) or a set of 10 hard math problems (hard task difficulty). The dependent variable was the number of math problems answered correctly out of 10.
The researcher plotted the different groups means in a line graph to examine the potential effects of arousal and task difficulty on math problem performance. The figure is presented below.
Based on the figure above, which statement provides the BEST interpretation of the findings of this factorial study?
The findings showed that the effects of task difficulty depended on the arousal condition. Specifically, participants performed better on the hard task than the easy task when arousal was low, but performed better on the easy task than the hard task when arousal was high
The findings showed that participants performed better when arousal was low than when it was high regardless of the difficulty of the task
The findings showed that participants performed better on the easy task than hard task, while arousal level did not affect performance
The findings showed that the effects of task difficulty depended on the arousal condition. Specifically, high arousal appeared to facilitate better performance for an easy task, but hinder performance for a difficult task
The findings showed that the effects of task difficulty depended on the arousal condition. Specifically, high arousal appeared to facilitate better performance for an easy task, but hinder performance for a difficult task.
A researcher was interested in examining the effects of stress and emotional valence of words on participants’ ability to recall words. She randomly assigned participants to either a stress condition where participants were interviewed about a recent stressful experience or a control condition where participants were interviewed about a recent everyday experience. Then all participants were given six separate lists of words to learn. Two word lists included positive words, two lists included negative words, and two lists included neutral words. After a brief distractor task, participants were given a sheet of paper and asked to write down as many words as they could remember. The student then compared the mean number of words recalled across all three lists and between the stress groups.
Which of the following research questions would the researcher be able to examine by analyzing the results of this study?
Did the stress condition have an effect on the number of words recalled?
Do the number of words correctly recalled differ for positive, negative, and neutral word lists?
Do the number of words correctly recalled for positive, negative, and neutral word lists differ depending on if they were in the stress condition or control condition?
All of these research questions can be examined by analyzing the results of this study
All of these research questions can be examined by analyzing the results of this study
In ANOVAs, the less overlap there is among the different sample distributions, the:
more confident one is that the samples represent true differences in the population.
less confounding variability there is in the groups.
less likely it is that one will reject the null hypothesis.
less confident one is that the samples represent true differences in the population.
more confident one is that the samples represent true differences in the population
In a factorial ANOVA, if there is a significant interaction:
the interpretation of significant main effects is independent of the interaction.
at least one of the main effects is significant.
both of the main effects are also significant.
the interpretation of any significant main effects should be interpreted with caution or not at all depending on the interaction.
the interpretation of any significant main effects should be interpreted with caution or not at all depending on the interaction
An experiment is a factorial design if
Participants are randomly assigned to conditions
It has more than one dependent variable
It has four or more groups
It has more than one independent variable
It has more than one independent variable
A researcher conducted a factorial design to examine the effect of arousal (low versus high) and task difficulty (easy versus hard) on performance on math problems. Participants were randomly assigned to either a low or high arousal condition. In addition, each participant was randomly assigned to either a set of 10 easy math problems (easy task difficulty) or a set of 10 hard math problems (hard task difficulty). The dependent variable was the number of math problems answered correctly out of 10.
How would you characterize this factorial design?
A 2 x 2 (Two factors with four overall levels) repeated measures factorial design
A 2 x 2 (Two factors with two levels each) between-subjects factorial design
A 4 x 2 (Four factors with two levels each) mixed factorial design
A 2 x 4 (Two factors with four overall levels) between-subjects factorial design
2×2 (two factors with two levels each) between-subjects factorial design
The F ratio is calculated by:
dividing within-groups variance by between-groups variance.
dividing between-groups variability by within-groups variability.
dividing between-groups variance by within-groups variance.
averaging the differences among sample means and sample variances.
dividing between-groups variance by within-groups variance
The advantage of a factorial design compared to running two separate single-factor designs is the ability to
Evaluate the main effects
Check manipulation
Evaluate the interaction
Replicate findings
Evaluate the interaction
A researcher is evaluating the changes in performance that occur during a six-week training program. Participants are observed at the beginning and at the end of the program and the researcher rates each individual’s level of performance.
Which of the following be the appropriate statistical test for evaluating the effect of the training program on performance?
One-way between-subjects ANOVA
Repeated-measures ANOVA
Independent-samples t-test
Paired-samples t-test
Paired-samples t test
The assumptions of ANOVA are that samples are selected:
randomly, the population distribution is normal, and the samples come from populations with equal variances.
randomly and that the samples come from populations with unequal variances.
randomly from populations that are heteroscedastic and normally distributed.
randomly and the population distribution is normal.
randomly, the population distribution is normal, and the samples come from populations with equal variances
For an experiment comparing more than two treatment conditions, why should you use analysis of variance (ANOVA) rather than conducting multiple separate t tests?
There is no difference between the two options and the choice is a matter of preference
Conducting several t tests would inflate the overall risk of a Type I error
Separate t tests would require substantially more computations
A test based on variances is more sensitive than a test based on means
Conducting several t tests would inflate the overall risk of a Type I error
Imagine you were interested in examining how stress influences memory. To examine this, you have one sample of ten participants learn words in a low stress condition, a second sample of ten participants learn words in a moderate stress condition, and a third sample of ten participants learn words in a high stress condition. After learning the words, each sample is given a memory test on the words.
Which of the following would be appropriate statistical test for evaluating the effect of stress on memory in your experiment?
Repeated-measures ANOVA
Paired-samples t-test
Independent-samples t-test
One-way between-subjects ANOVA
One-way between-subjects ANOVA
When researchers use ANOVAs to report results of clinical studies that include participants recruited from a university hospital, they typically violate the assumption of random selection. How does this action affect the conclusions of the study?
The external validity is low, and they cannot generalize their results beyond the sample.
The test is robust, and they can generalize their results beyond the sample.
The external validity is low, but they don't need to report violations of assumptions.
The results are completely worthless and should not be reported.
The external validity is low, and they cannot generalize their results beyond the sample.
For a one-way ANOVA comparing three treatment conditions, what is the alternative/research hypothesis (H1)?
The means for the two treatment conditions are greater than the control condition mean
At least one of the three population means is different from another mean
All three of the population means are different from each other
There are no differences between any of the population means
At least one of the three population means is different from another mean
It is advantageous to use a within-groups ANOVA compared to a between-groups ANOVA because with a within-groups ANOVA:
there is a greater variance of scores.
we have reduced error because the same participants contribute to each condition of the study.
you are more likely to discover a research result that has cause-effect implications.
we are likely to have to include more research participants in the study.
we have reduced error because the same participants contribute to each condition of the study