Envirothon CI B K2: Watershed Planning
 Call Kai
 Learn
Learn Practice Test
 Spaced Repetition
 Match
Match Flashcards
 Knowt Play
1/39

There's no tags or description
Looks like no tags are added yet.
Name | Mastery | Learn | Test | Matching | Spaced | Call with Kai | Chat |
|---|
No analytics yet
Send a link to your students to track their progress
40 Terms
Mississippi watershed plan - Basin Management Approach (BMA)
collaborate with Basin Team members, stakeholders, and resource agency partners to target priority watersheds throughout state
process used to prioritize/target watersheds for NPS pollution management
implementation + measuring success on smaller scales (watersheds classified at hydrologic unit code (HUC) 12 scale or smaller (<25,000-30,000)) instead of focusing on entire river basins (HUC 8 scales)
1468 HUC 12 watersheds —> rely on partnerships established through BMA to help identify watersheds of interest for state —> work with Basin Teams to identify “priority” watersheds —> target for NPS pollution management projects funded by Section 319 grant funds
watersheds need to be identified as “priority” and listed in MS NPS Program Plan to be funded by Section 319 —> develop statewide list of watersheds of interest for WQ management every 5 years with state/federal resource agency partners, education institutes, non-profit gov’t orgs, local partners/stakeholders —> list reviewed/revised annually
process used to plan for watershed restoration and protection
Watershed Implementation Team (WIT) formed for each watershed identified as priority —> local stakeholders, resource agency partners, other interested parties located within watershed boundaries
WIT gathers necessary information (WQ assessments, stressor identification studies, WQ modeling, Total Maximum Daily Loads (TMDLs)) and write a holistic Watershed-based Plan (WBP)
primary focus on WQ —> plan on how conservation/education activities can help achieve WQ improvement goals
identify all sources of water pollution possible (point/non-point source; regulated/unregulated)
outline potential solutions for NPS pollution and restoring/protecting desgnated uses for watershed
must include “nine key elements” identified by EPA to be eligible for Section 319 grant —> required to include by MS NPS Program
decide types/location of restoration/protection activities to plan for watershed; plan WQ restoration objectives/pollutant load reduction goals
watershed planning
helps address WQ problems in a holistic manner by fully assessing potential contributing causes/sources of pollution; prioritizes restoration and protection strategies to address problems
requires years of support from stakeholders, programs, and funding sources
Nine minimum elements of Section 319-funded watershed plans
components EPA believes are most critical to preparing effective watershed plans; quantified framework providing analytic link between actions and attainment of WQ standards
a. Identify causes and sources of pollution
b. Estimate pollutant loading into the watershed and expected load reductions
c. Describe management measures that will achieve load reductions and targeted critical areas
d. Estimate amounts of technical and financial assistance and the relevant authorities needed to implement the plan
e. Develop an information/education component
f. Develop a project schedule
g. Describe the interim, measurable milestones
h. Identify indicators to measure progress
i. Develop a monitoring component
a-c = characterization + goal setting phases; determine management strategies needed in specific areas
d-i = develop specific action plan with measurable targets/milestones and necessary financial/technical resources to restore waterbody
threatened watershed
waters that meet standards but exhibit a declining trend in WQ such that they will likely exceed standards in the near future
impaired watershed
waters that do not attain the WQ criteria associated with its designated use(s)
Total maximum daily load (TMDL)
maximum amount of pollutants that a waterbody can receive from both point and nonpoint source and still meet WQ standards
important starting point for WQ planning
resonable assurance: determine regulatory requirements for point sources (wastewater treatment plants, stormwater treatment systems) and feasability of controlling NPS using local, state, tribal, and federal programs
provides degree of certainty for achieving needed pollutant reductions
Section 303(d) of Clean Water Act
states, territories, and authorized tribes are required to develop lists of impaired waters—waters that are too polluted or degraded to meet their water quality standards; these jurisdictions must establish priority rankings for waters on the lists and, in most cases, develop TMDLs for these waters
steps to effective watershed management
6 basic steps to develop/implement effective watershed plan —> roadmap to achieve goals
build partnerships
characterize your watershed
finalize goals and identify solutions
design an implementation program
implement watershed plan
measure programs and make adjustments
loop from step 6 to step 3 —> watershed planning is an iterative process —> refine/modify approach based on new information; incorporate lessons learned
Step 1 - build partnerships
work with local stakeholders/partners —> more solid commitment to solution, can pool resources/skill sets —> increases probability of long-term success
identify key stakeholders: show clear benefit to participating
identify issues of concern: use historical perspective of stakeholders when identifying issues; determine geographic scope of WBP (where problems are, protection areas)
set preliminary goals: ask for stakeholders’ long-term goals for watershed —> refine into shared goals
develop indicators: direct or indirect measurements of an environmental, social, or programmatic component in a system; stakeholders should select indicators and identify how to measure progression towards each goal
conduct public outreach: initiate at outset of planning effort to familiarize stakeholders with issues, outline planning process, and enlist participation
key stakeholders
people who make/implement, are affected by, and can assist/impede implementation of decisions
those who can contribute resources/assistance to planning efforts
those who are working on similar programs that can be integrated into a larger effort
consider five categories
those responsible for implementing WBP
those affected by implementing WBP
those who provide information on issues/concerns in watershed
those who have knowledge of existing programs/plans that you might want to integrate into WBP (soil/water conservation districts, irrigation districts)
those who provide technical/financial assistance in developing and implementing the plan
Step 2 - characterize the watershed
basis for developing effective management strategies to meet WQ goals; help focus management on most pressing needs
gather existing data, create a watershed inventory: should be otained from local governments, state natural resource agencies, federal acencies —> create inventory to organize data into common format (spreadsheet/database)
identify data gaps, collect additional data if needed: determine if you can characterize watershed conditions with existing information (temporal/spatial gaps, right type of data, adequate quality)
analyze data: identify watershed pollutant sources/causes of any impairments + areas to protect
identify causes and sources of impairments: understand where and when problems occur; identify critical areas (w/ most pollution) to prioritize
estimate pollutant loads: quanitfy magnitude of pollutant loads (often missing from WBPs)
Data needed for watershed planning
physical/natural features: watershed boundaries, hydrology, topography, soils
land use and population characteristics: land use, land cover, existing management
waterbody conditions: 305(b) reports, 303(d) reports, TMDLs, source water assessments
pollutant sources: permitted point sources, nonpoint sources, atmospheric deposition
waterbody monitoring data: WQ and flow, biology, geomorphology
approaches to estimating pollutant loads
check if a previous study requiring loading estimates was conducted (TMDL, Clean Lakes study) —> can be used as basis for appropriate loading estimates
some loading analyses focus on determining how much load is acceptable, others focus on source loads that attribute loading to each category of sources in watershed
techniques that use actual monitoring data/literature values —> coarse estimate of pollutant loads entering waterbody (conditions where fairly detailed monitoring/flow gauging are available; major interest is total loads)
techniques that use models to predict estimated pollutant loads —> forecast/estimate conditions that might occur under various scenarios
Step 3 - set goals and identify solutions
set overall goals and management objectives: refine preliminary goals based on data analysis, develop more detailed objectives and targets
ex. “restore aquatic habitat” —> causes = upland sediment erosion, streambank erosion, near-stream land disturbance —> management objectives: 1) reduce sediment loads from upland sources 2) improve riparian vegetation and limit livestock access to stabilize streambanks
develop indicators/targets: refine indicators (environmental, programmatic, social) to quantitatively measure if you are meeting objectives; establish interim milestones to measure implementation of activities
determine load reductions needed: use load estimates from step 2; determine reduction estimate based on management measures to be implemented in critical areas; identify and incorporate TMDLs if approved by EPA;
identify critical areas: use map or description; areas where management measures will be needed
develop management measures to achieve goals: identify which management practices can be implemented in critical areas identified in step 2 —> narrow to most effective and acceptable —> select based on effectiveness and cost-benefit
Types of indicators
Environmental indicators: direct measure of environmental conditions that plan seeks to achieve
e.g. number/percentage of river/stream miles that fully meet all WQ standards; reduction in pollutant loadings from NPS
Performance indicators (social, programmatic): help measure progress towards meeting goals
Programmatic: number of public water systems with source water protection plans; number of management measures implemented in a watershed (number of acres under nutrient management, number of riparian buffers created); etc.
Social: increase in number of residents signing watershed stewardship pledge; rates of participation in education programs specifically directed toward solving particular NPS pollution problems; etc.
Step 4 - design an implementation program
develop an implementation schedule: turn goals and objectives into specific tasks; timeline of when each phase will be accomplished, broken down into reasonable increments (e.g. quarters)
milestones: establish interim milestones to help measure implementation of activities in plan; can use time scales: short-term (1-2 years); mid-term (2-5 years); long-term (5-10+ years); based on level of effort and funding requirements
benchmarks to measure progress: track progress through monitoring; can be direct measurements/indirect indicators; decide how to determine if plan needs revision
monitoring program: evaluate plan effectiveness based on criteria (above) and measurable progress; include baseline (before), project-specific (during), post-project (after) monitoring
information/education component: involve watershed community to promote adoption of management practices, ensure sustainability of plan, and encourage change in behavior; support management goals/implementation of plan; include indicators
evaluation process: demonstrate achieving goals by implementing management measures; continually improve program for efficiency/quality; evaluate 3 major components: inputs (investments), outputs (tasks conducted, products developed), outcomes (results from implementation)
identify technical and financial assistance: take into account administration services (salaries, regulatory fees, supplies, in-kind services); information/education efforts; installation, operation, maintenance of management measures; monitoring, data analysis, data management activities
assign responsibility for reviewing and revising plan
Step 5 - implement the watershed plan
should follow road map developed in plan; projects should be coordinated by project manager/team to ensure fitting schedules, achieving milestones, integrating with monitoring/outreach efforts
prepare work plans: outline activities in 2 - 3 year time frames based on overall watershed plan; “specific to-do lists”
implement management strategies: set/track milestones to measure rate of progress of BMP implementation, maintenance activities, point source treatment improvments, and monitoring of social indicators
conduct monitoring: track/evaluate effectiveness of plan; chemical, physical, biological measurements; government monitoring programs, trained volunteers
analyze your data: two types should be done: 1) routine summary analysis (track progress, assess quality of data, provide early feedback on trends/changes/problems) 2) intensive analysis (determine status, changes, trends, issues; annually)
conduct information/education activities: make audience aware of issue, then educate on problems facing watershed, then teach actions to take to help address problems
share results: build credibility with continuous communication; highlight key activties/results to stakeholders/community during information/education activities
Step 6 - measure progress and make adjustments
periodically review activities in work plan, compare results with milestones, provide feedback to stakeholders, determine if corrections are needed
track progress: meeting milestones, analyze monitoring data for WQ improvements
make adjustments: if not meeting milestones/targets for load reductions, etc.; can be another management measures, apply in different location, etc.
expected runoff based on land use from 4-in rainfall
wee !
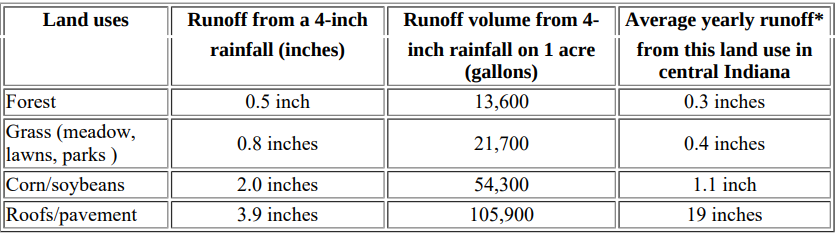
impervious surfaces
roofs, pavement, other hard surfaces; buildings (houses, factories, stores) and transport related areas (roads, driveways, parking lots) —> transport related areas increasing at faster rate (often > ½ all impervious area in residential/commercial areas) because rise in vehicle ownership/miles travelled
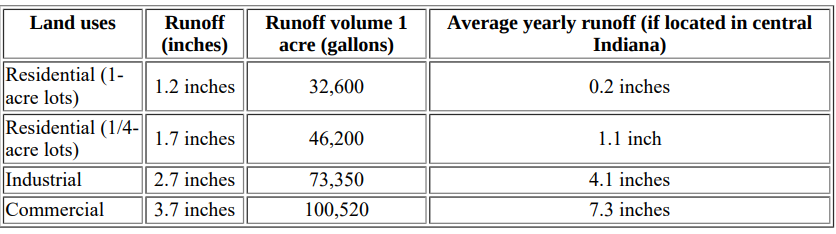
expected runoff based on combination land uses from 4-in rainfall
residential similar to cropped field runoff because roofs/driveways/roads have higher runoff than field, but grassed area has lower runoff than field —> weighted average results in same total runoff
commercial runoff more than 20 times greater than forest land runoff
runoff effects
increased frequency and severity of flooding (flow exceeds stream capacity)
reduced groundwater recharge (too speedy to infiltrate)
decreased base flow in streams (less groundwater)
increased erosion (fast water causes stream channel erosion)
reduced natural filtration of the water (water doesn’t pass through soil)
negative impact on stream health (erosion during peak flows, low flow because decreased base flow —> stress for aquatic life)
point source pollution
contaminants that enter water directly (usually through pipe) —> specific location where pollutant enters can be identified (usually end of pipe)
sewage treatment plants
industrial sources
easier to regulate than NPS, original target of 1972 Clean Water Act —> dramatically improved WQ of US rivers/streams
most point sources greatly reduced pollution they discharge bc of permit requirements
nonpoint source pollution
“polluted runoff”; exact location pollution enters cannot be identified (comes from entire landscape areas); directly related to land use
driveways/roads (oil, leaves)
agricultural areas (sediment, pathogens, nutrients, pesticides, chemicals)
urban areas (sediment, pathogens, nutrients, oxygen-demanding substances, heavy metals, oil/petroleum products, road salt)
major WQ problem in US
sediment
largest pollutant by volume in MS
affects aquatic life, shortens reservoir life, complicates water treatment
sources: cropland erosion, construction sites, runoff from streets/impervious areas, stream bank erosion (increased by added runoff bc development)
pathogens
e. coli, other viruses, bacteria, protozoa
source: mostly fecal material from warm-blooded animals
agricultural lands: wildlife, livestock manure, malfunctioning septic systems
urban lands: pet wastes, wildlife (birds), septic systems in unsewered areas, sewage treatment plant discharges (point source), outfall from combined sewers
nutrients
primarily nitrogen and phosphorus
high concentrations of nitrate
in drinking water: toxic to infants and harmful to pregnant women
in Mississippi River: one cause of hypoxia (low oxygen zone) in Gulf of Mexico
phosphorus
overproduction of algae —> clogs lakes and reservoirs
source:
agricultural lands: fertilizer, livestock manure, septic systems
urban lands: fertilizer (lawns, gardens, golf courses), pet waste, sewage treatment plant discharge
pesticides
concern in drinking water supplies using surface water
source: pesticide application (agricultural and urban lands)
typically higher concentration in agricultural lands except certain insecticides
oxygen-demanding substances
consists of organic matter that depletes dissolved oxygen when decomposed by microorganisms —> damages WQ and aquatic life
source: decaying organic matter (leaves, grass clippings, organic debris)
metals
lead, copper, cadmium, zinc, mercury, chromium
can accumulate in fish tissues and affect sensitive animal/plan species —> fish consumption advisories (usually because mercury)
source: automobiles, industrial activities, illicit sewage connections, atmospheric deposition
oil and other petroleum products
degrade surface water appearance, impair fish habitats, can be toxic to sensitive species
source: oil leaks, auto emissions (off of parking lots, roads, driveways), improper disposal of waste oil
petroleum-based hydrocarbon concentrations are often high enough to cause moralities in aquatic organisms
road salt
increases sodium and chloride levels in surface/ground water
source: snow runoff
high salt/chlorine concentrations at bottom of ponds/lakes —> toxic to certain organisms, prevents vertical spring mixing
imperviousness effect on water quality
number and extent of impervious areas directly connected to drainage network by storm sewers/piping systems = most important factor determining negative impact of development on WQ
prevents infiltration and water from being purified of pollutants by soil
many people suggest WQ starts to deteriorate at 10-20% impervious cover of watershed area —> hard to find exact number because WQ depends on wide range of factors (management practices)
minimize impervious areas
incorporate open spaces into urban areas
reduce road width
plan subdivisions so driveways are smaller
reduce parking requirements
use permeable alternatives (gravel, porous pavement)
slow stormwater
avoid direct connections from impervious areas to streams
spread rooftop runoff over pervious areas
route road/parking lot runoff to grassy swales vs. storm sewers
require stormwater basins (hold back peak stormflow, release at pre-development release rates)
reduces peak runoff rate but not total runoff
dry (detention ponds; grass/stone-lined depressions, could be used as recreation areas during dry periods; often not aesthetically pleasing; minimal WQ treatment) vs. wet (retention ponds; permanent pools of water; longer storage time —> better WQ treatment)
reduce pollution sources
less expensive to prevent contaminants from entering storm water vs. treating contaminated water
prevent with good management practices
proper disposal of pet wastes
reduced fertilizer/pesticide use on lawns/gardens/cemeteries/golf courses
community hazardous waste and waste oil recycling centers
regular street/parking lot cleaning
use plowing, anti-icing (prevantitive salting before storm), sand/cinders/chemicals (calcium magnesium acetate) instead of salt
establish protected areas
stream buffers, riparian areas —> “green belts”; improve WQ, provide recreational areas
reduce streambank erosion
filter out sediment/sediment-bound contaminants
promote healthy aquatic life
promote infiltration
reduce dissolved contaminants
protect with regulations, purchasing land, preventing development
plan development on watershed basis
analyze watershed on which proposed development is located and the broader effects of development on the entire watershed
keeping some areas high-density and others open space
inventory of important natural resources, implementing setback distances from critical resources