IB Marcoeconomics

0.0(0)
Studied by 0 people
call kaiCall Kai
Locked
learnLearn
examPractice Test
spaced repetitionSpaced Repetition
heart puzzleMatch
flashcardsFlashcards
GameKnowt Play
Card Sorting

1/166

encourage image

There's no tags or description

Looks like no tags are added yet.

Last updated 2:43 PM on 8/4/26
Name
Mastery
Learn
Test
Matching
Spaced
Call with Kai
Chat

No analytics yet

Send a link to your students to track their progress

167 Terms

1
New cards
IB Economics Essay Structure (KAAE)

Knowledge: define terms precisely. Application: embed specific real-world examples or extracted data. Analysis: construct rigorous economic chains detailing how event X triggers result Y. Evaluation: challenge underlying assumptions, expose implementation flaws, and assess short-run versus long-run policy impacts.

2
New cards
Scarcity and Choice in Macroeconomics
Unlimited human wants collide with finite economic resources. Central planners and free markets must prioritize competing macroeconomic objectives, generating unavoidable trade-offs.
3
New cards

Circular Flow of Income

Examines continuous flows of money, resources, and output between households and firms. TLDR: Households own the factors of production (land, labor, capital, enterprise) and supply them to firms in exchange for income (wages, rent, interest, profit).
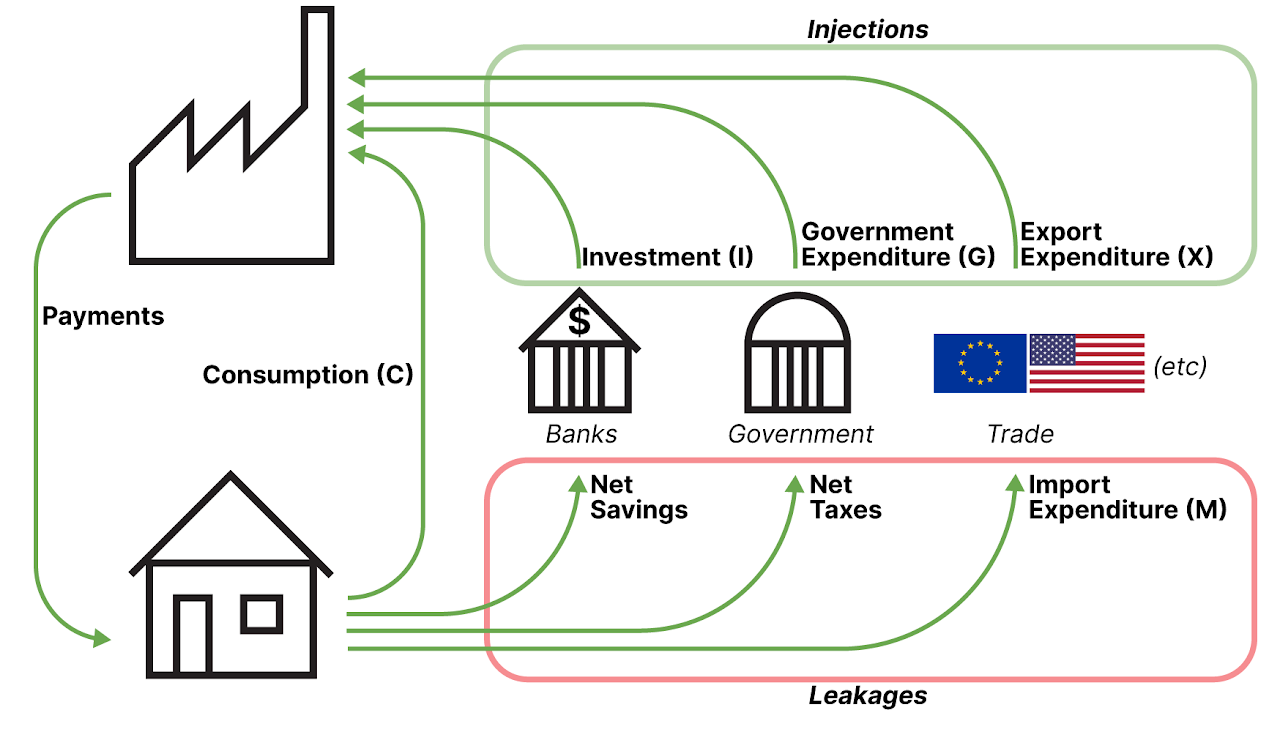
<p>Examines continuous flows of money, resources, and output between households and firms. <strong>TLDR</strong>: Households own the factors of production (land, labor, capital, enterprise) and supply them to firms in exchange for income (wages, rent, interest, profit).</p>
4
New cards

States of Disequilibrium in the Circular Flow of Income

  • Injections Exceed Leakages (J > L): National income rises, and the economy grows because total spending exceeds total output capacity.

  • Leakages Exceed Injections (L > J): National income falls and the economy contracts as more money exits active circulation than enters.

5
New cards

Gross Domestic Product (GDP)

Total market value of all final goods and services produced within a nation's borders over a specific time frame. Measures local production regardless of factor ownership.
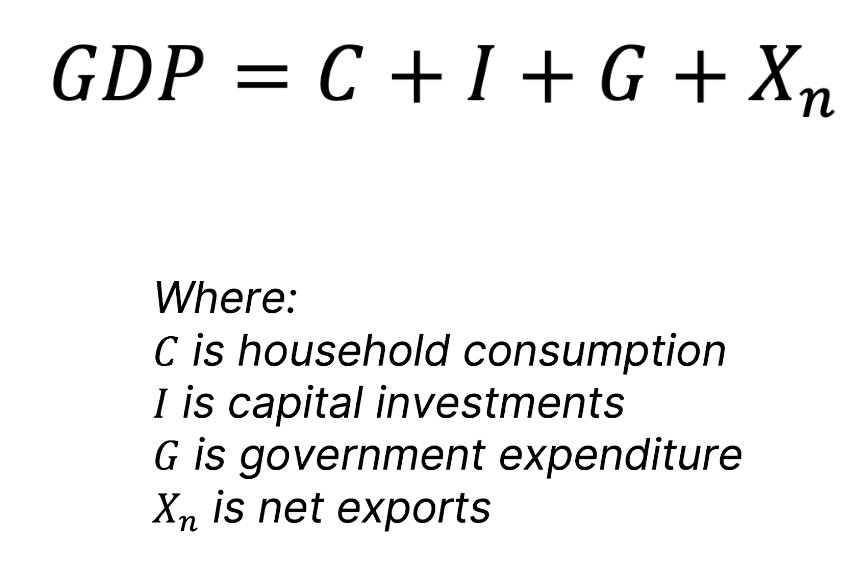
<p>Total market value of all final goods and services produced within a nation's borders over a specific time frame. Measures local production regardless of factor ownership.</p>
6
New cards

Gross National Income (GNI)

Total income earned by a country's citizens and domestic corporations, regardless of geographic location. Calculated as GDP plus net factor income from abroad.

<p>Total income earned by a country's citizens and domestic corporations, regardless of geographic location. Calculated as GDP plus net factor income from abroad.</p>
7
New cards
Distinction Between GDP and GNI
GDP tracks output within physical borders, whereas GNI measures income ownership. Massive profit remittances by foreign multinationals leave developing host nations with high GDP figures but significantly lower GNI.
8
New cards
Nominal GDP vs Real GDP
Nominal GDP uses current market prices, distorting figures with price inflation. Real GDP adjusts output using constant base-year prices to isolate actual physical output growth.
9
New cards

GDP Deflator Formula

Measures price changes across all domestically produced goods and services in an economy.
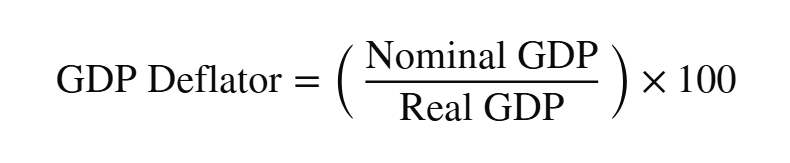
<p>Measures price changes across all domestically produced goods and services in an economy.</p>
10
New cards

Real GDP Calculation

Strips out inflationary distortions to compute true economic expansion.
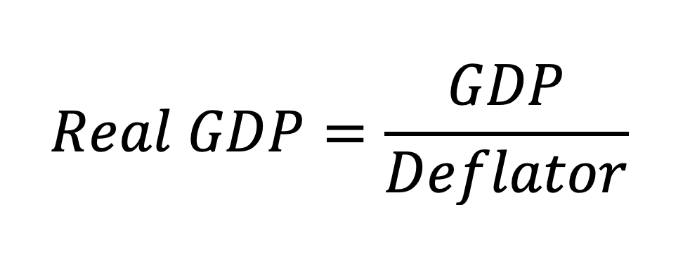
<p>Strips out inflationary distortions to compute true economic expansion.</p>
11
New cards

Green GDP

Environmental output metric calculated as Green GDP = GDP - Environmental Costs. Deducts natural resource depletion and environmental degradation costs from standard output.

12
New cards
Purchasing Power Parity (PPP)
An exchange rate adjustment pricing a uniform basket of goods across different currencies. Equates actual local purchasing power across international boundaries.
13
New cards
Rationale for Using PPP
Market exchange rates fluctuate wildly based on currency speculation. PPP removes currency distortions, enabling realistic cross-border living standard comparisons.
14
New cards
PPP Limitations
Comparing identical consumer baskets across diverse cultures fails when spending habits differ wildly. Quality variations between nations further skew price accuracy.
15
New cards
Limitations of GDP for Living Standards
Ignores income inequality, unrecorded informal labor, domestic work, pollution, and working hour stress. GDP tracks market volume, not human happiness.
16
New cards
Wealth vs Income
Wealth represents a accumulated stock of physical and financial assets measured at a single moment. Income reflects a dynamic flow of money earned over a specific period.
17
New cards
The Wealth Effect
Surging asset values elevate perceived household wealth, driving up private consumption ($C$) without any immediate increase in disposable income.
18
New cards
Evaluation of the Wealth Effect
Distributes gains unequally. Property spikes enrich existing asset holders while punishing renters, failing to drive uniform national spending.
19
New cards
Base Year
A reference year assigned a benchmark index value of 100. Allows economists to measure price index and output variations over time.
20
New cards

Index Number Calculation

Expresses changes in a variable relative to a baseline level used to track macroeconomic trends, such as inflation, as measured by the Consumer Price Index (CPI).
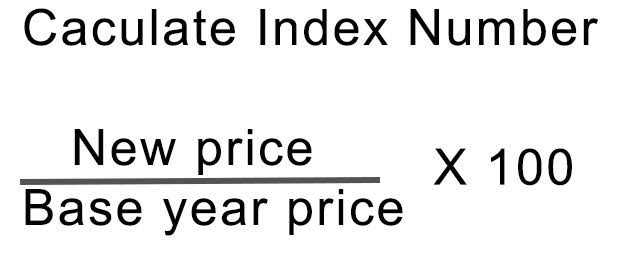
<p>Expresses changes in a variable relative to a baseline level used to track macroeconomic trends, such as inflation, as measured by the <span>Consumer Price Index</span> (CPI).</p>
21
New cards

Business Cycle Phases

The short-term, recurring upward and downward movements in real GDP are driven by changes in aggregate demand and aggregate supply, forming a long-term growth trend.
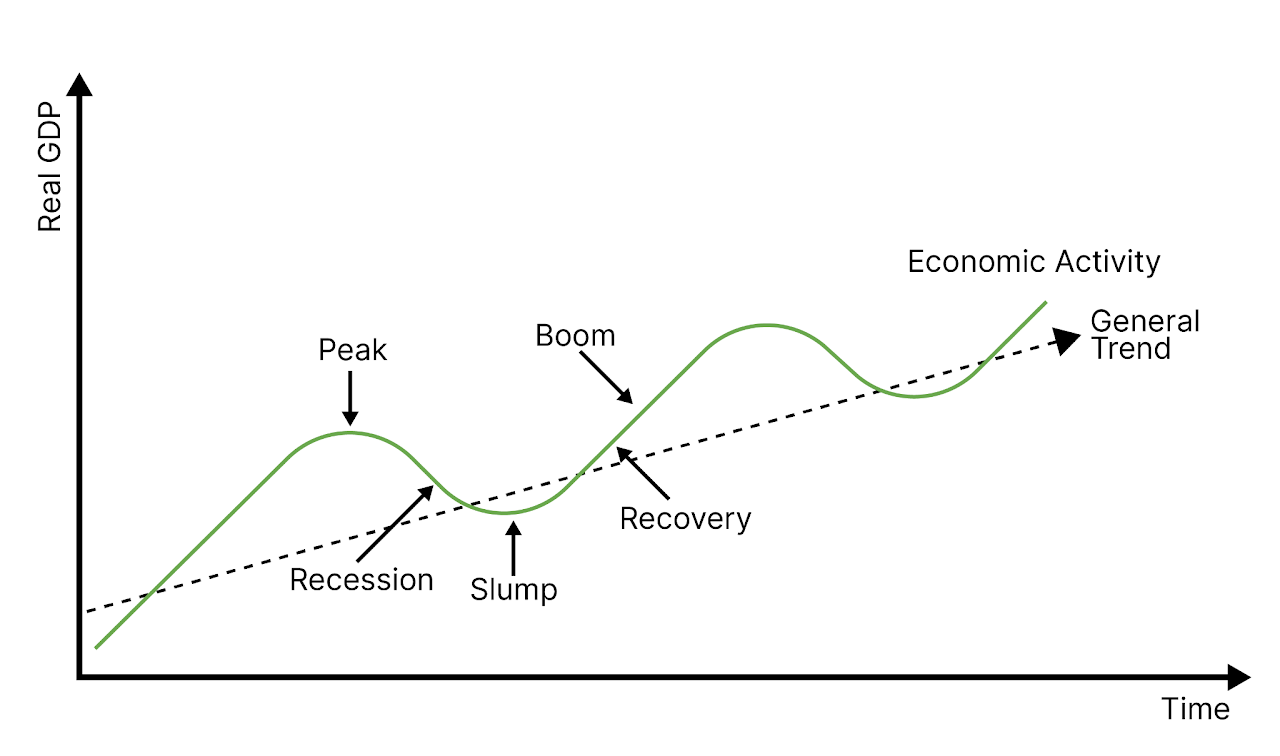
<p>The short-term, recurring upward and downward movements in real GDP are driven by changes in aggregate demand and aggregate supply, forming a long-term growth trend.</p>
22
New cards

Business Cycle Diagram Axes

Vertical Axis: Real GDP. Horizontal Axis: Time. Tracks output deviations from potential trend lines over time.
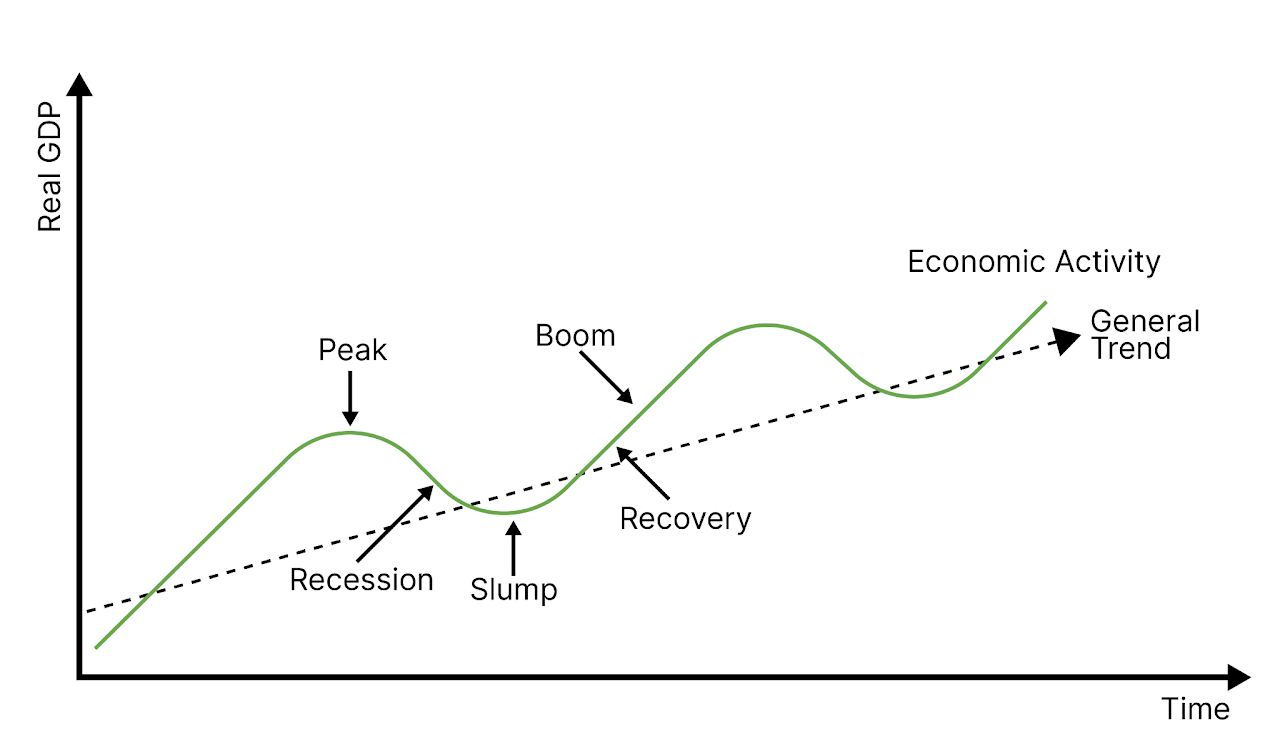
<p>Vertical Axis: Real GDP. Horizontal Axis: Time. Tracks output deviations from potential trend lines over time.</p>
23
New cards
Circular Flow Equilibrium Condition

Equilibrium requires total injections to equal total leakages (I + G + X = S + T + M).

24
New cards

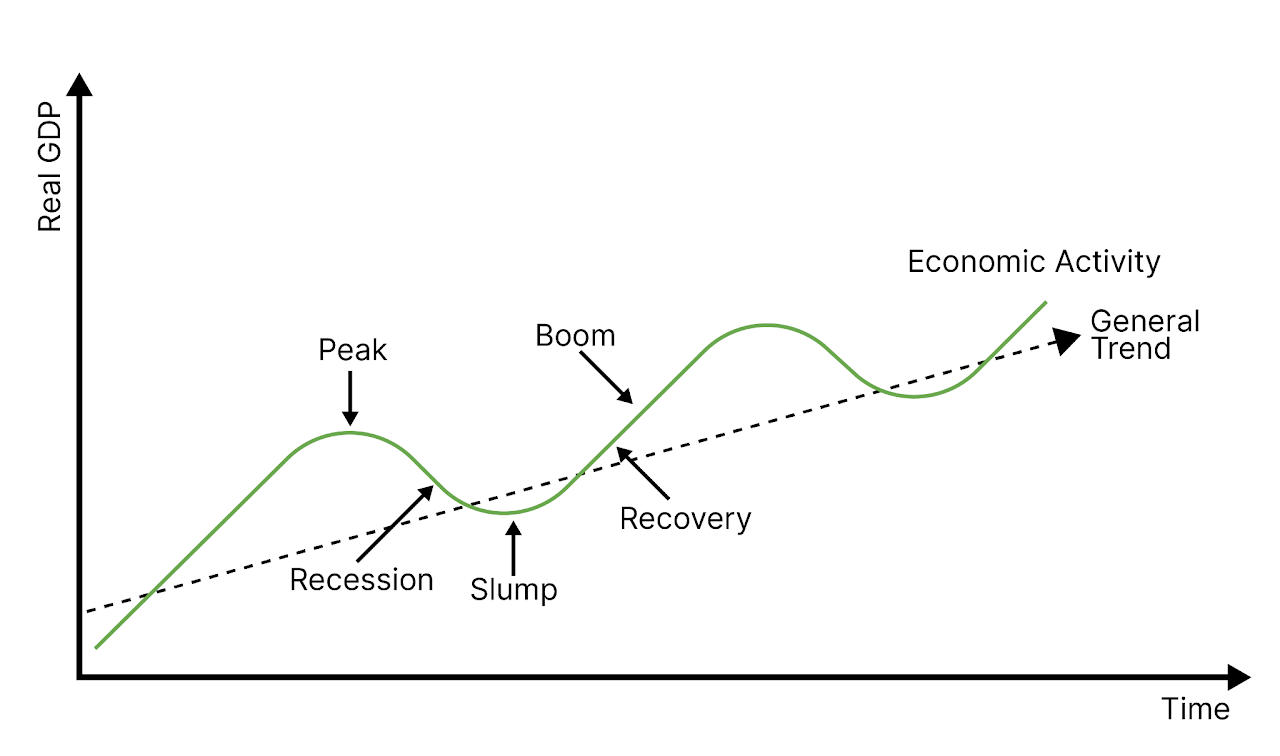
Aggregate Demand (AD)

Total spending on domestic goods and services at a given price level over a specific period. AD = C + I + G + (X - M).
<p>Total spending on domestic goods and services at a given price level over a specific period. AD = C + I + G + (X - M).</p>
25
New cards
Determinants of Consumption (C)
Disposable income, commercial borrowing interest rates, consumer confidence levels, home equity values, and personal debt burdens.
26
New cards
Gross vs Net Investment
Gross investment reflects total expenditure on capital equipment. Net investment equals gross investment minus capital depreciation.
27
New cards
Investment Determinants
Commercial interest rates, business confidence levels, corporate tax burdens, technological changes, and existing corporate debt burdens.
28
New cards
Accelerator Effect
Surging consumer demand forces firms near full capacity to invest heavily in capital machinery to expand long-term production.
29
New cards
Government Spending Determinants (G)
Fiscal policy mandates, political priorities, automatic welfare expenditures, and general business cycle conditions.
30
New cards
Net Export Determinants (X - M)
Foreign national income levels, domestic relative inflation, exchange rate shifts, and foreign trade barriers.
31
New cards
Demand-Side Shocks
Sudden shifts in aggregate demand caused by asset market collapses, credit crunches, consumer panic, or trading partner recessions.
32
New cards

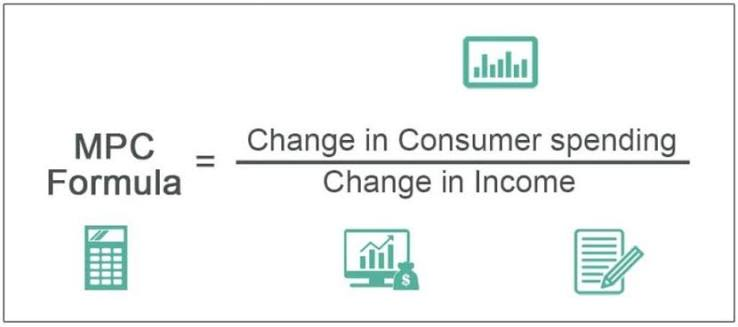
Marginal Propensity to Consume (MPC)

The proportion of additional disposable income that households spend on domestic consumption rather than saving or paying tax. Used to determine the size of the Keynesian Multiplier.
<p>The proportion of additional disposable income that households spend on domestic consumption rather than saving or paying tax. Used to determine the size of the <span>Keynesian Multiplier.</span></p>
33
New cards
The Multiplier Effect
Mechanism where an initial autonomous injection into the circular flow triggers a larger final surge in real national output.
34
New cards

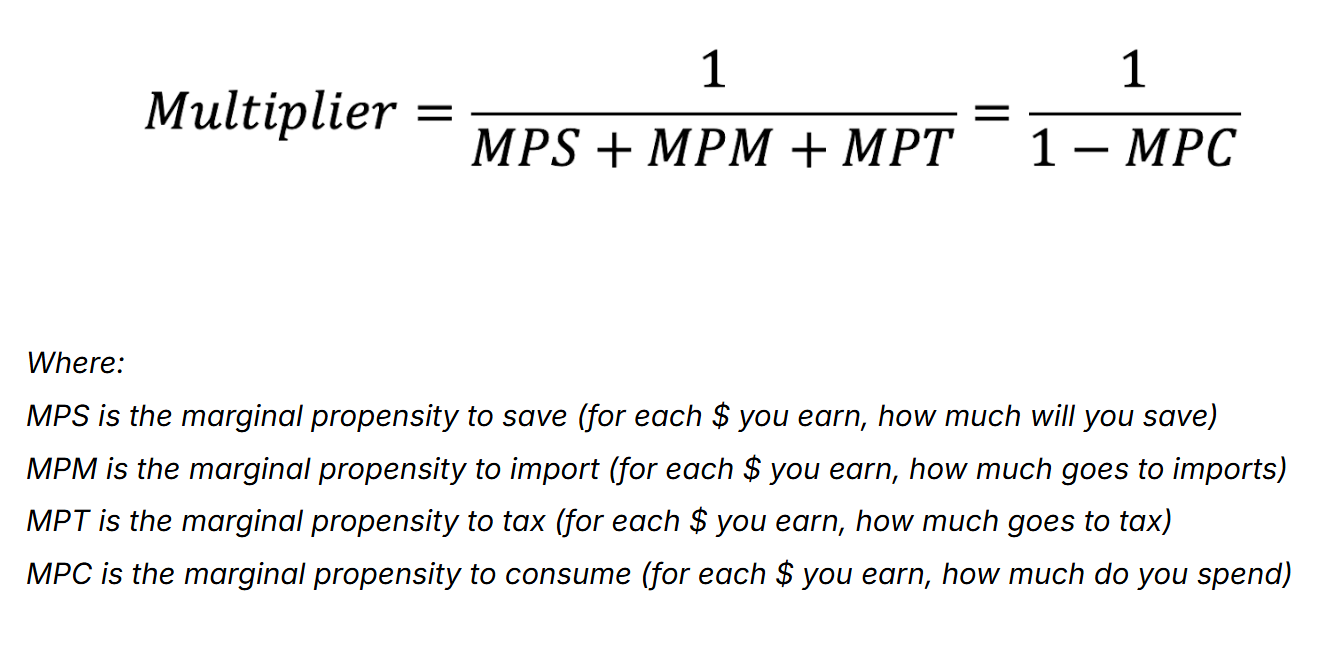
Keynesian Multiplier Formula

Explains how an initial injection creates a magnified shift in aggregate demand. One person's spending becomes another person's income, triggering successive rounds of economic activity. A higher MPC leads to a larger multiplier, while higher withdrawals (savings, taxes, imports) reduce its overall value.
<p>Explains how an initial injection creates a magnified shift in aggregate demand. One person's spending becomes another person's income, triggering successive rounds of economic activity. A higher MPC leads to a larger multiplier, while higher withdrawals (savings, taxes, imports) reduce its overall value.</p>
35
New cards
Multiplier and Spare Capacity
A tight economy lacking spare capacity converts spending injections into price inflation rather than real output gains.
36
New cards
Downward Multiplier Effect
Autonomous spending cuts or leakage surges trigger compounding drops in aggregate demand and employment.
37
New cards
Animal Spirits
Keynesian concept describing business confidence and financial mood, which drives private capital investment regardless of interest rates.
38
New cards
Investment Growth Limitations
Excessive capital investment fails to generate economic growth when wasted on administrative bureaucracy, misallocated projects, or delayed by lengthy implementation lags.
39
New cards

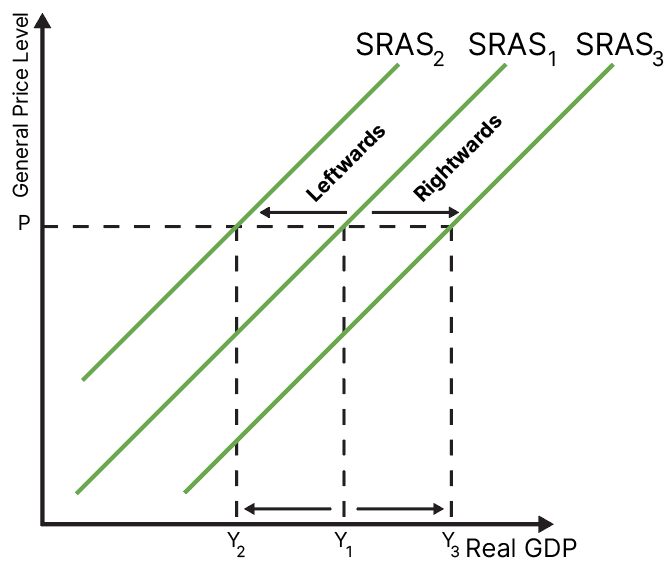
Short-Run Aggregate Supply (SRAS)

Aggregate supply is the total amount of goods and services that firms are willing and able to provide in an economy in a certain time period.

  • Wage and state of technology are constant

  • Higher prices mean higher supply, so it is upwards-slopingupward-sloping
<p>Aggregate supply is the total amount of goods and services that firms are willing and able to provide in an economy in a certain time period. </p><ul><li><p class="zfr3Q CDt4Ke " style="text-align: left;"><span>Wage and state of technology are constant</span></p></li><li><p class="zfr3Q CDt4Ke " style="text-align: left;"><span>Higher prices mean higher supply, so it is upwards-sloping</span>upward-sloping</p></li></ul><p></p>
40
New cards
SRAS Upward Slope Rationale
Fixed short-run wage contracts mean higher output prices expand profit margins, incentivizing firms to raise production volumes.
41
New cards
SRAS Shift Factors
Shifts stem from changes in wage rates, raw material costs, imported supply prices, business indirect taxes, or exchange rate swings.
42
New cards
Supply-Side Shocks
Unexpected supply-side disruptions like oil price spikes, extreme weather events, or major trade embargoes that shift SRAS inward.
43
New cards

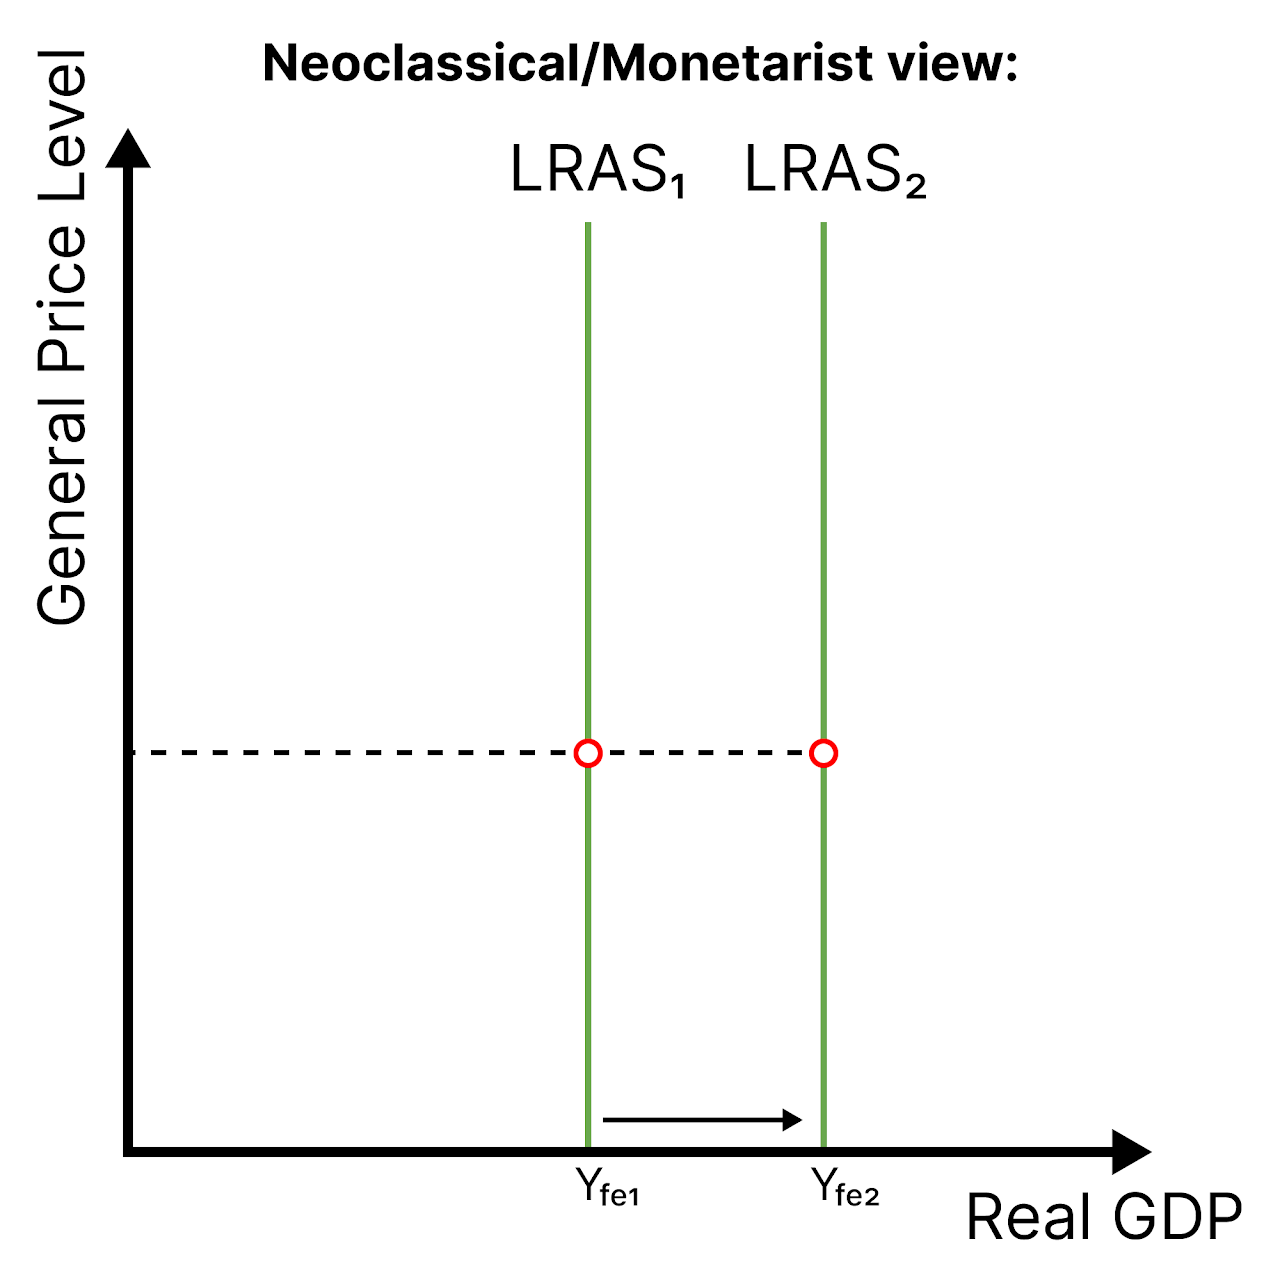
Long-Run Aggregate Supply (LRAS)

The maximum level of real GDP that the economy is currently hypothetically able to achieve, with full employment in all sectors. It is impossible to produce more than this level given the economy's current technology and productivity (Yp).
<p class="zfr3Q CDt4Ke " style="text-align: left;"><span>The maximum level of real GDP that the economy is currently hypothetically able to achieve, with full employment in all sectors. It is impossible to produce more than this level given the economy's current technology and productivity </span>(Yp).</p>
44
New cards

Shifts in LRAS and Keynesian AS

  • Changes in quantity and/or quality of factors of production

  • Improvements in technology

  • Increases in efficiency

  • Changes in institutions

45
New cards

Monetarist/New Classical LRAS Model

Assumes long-run aggregate supply is vertical at full employment (Yp). Flexible wages ensure markets clear, rendering demand management inflationary in the long term.
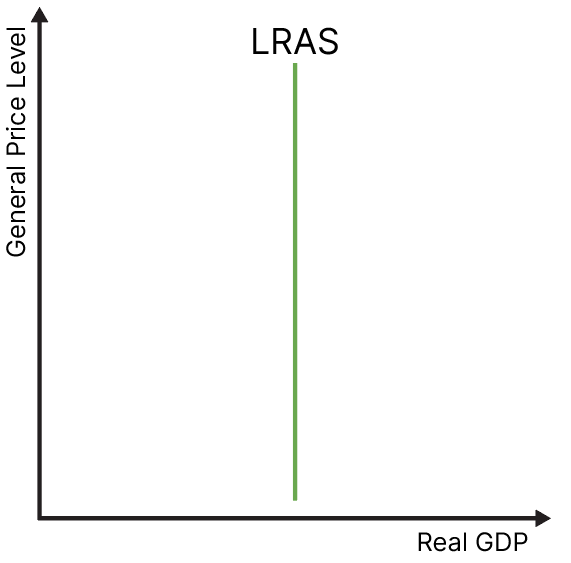
<p>Assumes long-run aggregate supply is vertical at full employment (Yp). Flexible wages ensure markets clear, rendering demand management inflationary in the long term.</p>
46
New cards

Keynesian Aggregate Supply Curve

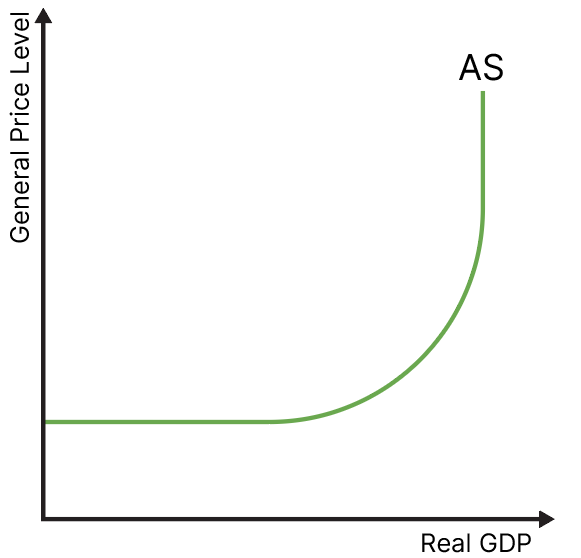
  • At low economic output, there is plenty of spare capacity in the economy, and extra output can be ensured without any strain on price. 

  • Once this spare capacity diminishes, there is pressure on scarce resources, increasing the general price level.

  • At some point, everything will be fully employed, and it will be impossible to produce more output regardless of price level, similar to the LRAS. 
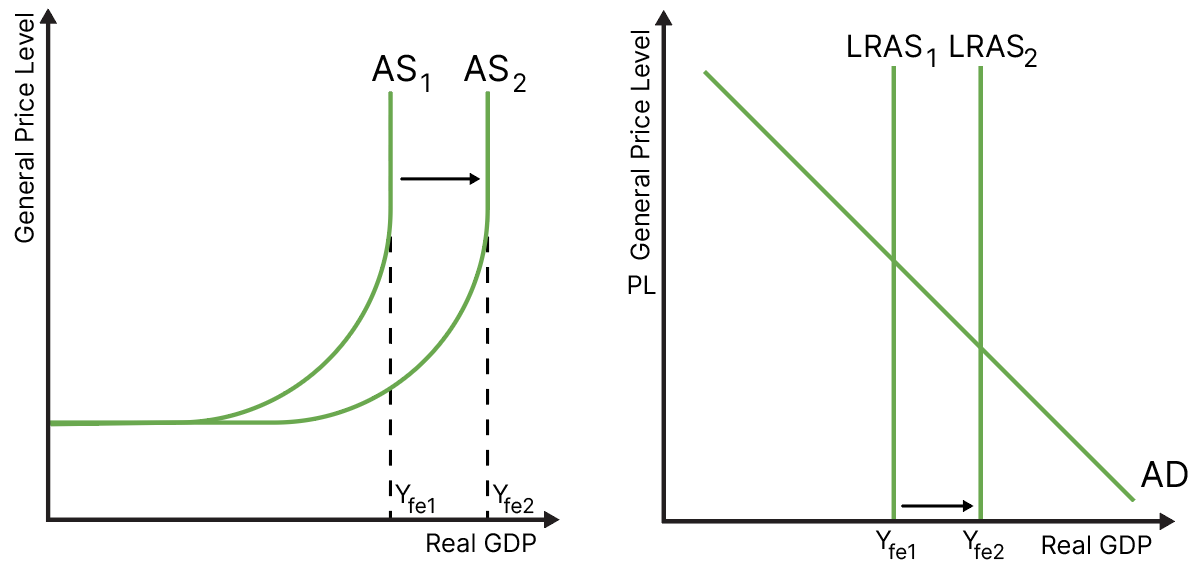
<ul><li><p class="zfr3Q CDt4Ke " style="text-align: left;"><span>At low economic output, there is plenty of spare capacity in the economy, and extra output can be ensured without any strain on price.&nbsp;</span></p></li><li><p class="zfr3Q CDt4Ke " style="text-align: left;"><span>Once this spare capacity diminishes, there is pressure on scarce resources, increasing the general price level.</span></p></li><li><p class="zfr3Q CDt4Ke " style="text-align: left;"><span>At some point, everything will be fully employed, and it will be impossible to produce more output regardless of price level, similar to the LRAS.&nbsp;</span></p></li></ul><p></p>
47
New cards

Keynesian LRAS Section 1 (Horizontal)

Substantial idle resources allow firms to raise production without increasing unit costs or output prices.
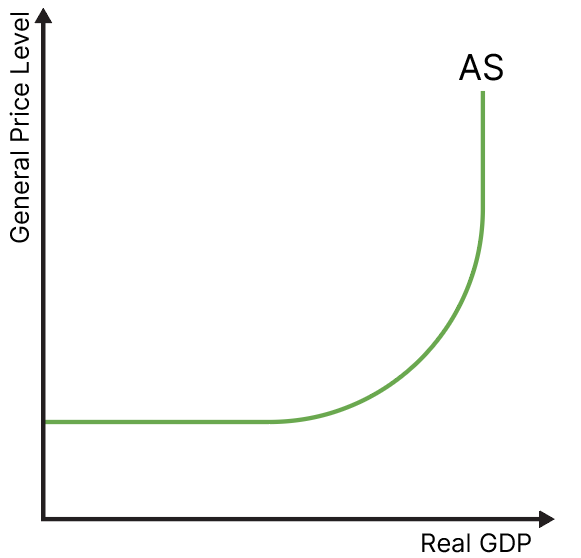
<p>Substantial idle resources allow firms to raise production without increasing unit costs or output prices.</p>
48
New cards

Keynesian LRAS Section 2 (Upward Sloping)

Approaching full employment creates factor shortages, driving up production costs and generating price inflation as output expands.
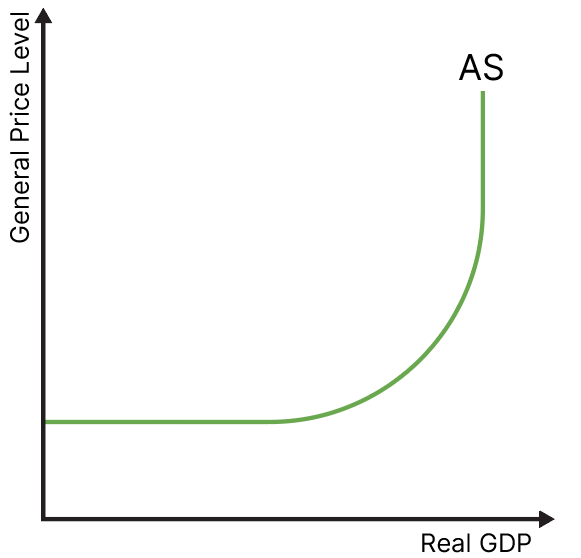
<p>Approaching full employment creates factor shortages, driving up production costs and generating price inflation as output expands.</p>
49
New cards

Keynesian LRAS Section 3 (Vertical)

Physical capacity limit reached. Supply becomes completely inelastic, converting spending surges into price inflation.
<p>Physical capacity limit reached. Supply becomes completely inelastic, converting spending surges into price inflation.</p>
50
New cards
Monetarist Self-Correction Mechanism
Unemployment in a recession depresses wages, lowering production costs, shifting SRAS outward, and restoring full employment automatically.
51
New cards
Keynesian Persistent Deflationary Gap
Unions and employment contracts block wage reductions during recessions. Economies remain trapped in equilibrium below full employment without government demand stimulus.
52
New cards

Inflationary gap (neoclassical only)

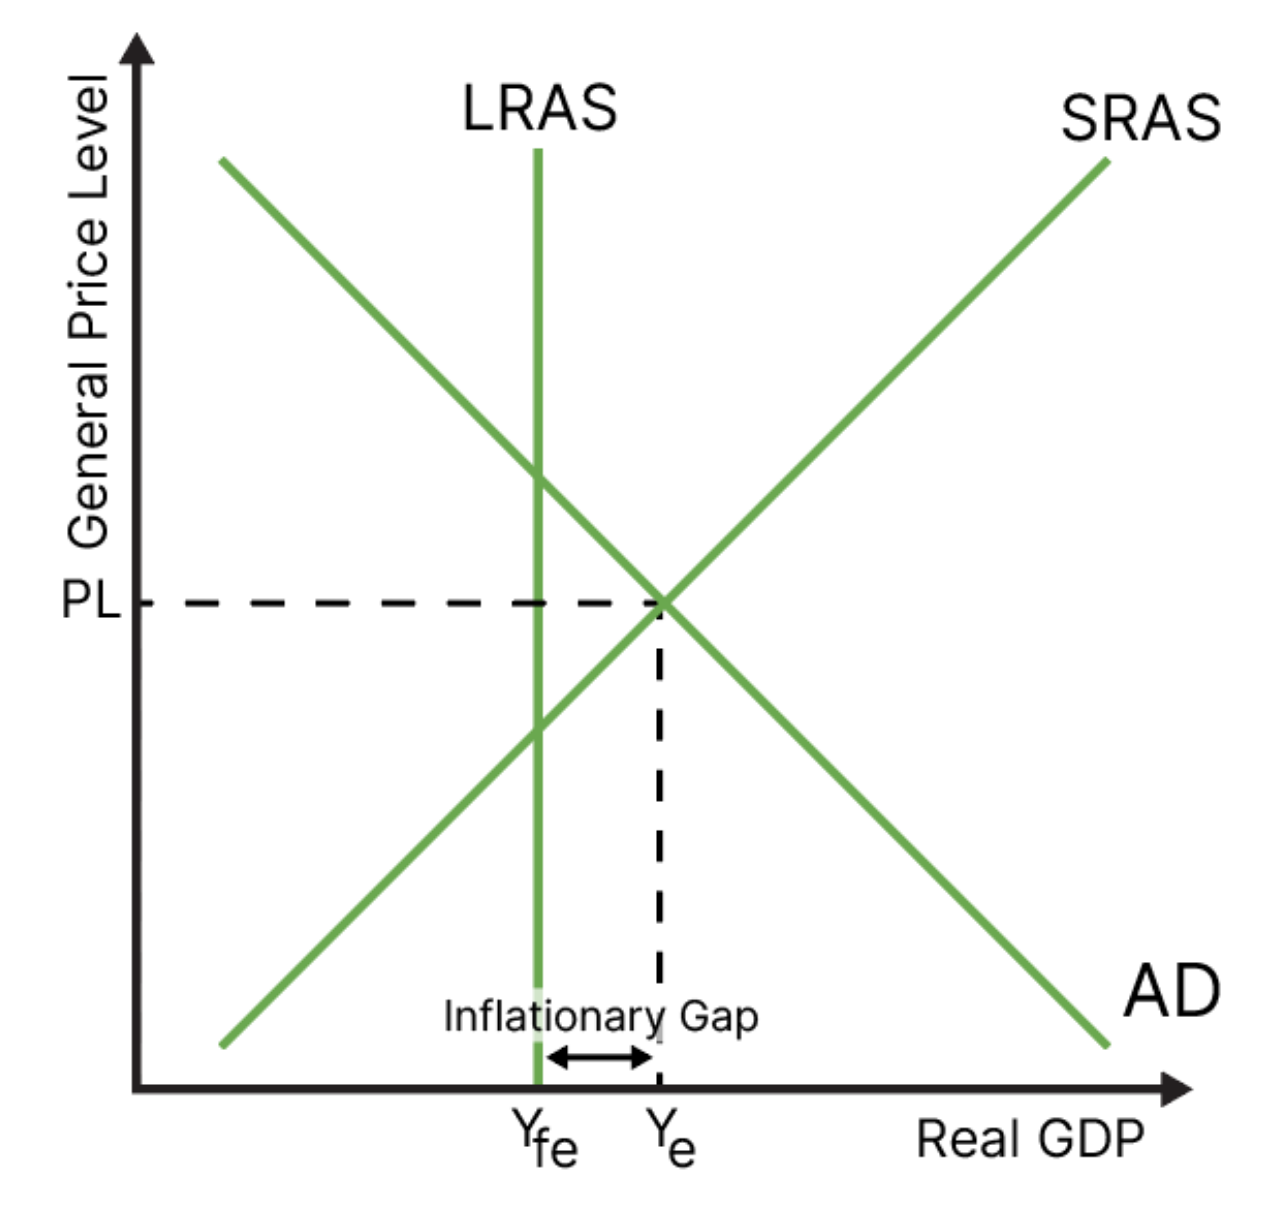
Actual output exceeds potential output (Y > Yp). Factor overutilization triggers demand-pull inflation. Labor shortages occur as firms compete for workers, raising wages and adding to production costs.
<p>Actual output exceeds potential output (Y &gt; Yp). Factor overutilization triggers demand-pull inflation. Labor shortages occur as firms compete for workers, raising wages and adding to production costs.</p>
53
New cards

Deflationary Gap (neoclassical only)

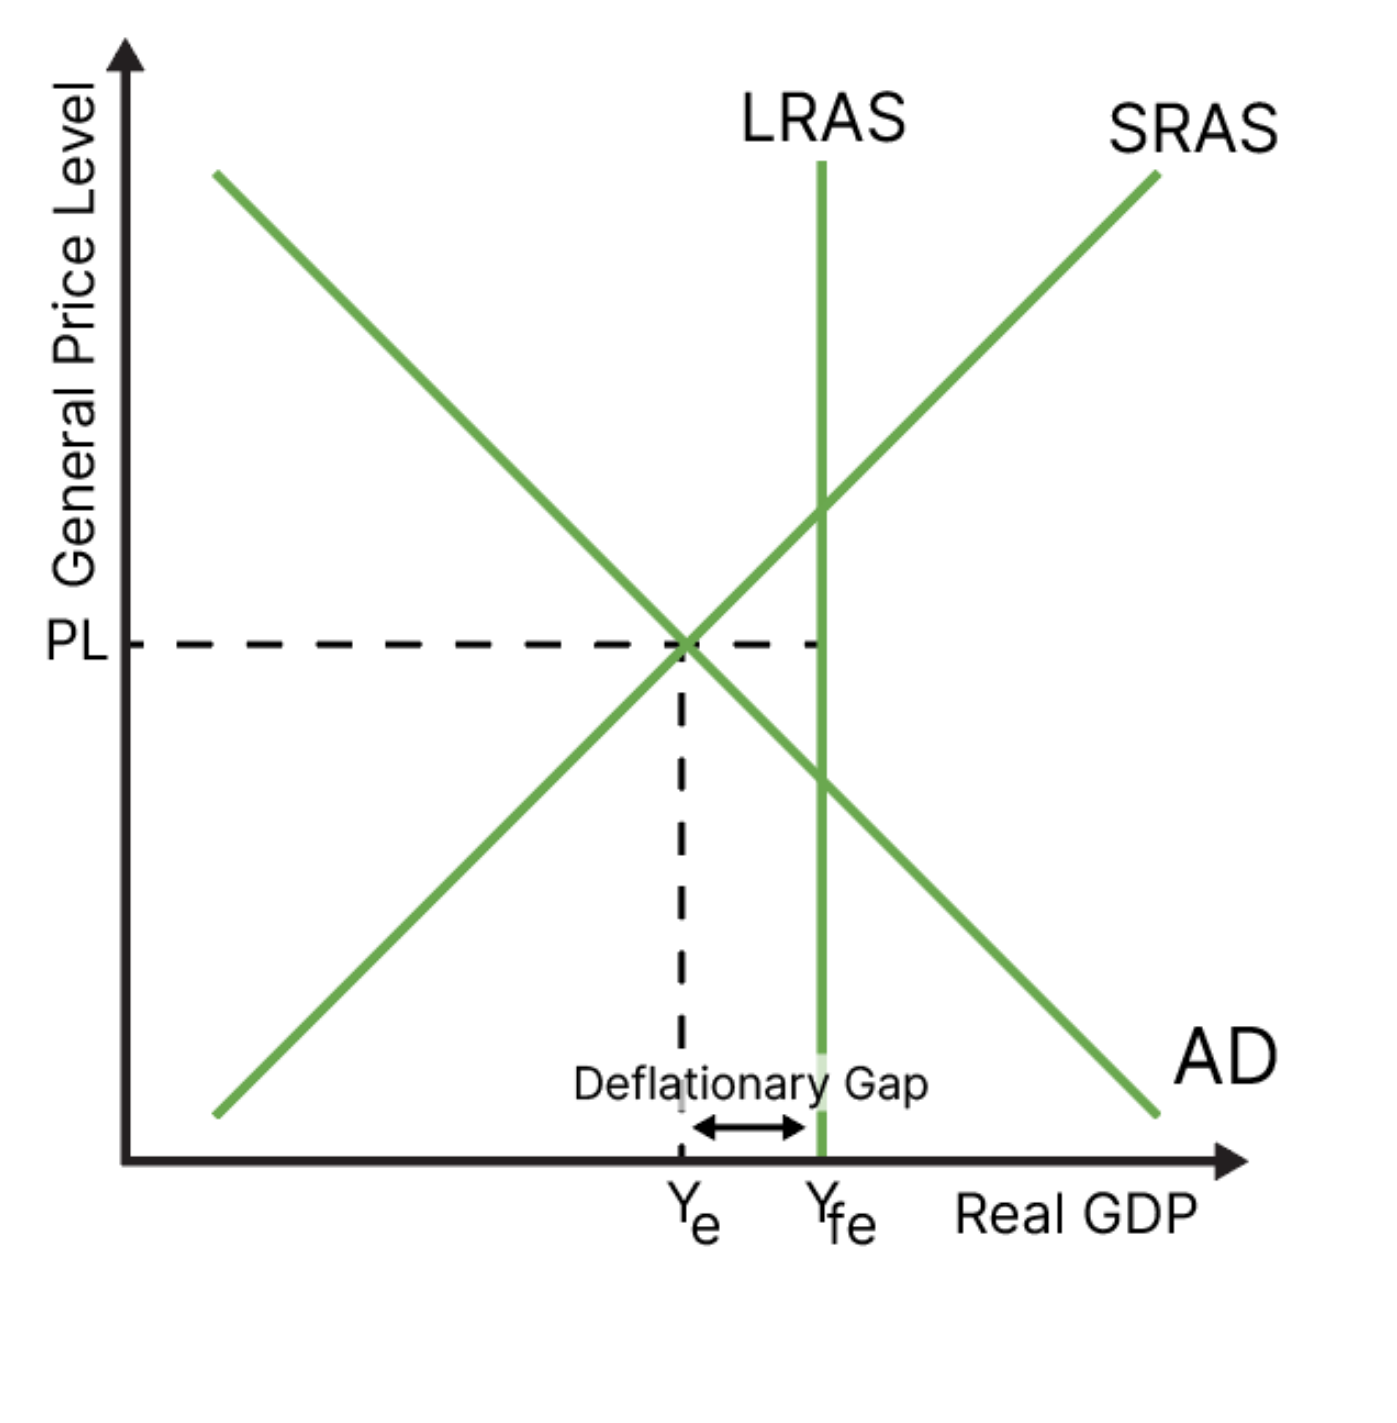
Actual output falls short of potential output (Y < Yp). This generates idle factory capacity and structural unemployment, so at least one factor of production is underemployed (inefficient).
<p>Actual output falls short of potential output (Y &lt; Yp). This generates idle factory capacity and structural unemployment, so at least one factor of production is underemployed (inefficient).</p>
54
New cards
Evaluating Economic Shocks
Shock severity hinges on duration, geographic scale, policy response capabilities, and local labor market flexibility.
55
New cards
Supply-Side Effect of Cheaper Imports
Lower foreign input prices reduce domestic production costs, shifting SRAS outward, expanding real output while lowering inflation.
56
New cards
Economic Growth Definition
An increase in real GDP or productive capacity over a specified time period.
57
New cards

Actual Growth vs Potential Growth

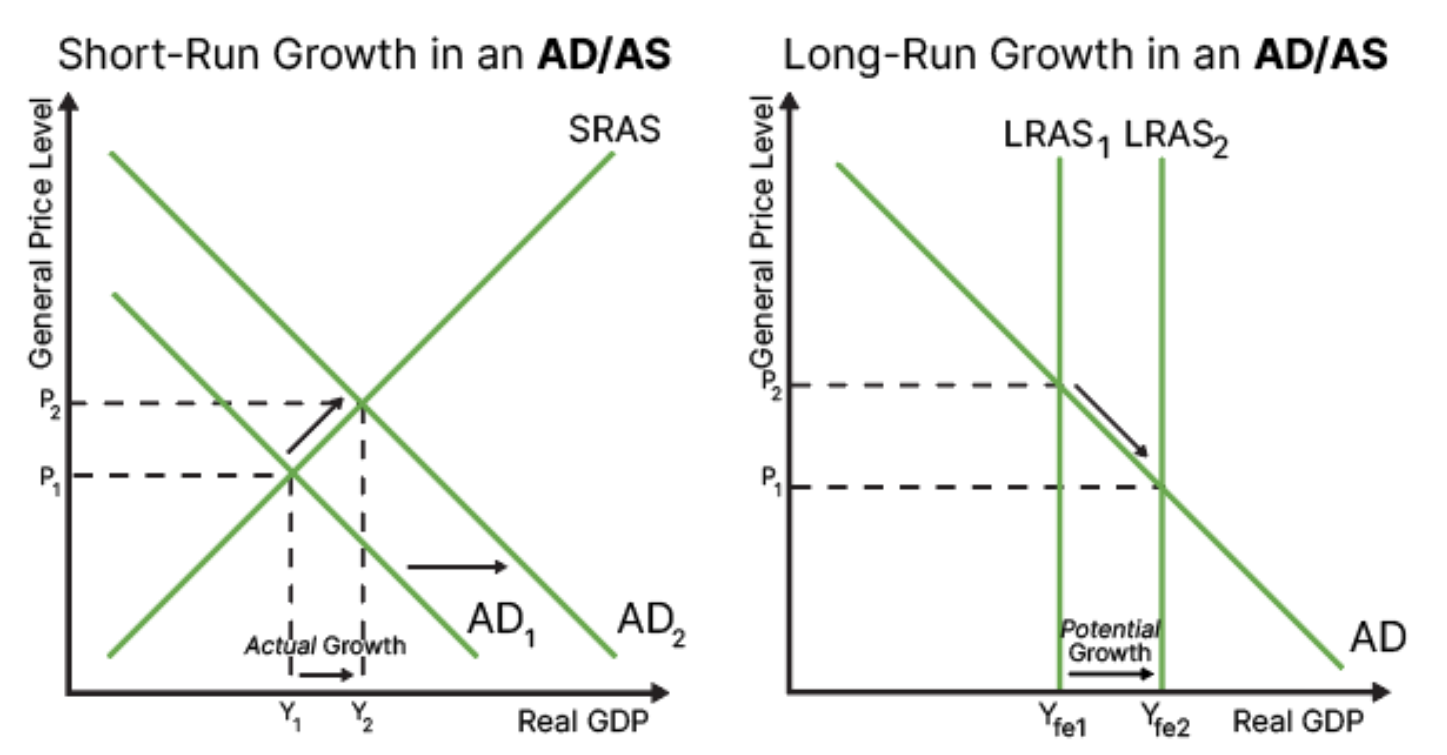
Short-term growth refers to actual growth in the economy, meaning a rightward shift in AD. Long-term growth refers to potential growth in the economy: In the long run, the economy could get to this point. 
<p class="zfr3Q CDt4Ke " style="text-align: left;"><span>Short-term growth refers to <strong>actual</strong> growth in the economy, meaning a rightward shift in AD</span>. <span>Long-term growth refers to <strong>potential</strong> growth in the economy: In the long run, the economy <em>could</em> get to this point.&nbsp;</span></p>
58
New cards

Diagrammatic Representation of Growth

Short-run growth shifts AD rightward toward potential output. Long-run growth shifts LRAS or the PPC rightward and is determined by potential GDP (economic growth).
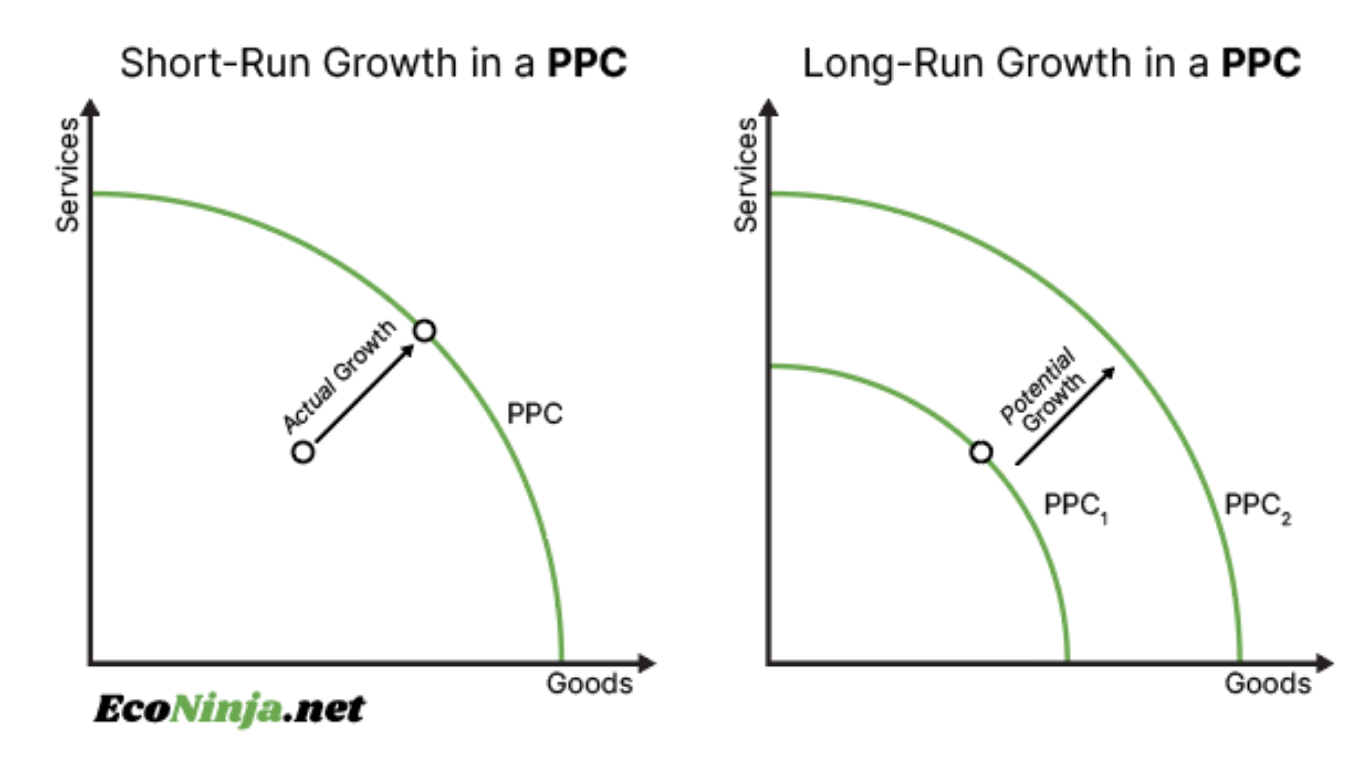
<p>Short-run growth shifts AD rightward toward potential output. Long-run growth shifts LRAS or the PPC rightward and is determined by potential GDP (economic growth).</p>
59
New cards
Benefits of Economic Growth
Raises average living standards, reduces absolute poverty, generates higher tax revenues, and stimulates private investment.
60
New cards
Costs of Economic Growth
Accelerates resource depletion, elevates industrial pollution, worsens income inequality, and risks severe demand-pull inflation.
61
New cards
Trade-off: Economic Growth vs Inflation
Rapid short-run aggregate demand expansion absorbs spare capacity, forcing up price levels unless matched by LRAS expansion.
62
New cards
Trade-off: Economic Growth vs Environmental Sustainability
Surging industrial production accelerates carbon emissions, exacerbates climate damage, and depletes natural resources.
63
New cards
Trade-off: Economic Growth vs Income Distribution
Unregulated market growth enriches skilled knowledge workers and capital owners while leaving low-skilled labor behind.
64
New cards
Trade-off: Economic Growth vs Current Account
Rising domestic real incomes prompt consumers to import expensive luxury goods, deepening current account trade deficits.
65
New cards
Trade-off: Economic Growth vs Unemployment
Automation and long-run efficiency gains expand productive potential while replacing workers, increasing structural unemployment.
66
New cards
Easterlin Paradox
Rising national income increases happiness at lower income levels, but beyond a critical threshold, further income gains yield minimal happiness gains.
67
New cards
National Wellbeing Measures
Composite metrics evaluating healthcare quality, environmental safety, education levels, and social cohesion alongside real GDP per capita.
68
New cards
National Wellbeing vs GDP per Capita
Standard GDP per capita ignores wealth concentration, mental health strains, and unpaid domestic labor, making composite wellbeing measures superior.
69
New cards
Recessions and Structural Trends
Two consecutive quarters of negative real GDP growth. Features surging bankruptcies, rising unemployment, falling investment, and deteriorating state budgets.
70
New cards
Unemployment Definition
Working-age individuals without work, available for work, and actively seeking employment within the past four weeks.
71
New cards

Unemployment Rate Formula

Unemployment Rate = (Number of Unemployed / Total Active Labor Force) * 100.

72
New cards
ILO Labor Force Survey
Standardized international survey tracking jobless individuals actively seeking work over four weeks and ready to start within two weeks.
73
New cards
Official Registration / Claimant Count
Government administrative tally measuring individuals officially claiming state unemployment benefits.
74
New cards
LFS vs Claimant Count Differences
Claimant counts understate unemployment by excluding job seekers ineligible for benefits, whereas the ILO survey captures non-claiming job seekers.
75
New cards

Frictional Unemployment

Unemployment occurs as people transition to a new job. There will be a few weeks or months when people are updating their resumes, applying for jobs, and attending interviews. 

76
New cards

Structural Unemployment

Long-term unemployment is caused by a mismatch of worker skills and employer demands, geographical immobility, or automation. Very much a supply-side issue.

77
New cards

Cyclical (Demand-Deficient) Unemployment

Unemployment as a result of a downturn in the business cycle (a lack of demand for work). It can be represented using a deflationary gap on an AD/AS curve.

78
New cards

Seasonal Unemployment

Predictable job losses occur in industries tied to specific seasonal cycles, like tourism or agriculture, which are basically solely dependent on periodic changes in demand.

79
New cards
Real-Wage Unemployment
Occurs when minimum wage laws or union bargaining force real wages above market-clearing equilibrium, creating labor surpluses.
80
New cards

Natural Rate of Unemployment (NRU)

Unemployment exists when the labor market reaches equilibrium at potential output (Yp). Calculated by adding Structural + Seasonal + Frictional all together. 

81
New cards

Costs of Unemployment to Workers & Society

Loss of disposable income, poverty, skill degradation, bad for family relationships, mental distress, indebtedness, widening social inequality, and elevated crime rates.

82
New cards

Costs of Unemployment to Government/Economy

Falling income tax revenues, lower indirect tax receipts, and surging expenditure on social welfare benefits. Lower GDP and more inequality.

83
New cards
Remedial Policies for Structural Unemployment
State-funded job retraining programs, relocation subsidies, vocational training grants, and labor market deregulation.
84
New cards
Inflation Definition
A sustained, generalized increase in the average price level across an economy over time.
85
New cards
Disinflation Definition
A deceleration in the rate of inflation while average price levels continue to rise.
86
New cards

Deflation Definition

Deflation is the sustained fall in the general price level in an economy over time.

87
New cards

Consumer Price Index (CPI)

Price index tracking changes in the cost of a representative consumer basket of goods and services over time. A base year. At the base year, the price index of goods and services are equal to 100.

<p>Price index tracking changes in the cost of a representative consumer basket of goods and services over time. <span>A base year. At the base year, the price index of goods and services are equal to 100.</span></p>
88
New cards

CPI Inflation Rate Formula

The percentage change between the current CPI and the previous CPI.

<p><span>The percentage change between the </span><strong>current CPI</strong> and the <strong>previous CPI</strong>.</p>
89
New cards
Constructing the CPI Basket
Government agencies survey thousands of households to select common consumer goods, weighting each item by its expenditure share.
90
New cards

CPI Limitations

Excludes non-standard spending, has time lags, and doesn't capture informal market purchases. It averages households, neglects regional inflation variation, ignores product quality changes, and neglects evolving consumption patterns (maybe needs new basket construction).

91
New cards
Substitution Bias in CPI
CPI uses fixed basket weights, understating living standard adjustments when consumers swap expensive goods for cheaper substitutes.
92
New cards
Quality Bias in CPI
Price increases often reflect technological product upgrades rather than pure inflation, overstating true living cost spikes.
93
New cards
Producer Price Index (PPI)
Tracks price changes received by domestic producers for output, serving as an early indicator of consumer inflation.
94
New cards
Retail Price Index (RPI)
Alternative price index including housing costs and mortgage interest payments; usually yields higher figures than CPI.
95
New cards

Demand-Pull Inflation

  • Inflation is caused by higher demand for goods and services in the economy, which grows faster than the supply. 

  • It is considered "good" inflation because while the general price level rises, real GDP does so, too.
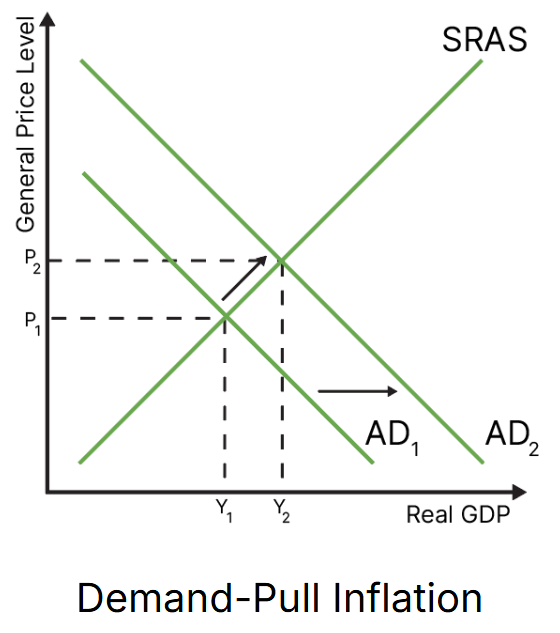
<ul><li><p class="zfr3Q CDt4Ke " style="text-align: left;"><span>Inflation is caused by higher demand for goods and services in the economy, which grows faster than the supply.&nbsp;</span></p></li><li><p class="zfr3Q CDt4Ke " style="text-align: left;"><span>It is considered "good" inflation because while the general price level rises, real GDP does so, too.</span></p></li></ul><p></p>
96
New cards

Cost-Push Inflation

Inflation is caused by higher production costs, which shift AS to the left. Considered the "bad" inflation, because prices rise and real GDP shrinks.
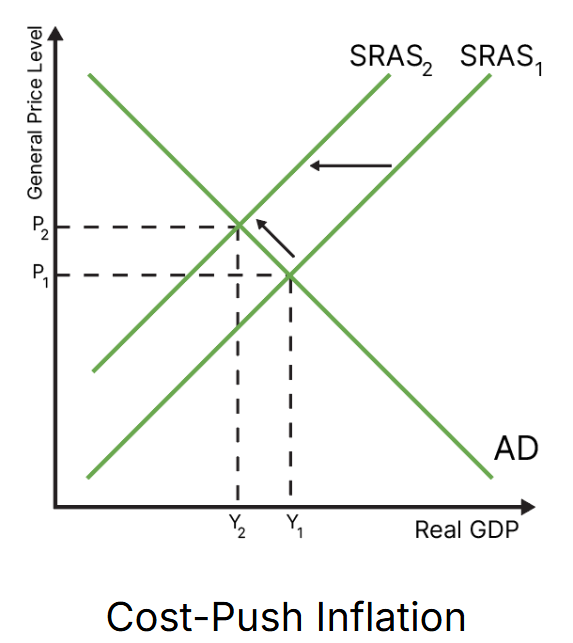
<p class="zfr3Q CDt4Ke " style="text-align: left;"><span>Inflation is caused by higher production costs, which shift AS to the left.&nbsp;Considered the "bad" inflation, because prices rise and real GDP shrinks.</span></p>
97
New cards
Wage-Price Spiral
Rising prices force workers to demand higher nominal wages, increasing firm production costs and driving prices higher.
98
New cards
Deflationary Spiral
Falling prices encourage consumers to delay spending, dropping aggregate demand, deepening recessions, and driving prices down further.
99
New cards

Supply-Side vs Demand-Side Deflation

Supply-side deflation stems from technological progress shifting LRAS rightward (beneficial deflation). Demand-side deflation stems from a collapse in AD (malignant deflation). add relevant formula/diagram

100
New cards
Costs of High Inflation
Erodes real purchasing power, penalizes savers when real interest rates turn negative, creates uncertainty, and degrades export competitiveness.



