Waveforms and Measurements
1/29
There's no tags or description
Looks like no tags are added yet.
Name | Mastery | Learn | Test | Matching | Spaced |
|---|
No study sessions yet.
30 Terms
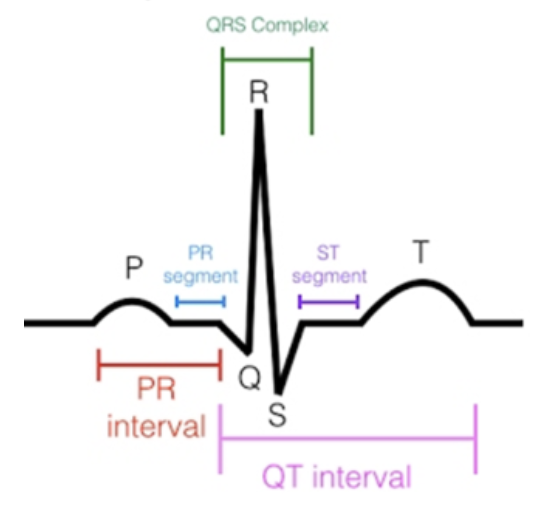
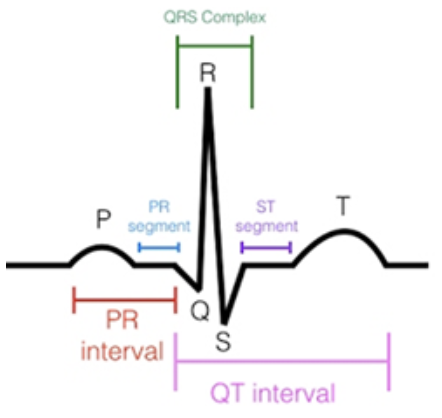
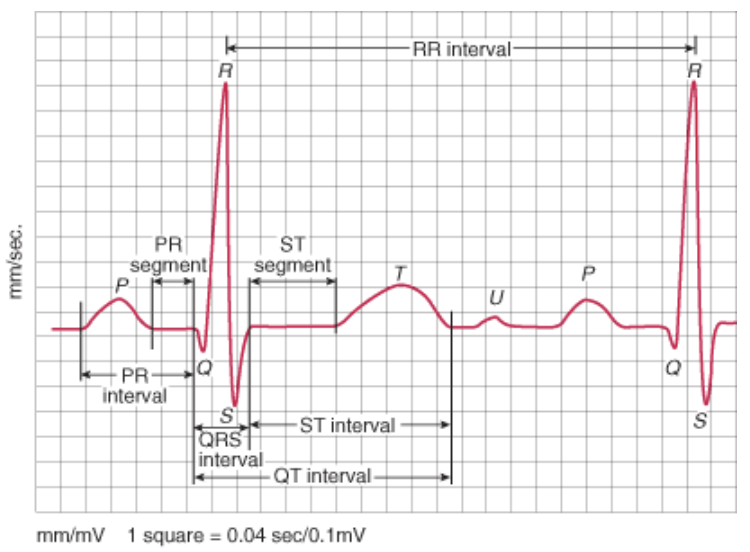
P wave
Wave that precedes (comes before) the QRS wave complex
represents atrial depolarization
smooth and rounded
positive deflection
above baseline
0.5 - 2.5 mm in amplitude
P wave variations:
peaked
wide
notched
inverted/negative
below baseline
occurs when ectopic pacemaker is below the AV junction
Ta wave
Lost in QRS complex
cannot measure / “see” on EKG strip
represents atrial repolarization
PR Segment
Segment → a line between waveforms
represents delay in conduction through the AV node
~0.1 s
normally an isoelectric / flat line
b/c the conducting structures within the heart are so small the electricity within them is not detected
PR Interval (PRI)
Interval - a waveform + a segment
P wave + PR segment
ends w/ onset of QRS
0.12 - 0.20 s in duration
3-5 small boxes
QRS Complex
Complex - consists of several waveforms
Represents ventricular depolarization
atrial repolarization usually takes place at this time (Ta wave)
QRS complex overshadows Ta wave)
0.06 - 0.10 s
< 0.12 s in duration
direction of QRS complex may be predominantly positive, predominantly negative, or biphasic (part positive, part negative)
will see normal variatins of waveforms
Q wave
initial (first) negative (downward) deflection following P wave
precedes R wave

R wave
Initial positive (upward) deflection following P wave
S wave
negative deflection
follows R wave

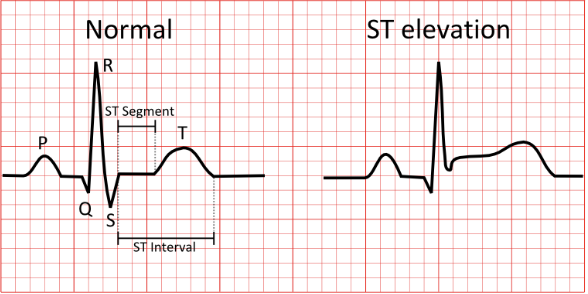
ST Segment
end of QRS to beginning of T wave
represents early portion of ventricular repolarization
“J point”
point at which QRS meets ST segment
normally isoelectric w/ J point
sensitive indicator of MI and ischemia
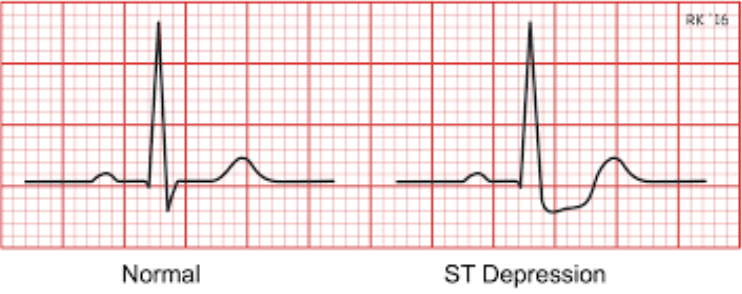
Abnormal ST segments:
ST segment elevation
ST element depression
ST segment depression
Suggestive of chronic MI
ST segment elevation
Suggestive of acute MI
T wave
represents ventricular repolarization
the absolute refractory period is still present during the beginning of the T wave
relative refractory period begins at the peak of the T wave
during RRP, a stimulus may produce a new impulse and result in arrhythmias
sensitive indicator of MI and ischemia
Normal T wave appearance:
upright
rounded
larger than P wave
slightly asymmetrical
ends when return to baseline
QT Interval
beginning of QRS complex to end of T wave (all)
represents total ventricular activity
ventricular depolarization and repolarization
QT interval varies w/:
heart rate
age
gender
Measuring the Heart Rate
HR = BPM (beats per minute)
Atrial rate
look at P waves
Ventricular rate
look at R waves, or peak of QRS complex
Record time and count beats per second
or 30 s and mult by 2
or 15 s and mult by 4
3 methods to calculate / estimate HR:
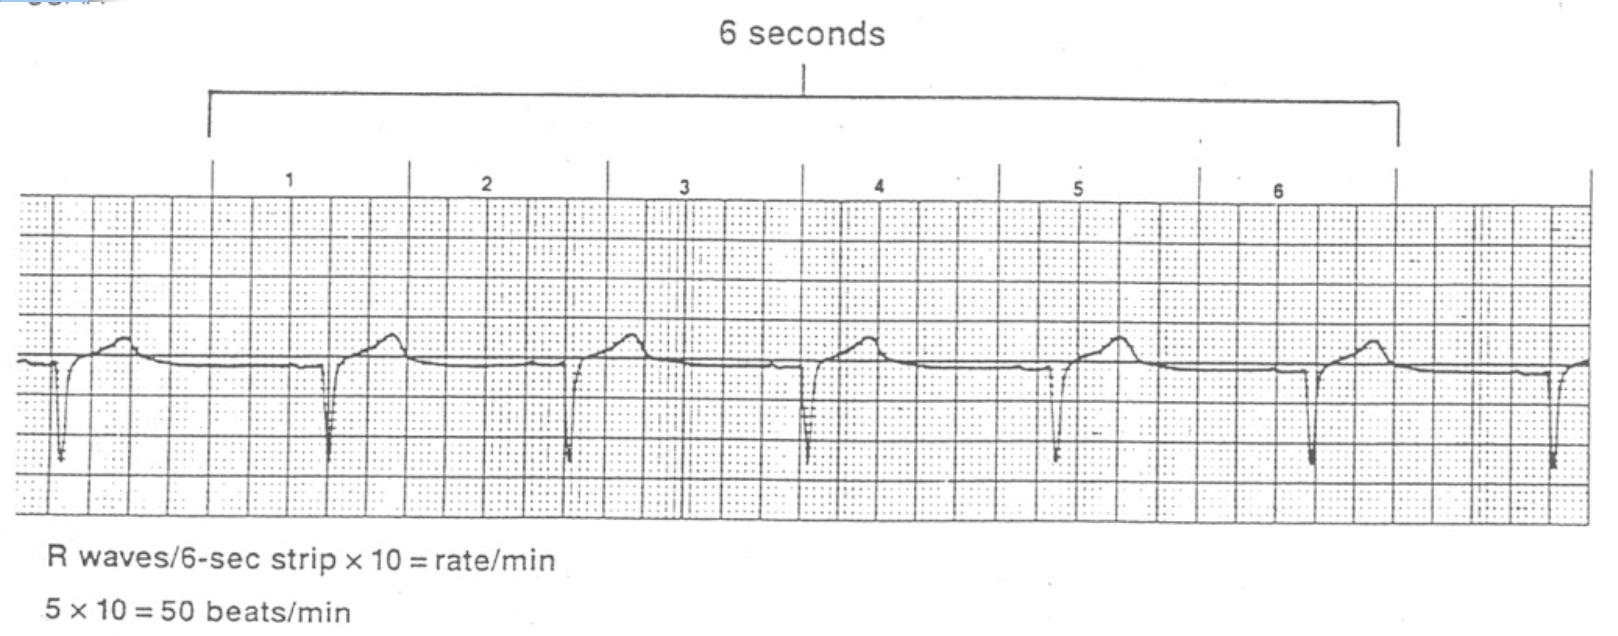
6 second method
R-R method / P-P method
Sequence method
6 second method
count number of complete QRS complexes within 6 second period and multiply by 10
30 large boxes
usually marked on strip chart
we can assume all strips are 6 sec in length
simplest, quickest, most common method
R-R method / P-P method
count number of large squares between two consecutive R waves / P waves and divide into 300
R waves give ventricular rate
P waves give atrial rate
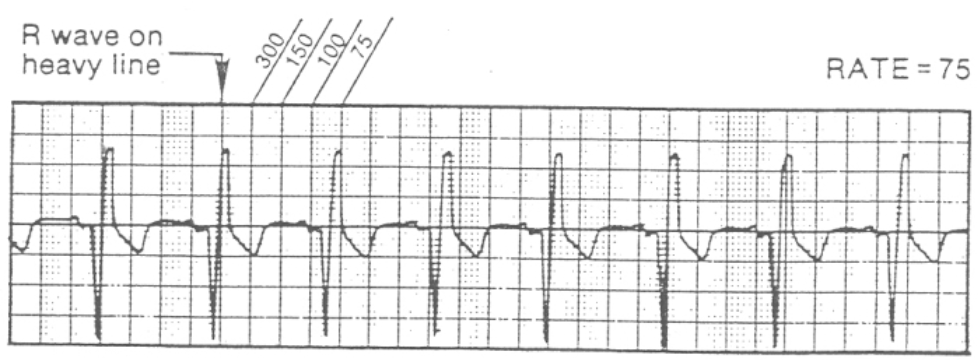
Sequence Method
assigns rate (number) to each vertical line
locate R wave that falls on (or near) thick vertical line)
count each thick line
300-150-100-75-60-50-43-38-33-30
until next R wave
To determine the Rhythm / Regularity:
use calipers to compare distance of “intervals” on same strip
variations up to 0.12 s is technically WNL
3 small boxes
the slower the HR, the more acceptable the variation
classify as:
regular
normal rhythm
irregular
arrhythmia or dysrhythmia
To determine Ventricular Rhythm:
measure distance between 2 consecutive R-R intervals and compare with other R-R interval
regular if close to same distance between each R-R interval
normal rhythm
variation of up to 0.12 s is acceptable
irregular if different measurement between each R-R interval
arrhythmia / dysrhthmia
To determine Atrial Rhythm:
Do same as determining ventricular rhythm but with P-P intervals
Analyzing P wave:
one should precede each QRS complex
present and uniform in appearance?
is the atrial rate equal to the ventricular rate?
Analyzing PRI:
use calipers to measure interval
normal length → 0.12 - 0.2 s
should not vary from beat to beat
Analyzing QRS complex:
use calipers to measure interval
normal length → < 0.12 s
should all be uniform
Determine Rate:
use one of 3 methods
6 second - easiest
Ventricular rate
R waves counted
Atrial rate
P waves counted
Report the BPM
Classify as:
Normal : 60-100 BPM
Bradycardic : <60 BPM
Tachycardic : >100 BPM
Determine Rhythm:
use calipers
Ventricular
R to R intervals
Atrial
P to P intervals
Classify as:
regular / normal
irregular / arrhythmic / dysrhythmic