Week 3 - Visualizing and Describing Data
 Call Kai
 Learn
Learn Practice Test
 Spaced Repetition
 Match
Match Flashcards
 Knowt Play
1/27

There's no tags or description
Looks like no tags are added yet.
Name | Mastery | Learn | Test | Matching | Spaced | Call with Kai | Chat |
|---|
No analytics yet
Send a link to your students to track their progress
28 Terms
Questions to Ask About Data
Frequency Distribution: How often does each score appear?
Shape: Do the scores center around one value?
Central Tendency: What is a typical score? Give me a single-number summary
Variability: How well does that single number represent all scores? Are more scores close to it, or are they spread out across a wide range?
Frequency Distribution
How often does each score appear?
Categorical data:
Are there equal number of people with blue, brown, green, and hazel eyes? Or are there some eye colors that are more common? By how much?
Continuous data:
Are there equal number of very unhappy, mildly unhappy, and very happy people? Which happiness level has more people? How many more?
How are responses distributed across levels?
Distribution: Categorical Data
Frequency Tables: the tally of how often each category (value) occurs in the data
Bar Charts: frequency of each category expressed as the height of a bar
Distribution: Continuous Data
Histogram: frequency of each range of values expressed as the height of a bar
Bin size
some data; some details get lost depending on the width of the bins (bars)
Shape
number of peaks, symmetry, tail
a normal distribution: a unimodal (one peak), symmetric bell curve with a particular shape
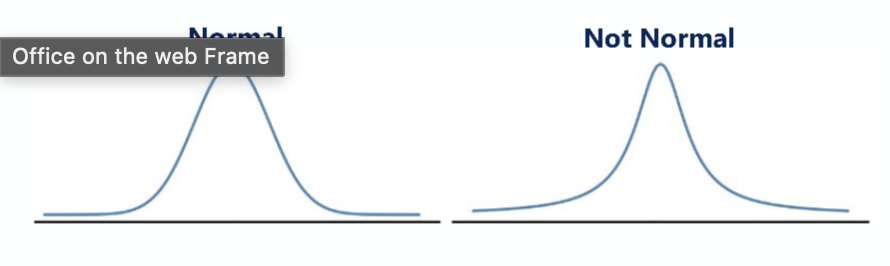
Shape of Distributions: Number of Peaks
multimodal distributions that have more than one peak need multiple summaries
there is not one “overall” tendency you can draw from it
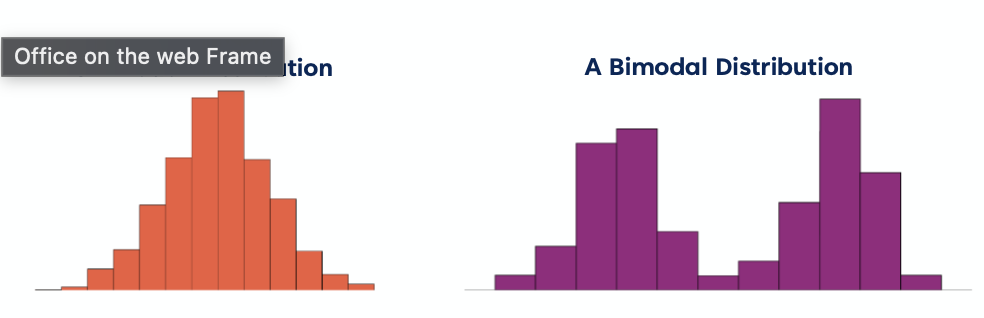
Shape of Distributions: Symmetry/Skew

Summarize Data with Descriptive Statistics
Descriptive Statistics: concise summaries to describe your data
central tendency: what is typical? give me a single number summary
variability: how spread out are the scores?
How well does that single number represent all scores?
are most scores close to it, or are they spread out across a wide range?

Central Tendency: What is typical?
Mean
Median
Mode
Mean: how to calculate
add all the scores together and divide by the total number of scores
mean = sum of all scores / number of scores
On a quiz with 50 students, all scores remained the same from quiz 1 to quiz 2, except the highest scorer improved from 6 to 10. Which measure of central tendency changed?
Mean
In a positively skewed distribution, fewer data fall above the mean.
True
Which Central Tendency Measures Should I Use?
Mean accounts for all scores, but outliers swing the mean a lot. NOT robust
If skewed or have outliers, use Median
For a unimodal distribution,
Symmetric: Mode = Median = Mean
Negative Skew
fewer data fall below the mean
Positive Skew: Mode < Median < Mean
fewer data fall above the mean
Variability: How spread out are the scores?
Range
Interquartile Range (IQR)
Variance
Standard Deviation (SD)
Range and Interquartile Range (IQR)
Range: Highest score - lowest score
provides some senes of how far apart the scores are
vulnerable to extreme scores because it only depends on two scores (highest and lowest)
commonly reported for participant age (shows no one is under 18)
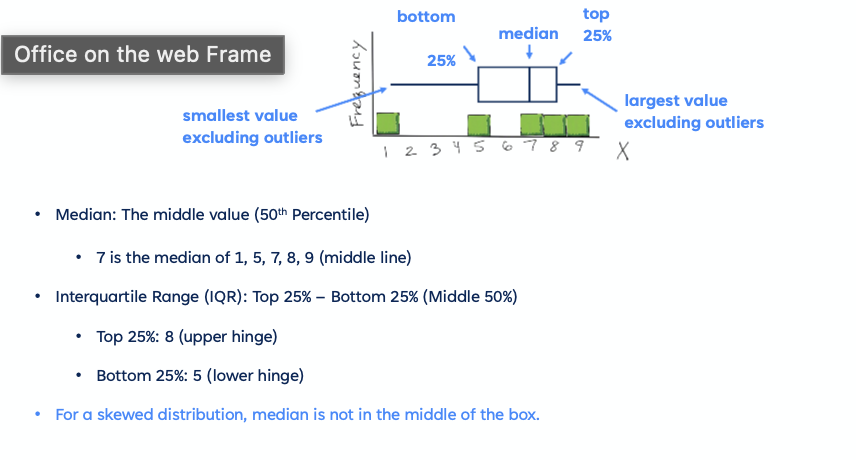
Interquartile Range (IQR): Top 25% - Bottom 25% (Middle 50%)
provides some sense of how representative the median is
robust to extreme scores
Median and IQR

Box Plots: Visualizing Median, IQR, and Range

Box Plots Show Skewness
How much do the scores deviate from the Mean?

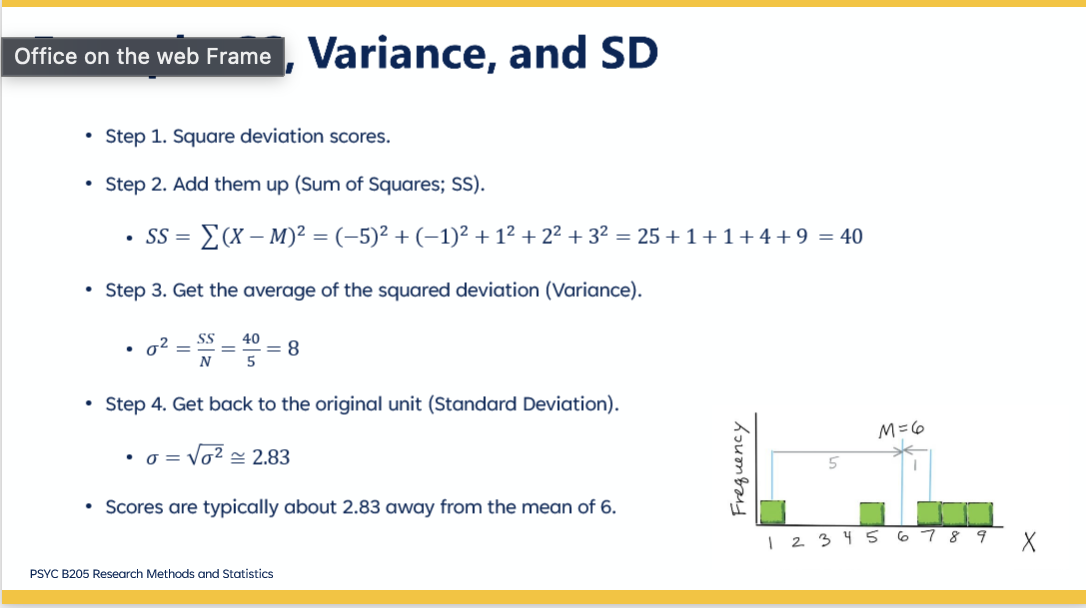
Sum of Squares, Variance, and Standard Deviation

Example: SS, Variance, and SD
Population Parameter vs. Sample Statistic
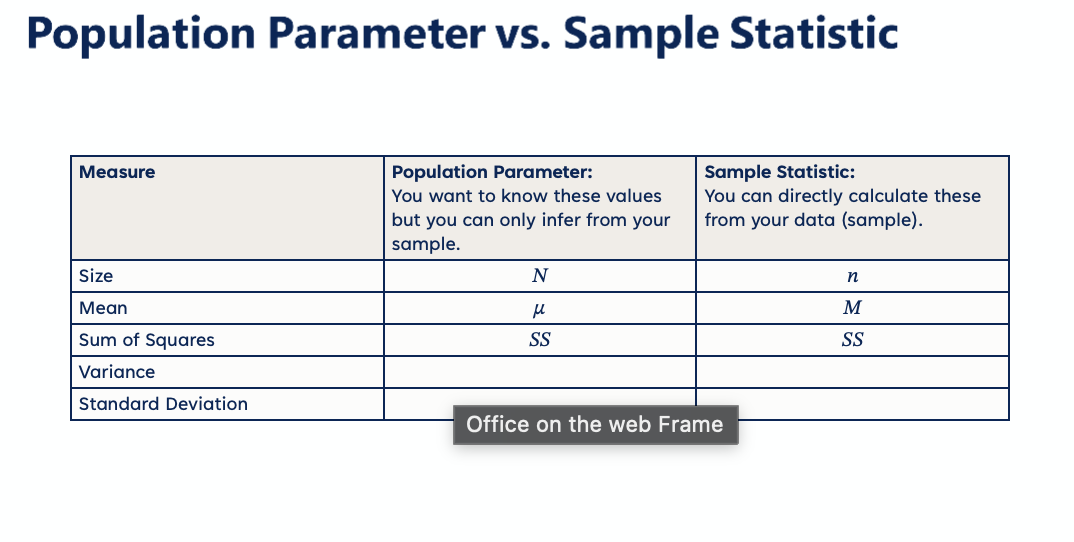
Fixing the Underestimated Sample Variance

Describe Data Example 1

Describe Data Example 2

Describe Data Example 3
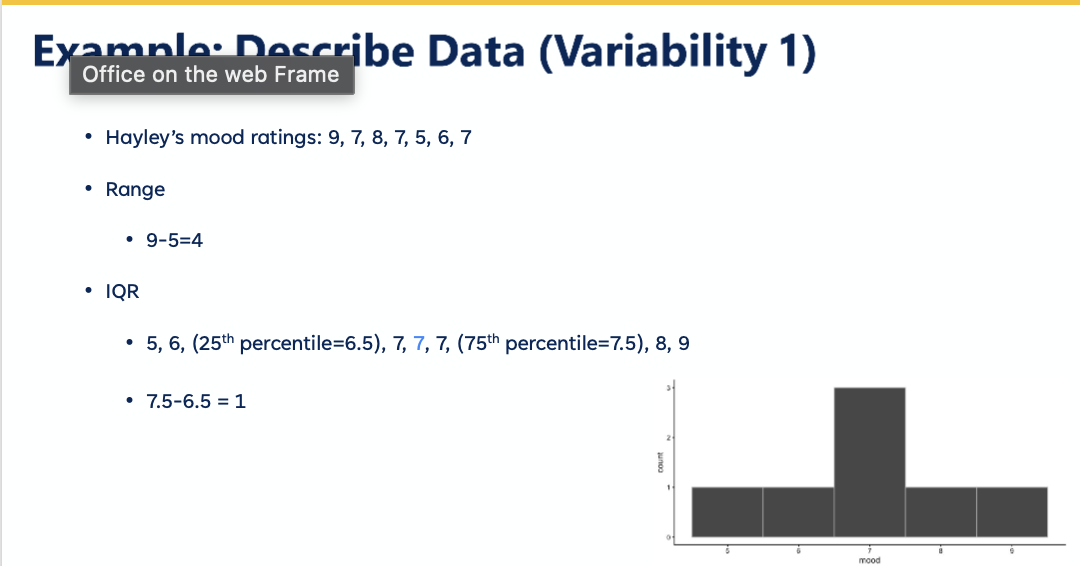
Describe Data Example 4
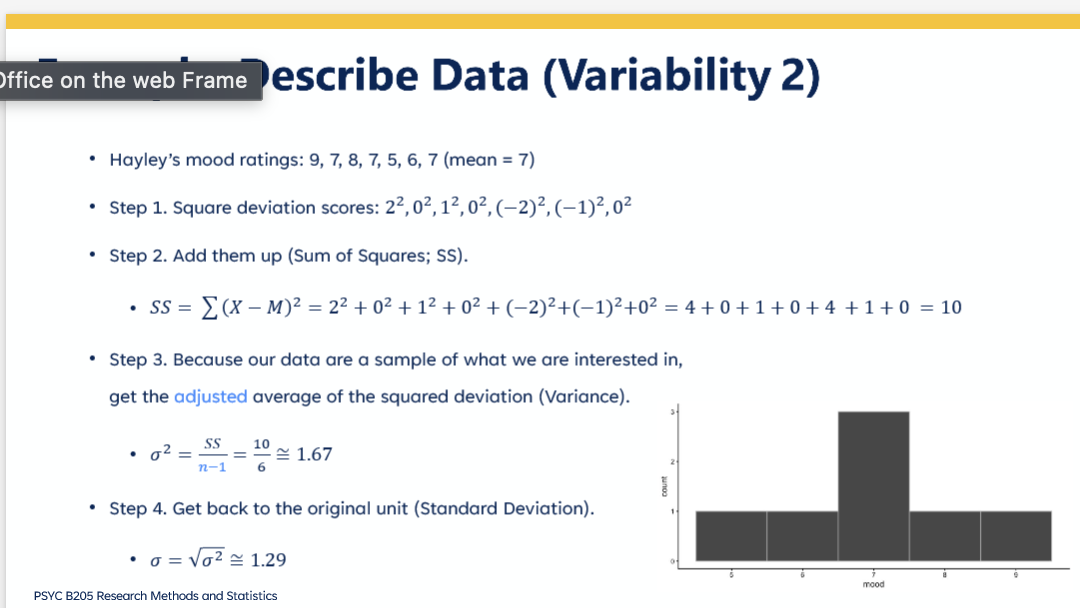
Describe Data Example 5
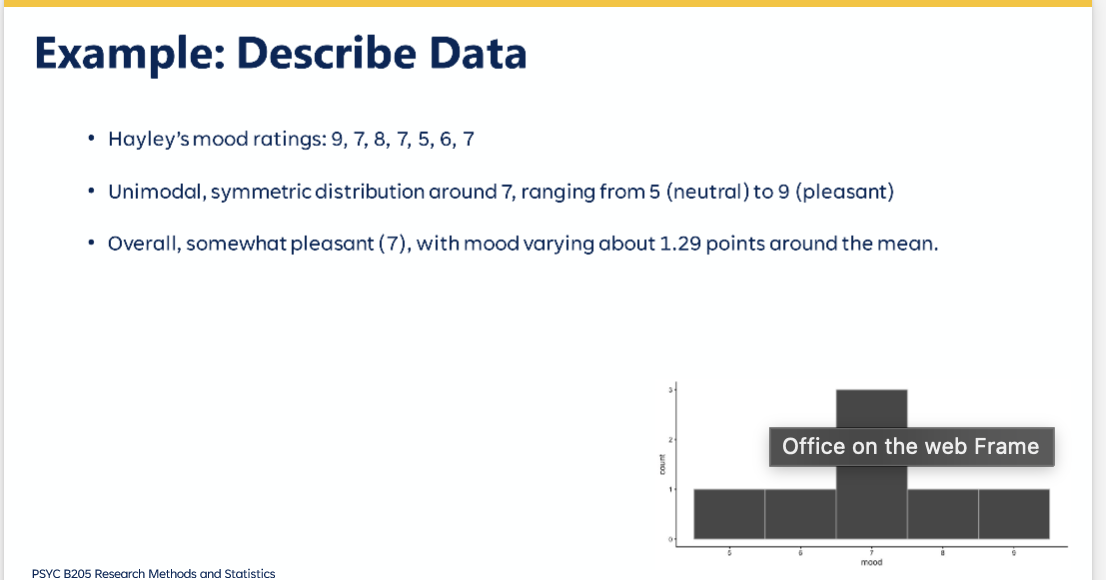
Which Variability Measures Should I Use?
Is mean an appropriate central tendency measure for your distribution (unimodal, symmetric)?
Yes → Report the variability around the mean (variance or standard deviation)
Yes → use SD
Not necessarily, because I want to use Variance for more math → use Variance
No → Then, is median appropriate?
Yes → Report the variability around the median (Interquartile Range)
No → Settle for Range