3) Climate Change and Extreme Weather
1/24
There's no tags or description
Looks like no tags are added yet.
Name | Mastery | Learn | Test | Matching | Spaced |
|---|
No study sessions yet.
25 Terms
The global reported natural disasters from 1974 - today are…
increasing
US Billion dollar disaster damage costs in the LAST DECADE were
at least $1.2 trillion from 173 separate billion dollar events
Climate is the
Aggregate Pattern of Weather (hot/cold, etc)
Climate Change Means: A Change in These Aggregate Patterns
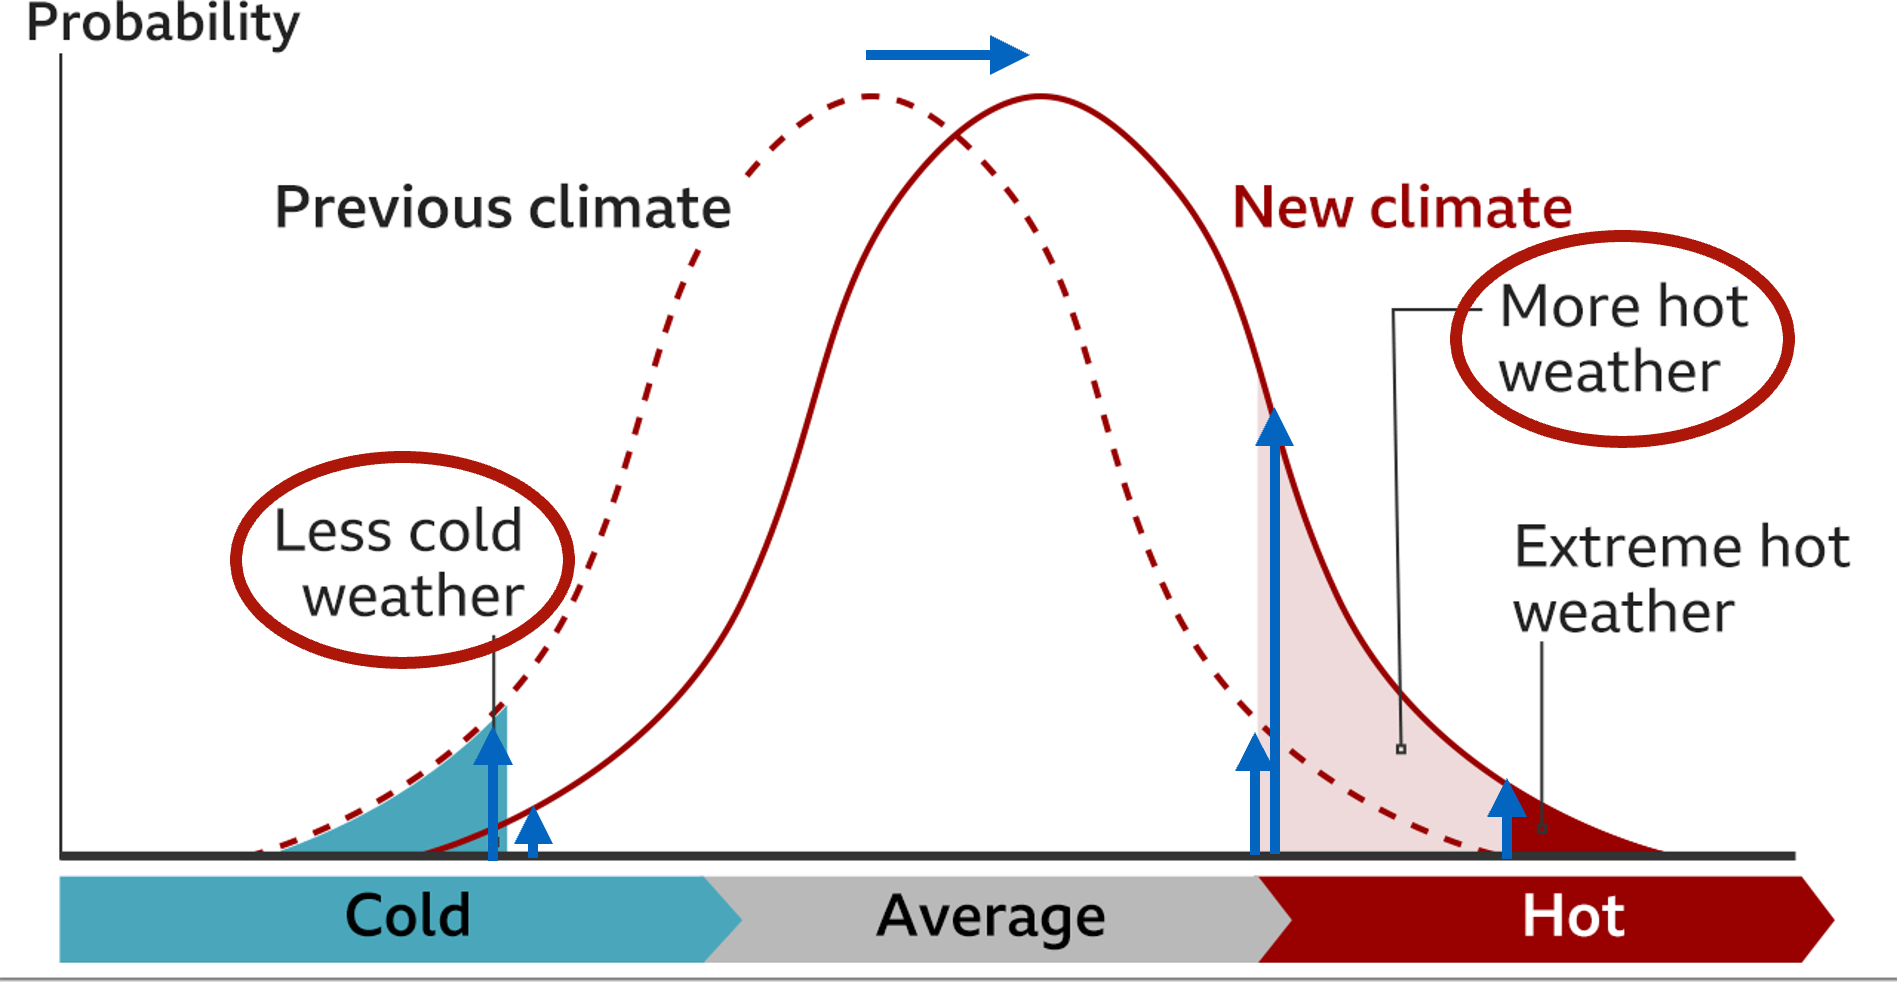
Small shifts in the mean produce…
Big shifts in the Extremes

Changes in drought/flooding with global warming
Dry regions will get drier from strong evaporation
Wet Regions will get wetter from strong precipitation
measure mass of water - wet = heavier mass
Why will there be stronger hurricanes?
Warmer surface ocean —> heat energy —> powers hurricanes
& more likely to rapidly surge to greater strength (catch local communities off guard)
IPCC It is very likely that human/athroprogenic forcing has
contributed to increased frequency/intensity of daily temperatures on the global scale since the mid 1900s
IPCC - It is an established fact that
human greenhouse gas emissions —> increased frequency/intensity of some weather and climate extremes
Extreme Weather Attribution
IPCC assessment trends
we can narrow down probabilities and quantify climate change’s role in specific events
give estimates while disaster is still relevant to people’s minds
It is virtually certain that human-caused greenhouse gas forcings is
the main driver behind observed changes in hot/cold extremes globally
Examples of observed changes
increase in heat waves (0 regions saw a decrease)
droughts (1 region increase)
heavy precipitation (0 regions saw a decrease)
Heat waves (by temperature) used to be once every 10 years(strong ones every 50 years) without human influence. How often will they be with 1.5 C warming?
heat wave every 2 years
50 year heat waves every 6 years
How often will precipitation/droughts be with 1.5 C warming?
heavy precipitation every 6 years
droughts - every 5 years
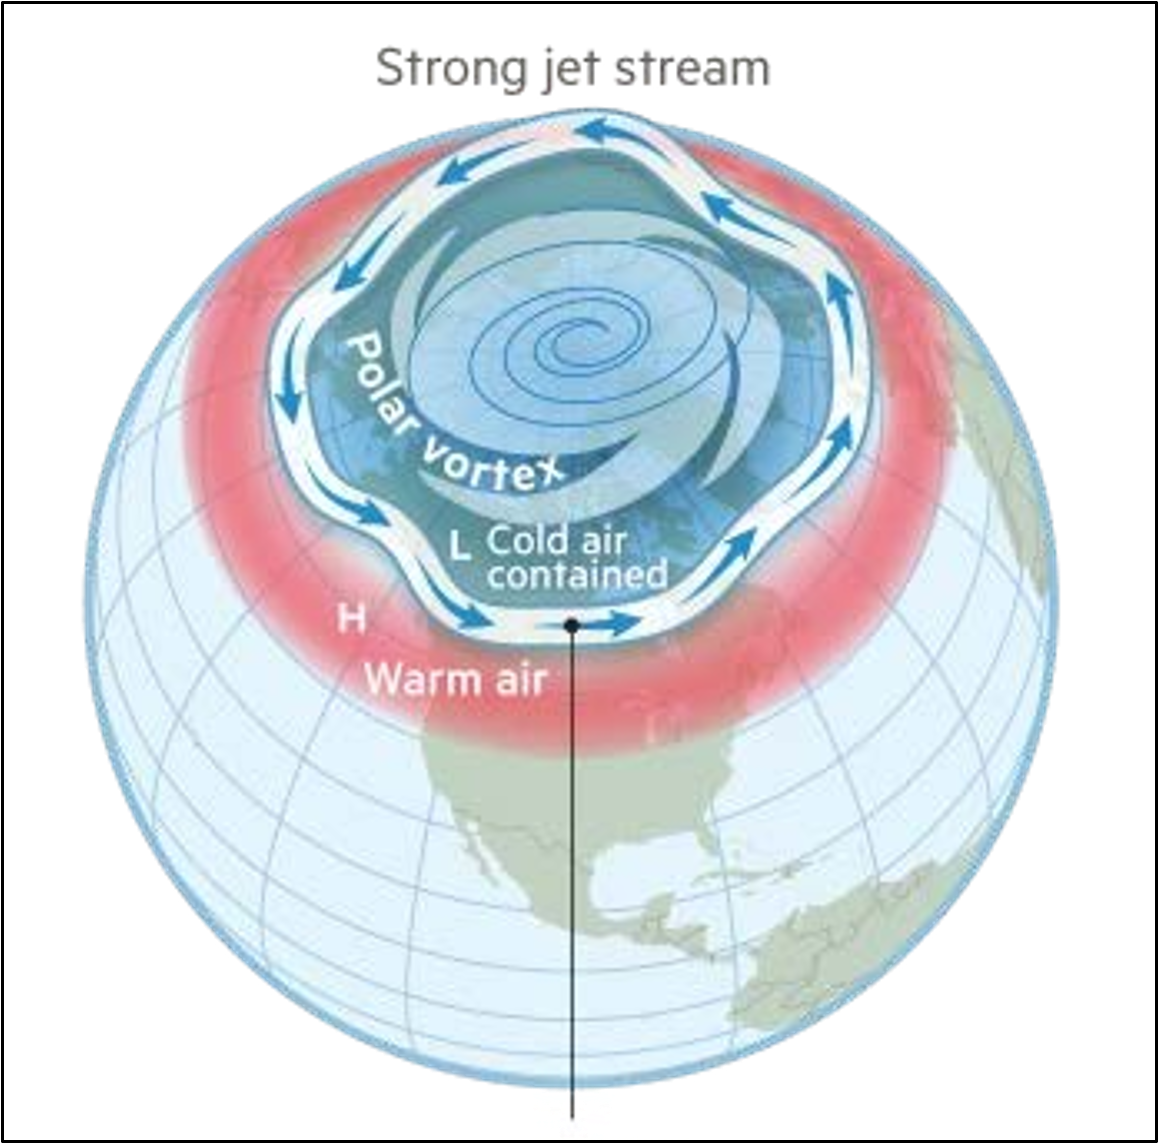
Normal Arctic Amplification Conditions - polar jet stream & pressure
Polar jet stream
separates cold arctic air from warmer air at lower latitudes.
is kept at high latitudes by a strong north-south atmospheric pressure gradient
this pressure gradient is proportional to the temperature difference between air masses on either side of the jet stream.
Change on Arctic Amplification with Climate Change
polar regions are heating 4x as fast as the global average —>
DEC temperature gradient between polar regions and low latitude regions —>
DEC north/south pressure gradient —>
wobbly slow jet stream and polar air goes to lower/mid latitudes
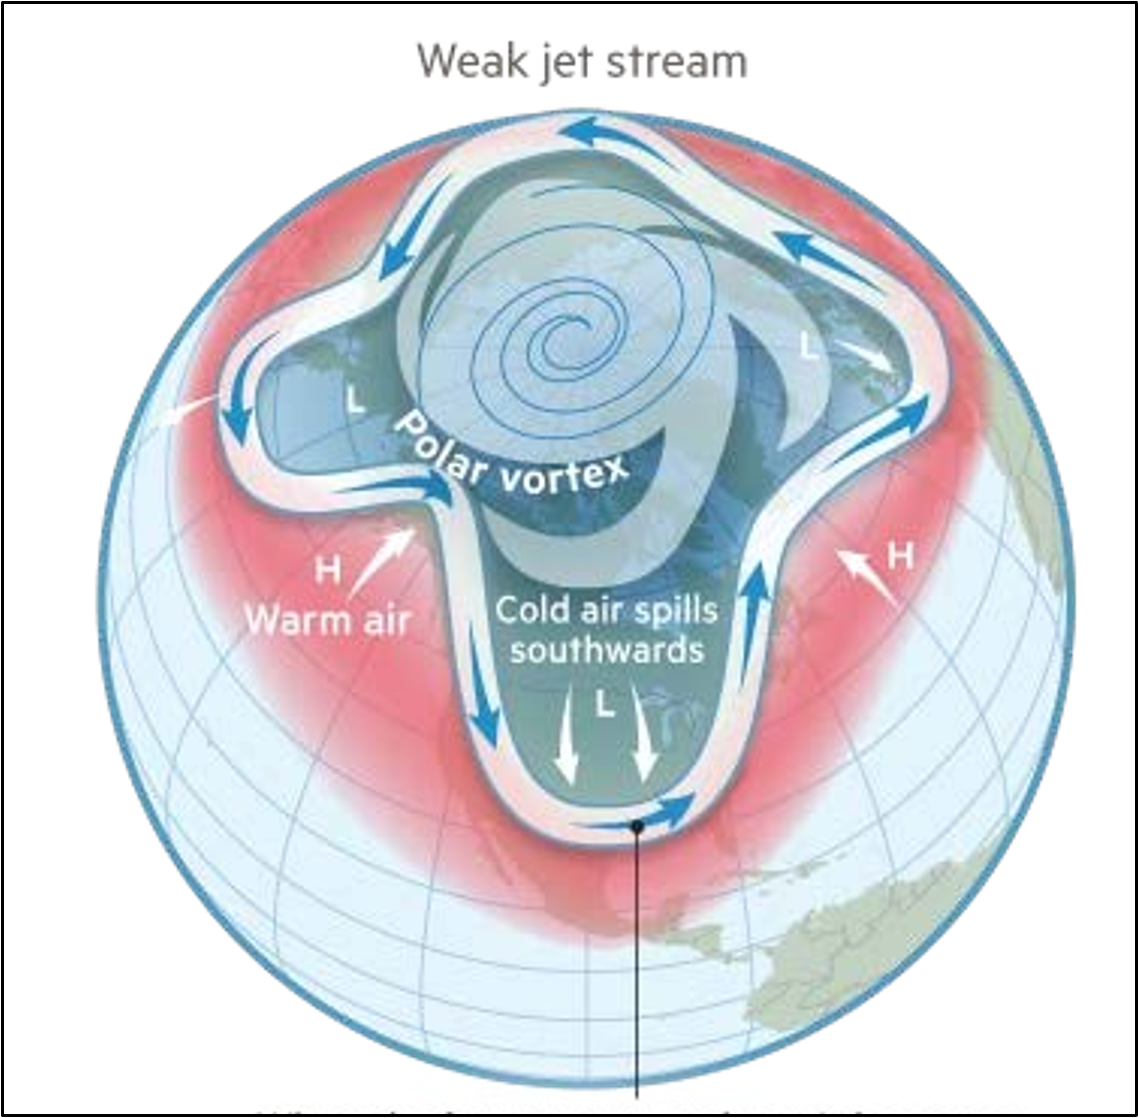
prolonged droughts —>
environment for more explosive wildfires
Heatwave impact on primary production
heat waves reduce primary production (can’t mix enough nutrients to grow them, stronger barrier)
shift the zooplankton population to smaller and less nutritious species —>
small fish species decline ☹ —>
seabirds eating fish die (more than oil spill) —>
sea lion pups/humpback and fin whales die
2024 hurricanes example
Hurricane Helene September 2024 / Hurricane Milton October 2024 (fueled by ocean heat)
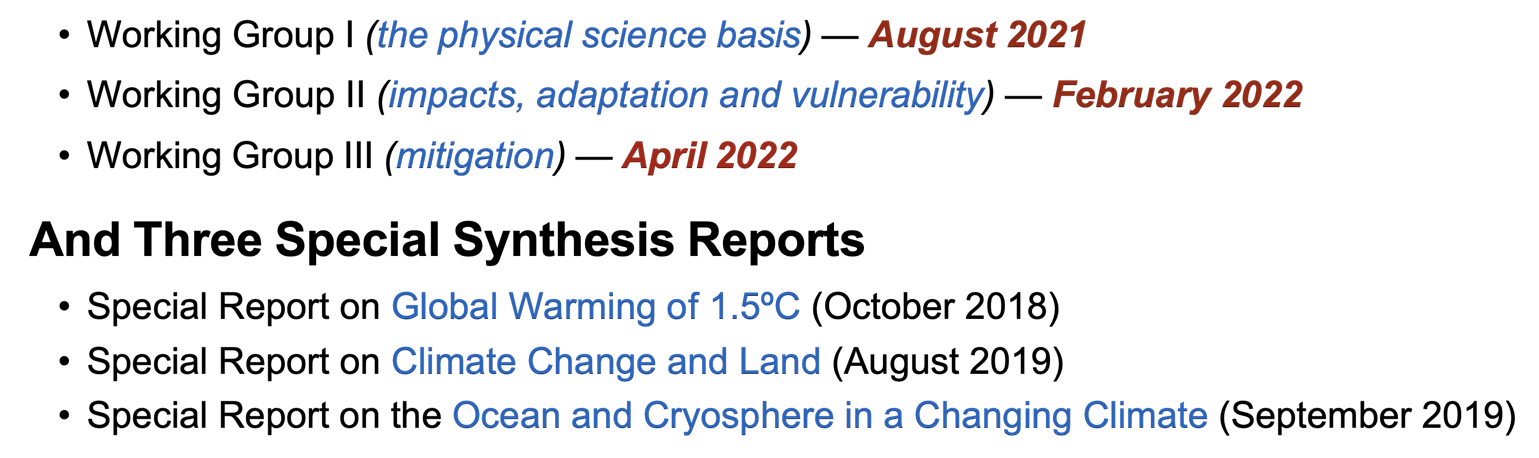
Intergovernmental Panel on Climate Change
Created by United Nations Environment Program (UNEP) and the World Meteorological Organization (WMO) in 1988 to give regular (5-7 year) assessments on climate change
assessment / special reports -drafted and reviewed, IPCC does not conduct its own research
neutral, not policy prescriptive (toned down)
IPCC working Groups
Numerical model simulations - how are they used ?
one case with human-caused greenhouse gas addition and without —> then compute how much more likely/intense extreme event is
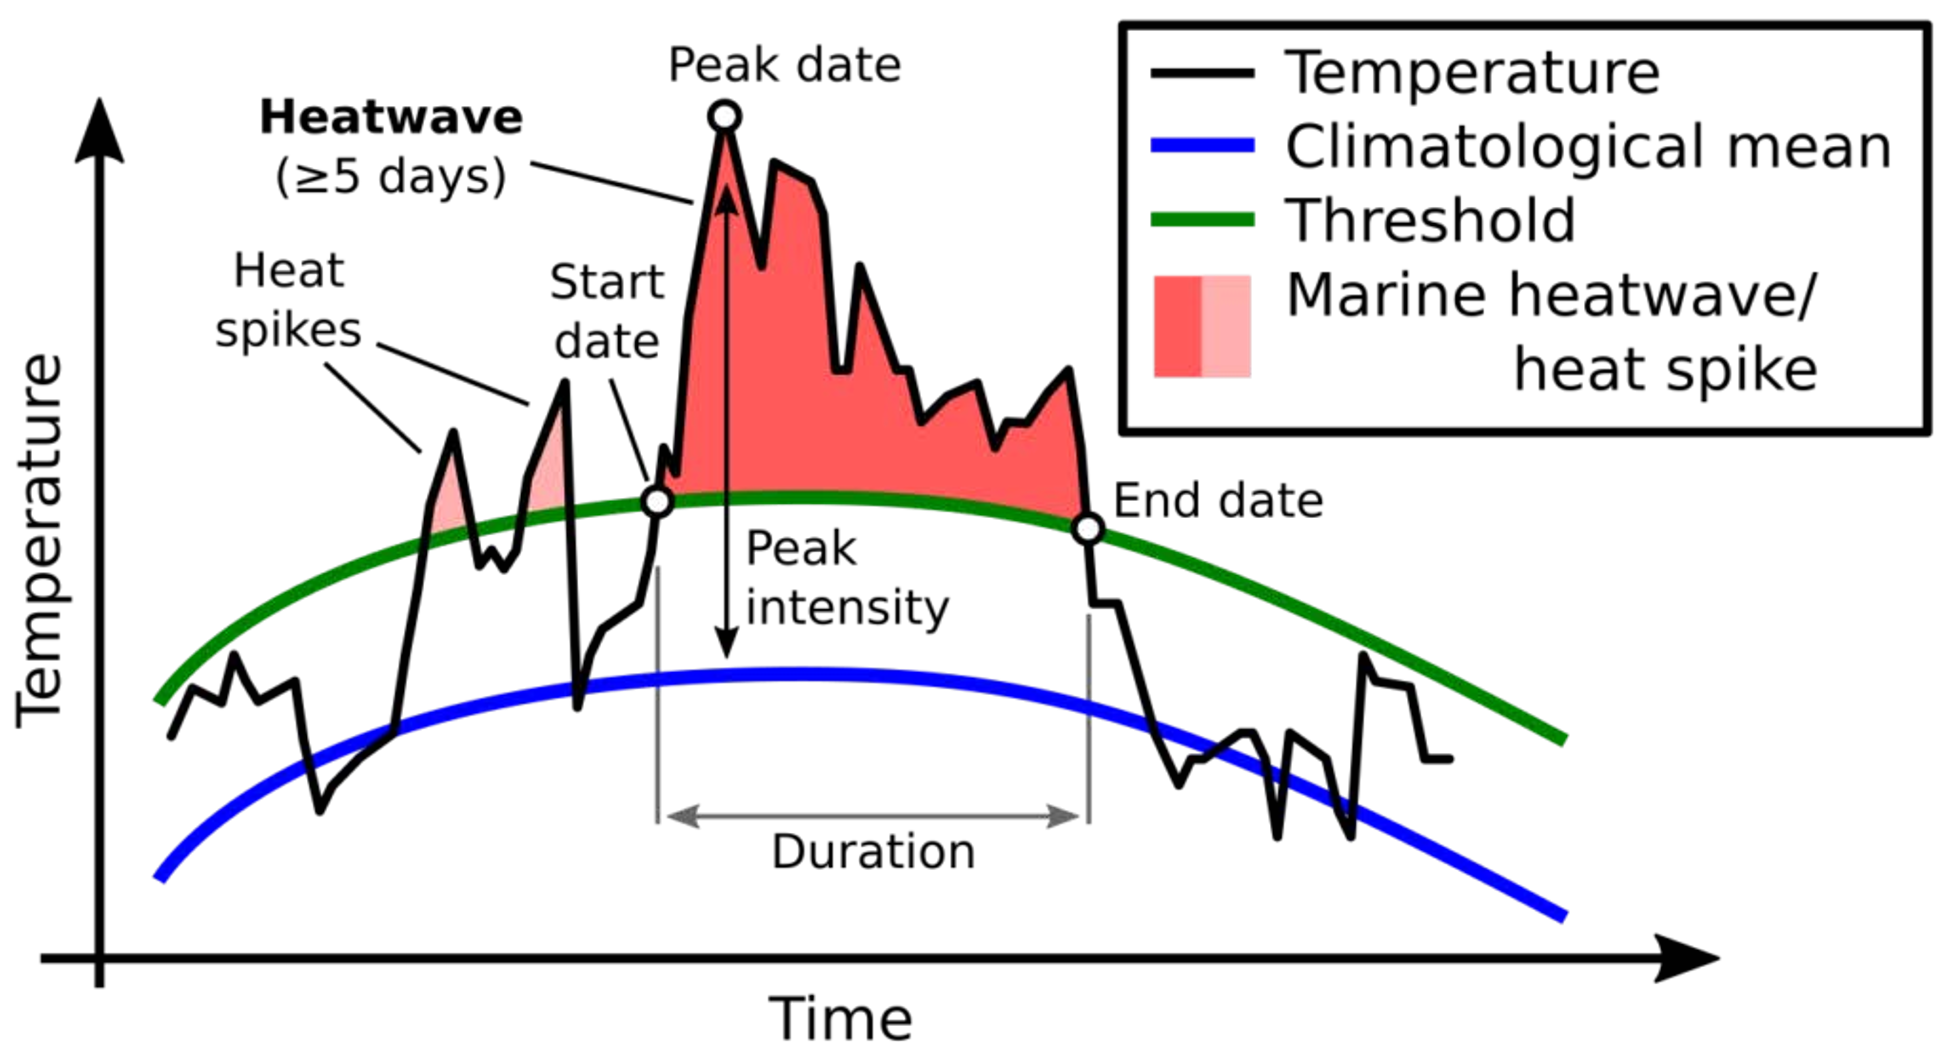
How do we define/measure heat waves?
When sea surface temperature (SST) rises above the 90th percentile for the climatology SST
for more than 5 days.
Heat Waves are increasing evidence / global impact
8/10 most extreme heat waves - since 2010
impacts fisheries
mass mortality of charismatic species
economic loss of billions
(thus marine heat waves have a bottom up effect starving higher trophic animals)
2013/4-2016 heat wave
The Great Pacific Blob - Northeas Pacific large heat wave
AR6 gives a ___
clear projection of increased extreme events with each benchmark increase in global average temperature.