APES Unit 3
1/127
There's no tags or description
Looks like no tags are added yet.
Name | Mastery | Learn | Test | Matching | Spaced | Call with Kai |
|---|
No analytics yet
Send a link to your students to track their progress
128 Terms
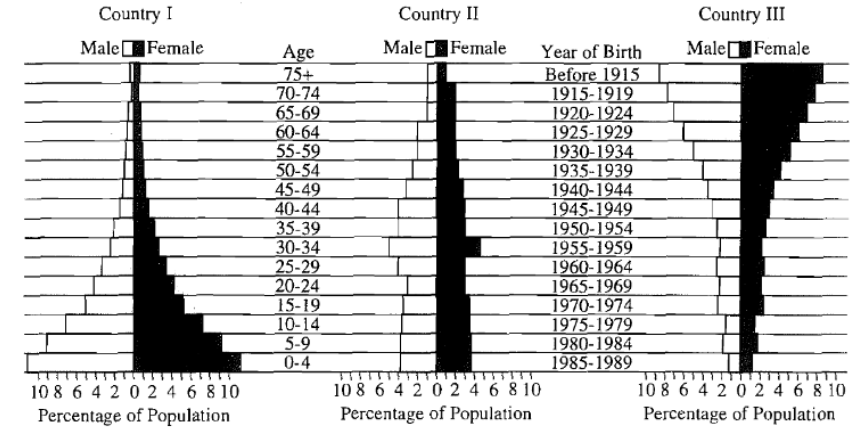
Directions: Select the choice that best fits each statement. The following question(s) refer to the histograms below, which show age structure expressed as percentage of population for Countries I, II, and II in 1990.
I only
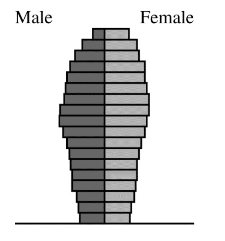
The diagram shows the age structure of a particular country. Which of the following characteristics is most closely associated with a country that demonstrates the age structure in the diagram shown above?
There is a low infant mortality rate.
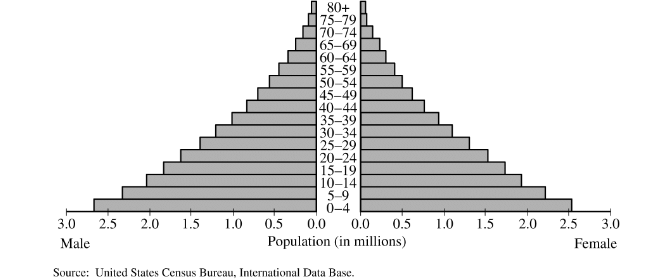
Which of the following age structure diagrams represents a population that most likely has a negative growth rate?
Which of the following countries is most likely represented in the age structure diagram shown above?
Country B
The total fertility rate in country A was 6.8 in 1980. Which of the following statements best supports the change in the total fertility rate in country A between 1980 and 2015?
The total fertility rate decreased as a result of a delay in age of first marriage and increased contraceptive use.

Directions: Select the choice that best fits each statement. The following question(s) refer to the figure below. A, B, C, and D represent population growth curves, E represents the carrying capacity. Represents the maximum number of individuals that can be supported by a particular ecosystem on a long-term basis…
C
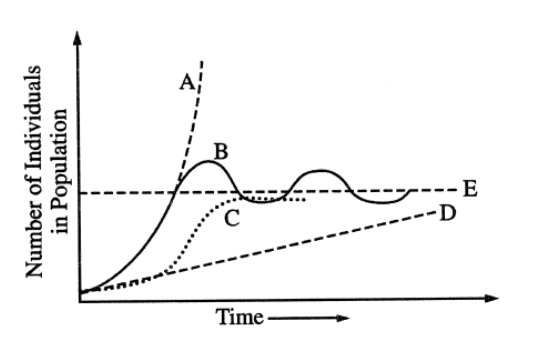
Directions: Select the choice that best fits each statement. The following question(s) refer to the figure below. A, B, C, and D represent population growth curves, E represents the carrying capacity. Represents the growth of a population predicted by the logistic model…?
C
Which of the following is a true statement about the total fertility of a society?
The total fertility of a society decreases as the society progresses through the demographic transition.
Which of the following is most typically associated with the transition from a rural to an urbanized society?
Reduced birth rates
If a country has a crude birth rate of 24 per 1,000 and a crude death rate of 8 per 1,000, the natural annual percent increase of its population is
1.6%
Members of an r-selected species characteristically
reach sexual maturity quickly
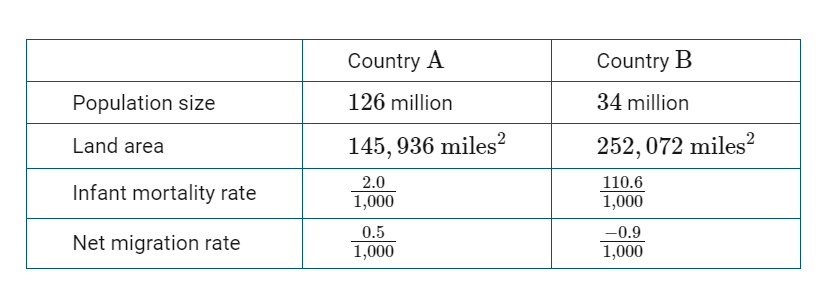
Which of the following characteristics in the table best supports the claim that Country A is a more developed country and that Country B is a less developed country?
Infant mortality rate
The crude growth rate, r , of a population is calculated by
subtracting the crude death rate from the crude birth rate

The graph below shows three different survivorship curves. Cycads are gymnosperms that were diverse and abundant during the Mesozoic era. Extant species of cycads share many traits with those from the Mesozoic era. Cycads bear cones, are long-lived with slow growth rates, show late reproductive maturity, and have very few offspring. Based on this description, the cycads are
K-strategists with a Type I survivorship curve.
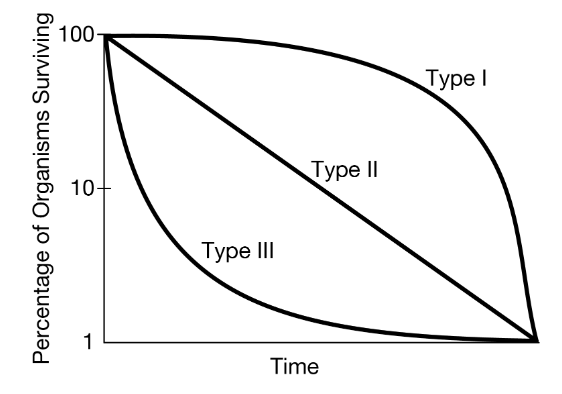
The graph shows three different survivorship curves. A certain species of dinosaur laid large numbers of eggs, and the hatchlings had high mortality early in life. But if they survived, the young dinosaurs were able to grow at a rapid pace and disperse into the environment in order to thrive. Based on this information and the graph above, which of the following best characterizes this species of dinosaur?
The dinosaurs were r-strategists and exhibited a Type III survivorship curve
A country has a birth rate of 351,000 individuals and a death rate of 131,000 individuals. The death rate was 371,000 individuals in 1950, 281,000 individuals in 1970, and 211,000 individuals in 1990. Which of the following statements best explains why the country has a declining death rate?
The country is in stage 2 of the demographic transition, and life expectancy has increased because of improvements in public health, sanitation, and access to food.
In a certain country, the birth rate is high, the death rate is high, and there are many children that are part of the workforce. The country is most likely in which of the following stages of the demographic transition?
Stage 1
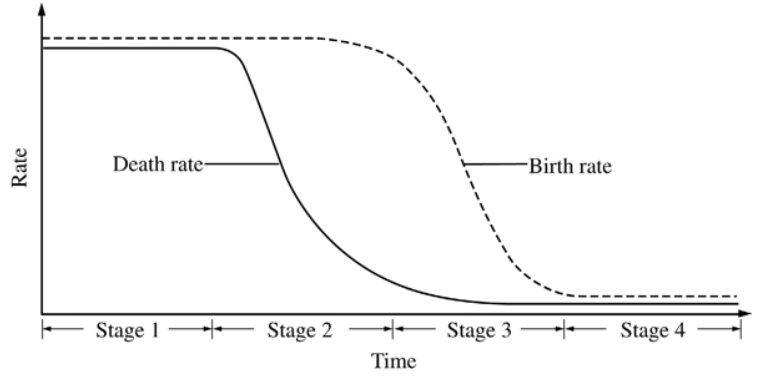
During which stage of the demographic transition shown above does a population begin to experience an explosive increase in growth?
Stage 2
In a human population undergoing the demographic transition, which of the following generally decreases first?
Death rate

Directions: Select the choice that best fits each statement. The following question(s) refer to the graph below, which shows different phases related to the birth and death rates for a typical human population over time. The rate of population growth starts to slow down at which point?
The beginning of phase III
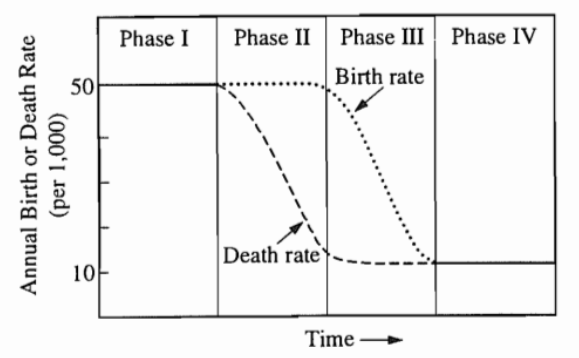
Directions: Select the choice that best fits each statement. The following question(s) refer to the graph below, which shows different phases related to the birth and death rates for a typical human population over time. Which of the following is most likely the primary cause of high death rates in phase I?
Infant and childhood mortality

Zero population growth is associated with
phases I and IV
The supply of Earth’s fresh water is fixed and is being depleted at a rapid rate. Which of the following best describes the effects of a limited freshwater supply on human populations?
World food production will decrease, leading to increased famine.
If the population of a country grows at a rate of approximately 5 percent per year, the number of years required for the population to double is closest to
15 years
If the population of a country is growing at a rate of 1.75 percent per year, the population will double in approximately how many years?
40 years
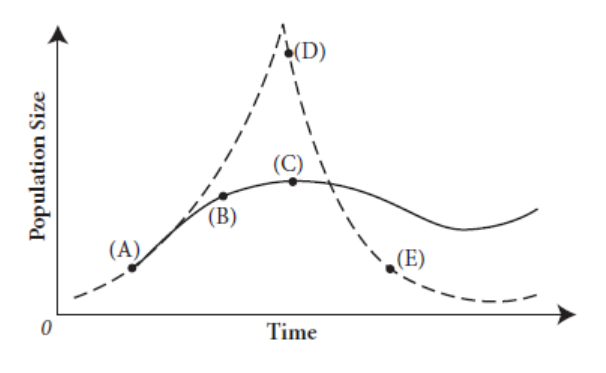
Directions: Select the choice that best fits each statement. The following questions(s) refer to the lettered points of the curves plotted on the graph below. The curves show two possible patterns of change in population size over time for a certain species of small mammal in an ecosystem. Population growing exponentially
A
Which of the following is a true statement about replacement-level fertility?
It is greater in countries with high infant-mortality rates than in countries with low infant-mortality rates.
Factors that affect the total fertility rate of a human population include which of the following?
Cultural traditions
Government policies and economic incentives
Education level and economic opportunities for females
I, II, and III
In a human population, the population momentum effect is most likely to occur in cases in which a large percent of people in the population are in which age-group?
Younger than eighteen years old
The increase in the size of Earth's human population in the last century has been dramatic. Which of the following identifies two major contributors to this increase?
The Industrial Revolution and modern medicine
Although the fertility rate for women in the United States has declined in recent years to a value below replacement level, the United States population is still increasing because of
immigration
Which of the following species is most likely to be an invasive species if introduced into a favorable new habitat?

The K-selection reproductive strategy maximizes survival of offspring by producing
few offspring with high levels of parental care
Which of the following is generally true of K-strategist species as compared to r-strategist species?
They have longer life spans.
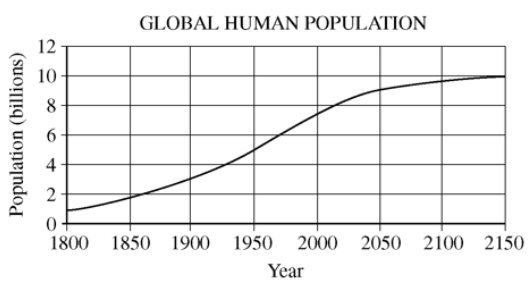
According to the graph above, the global human population will most likely
have doubled between 1950 and 2150

The world population growth rate in 2015 is about 1 percent. It is expected to drop to 0.5 percent by 2050, partly because of increased access to birth control in developing nations. Another likely cause for the expected decline is
increasing numbers of women entering the workforce in developing nations
Which of the following pairs of statistics would most likely indicate the highest quality of life in a country?
High life expectancy and low infant mortality
Which of the following best exemplifies population momentum?
Continued growth of a population after fertility drops to replacement level
If a city of population 10,000 experiences 100 births, 40 deaths, 10 immigrants, and 30 emigrants in the course of a year, what is its net annual percentage growth rate?
0.4%
Raccoons eat a variety of foods and can live in a variety of habitats, including locations near humans. Tiger salamanders eat an abundance of worms and insects and require wetland habitats so they do not dry out. Which of the following best identifies the two different species?
Raccoons are generalists, and salamanders are specialists.
By the year 2050, world population is expected to approach 10 billion. If the current population trends continue, which region of the world will most likely experience the majority of the growth?
Africa and Asia
A country currently has a population of 100 million and an annual growth rate of 3.5 percent. If the growth rate remains constant, what will be the population of this country in 40 years?
400 million
What type of selected species tend to be large, have few offspring per reproduction event, live in stable environments, expend significant energy for each offspring, mature after many years of extended youth and parental car, have long life spans/life expectancy, and reproduce more than once in their lifetime?
K-selected species
What is competition for resources in K-selected species’ habitats usually like?
relatively high
What type of selected species tends to be small, have many offspring, mature early, have short life spans, and may reproduce only once in their lifetime?
r-selected species
What is competition for resources in r-selected species’ habitats?
relatively low
What does biotic potential refer to?
The maximum reproductive rate of a population in ideal conditions.
True or False: some species have reproductive strategies that are not uniquely r-selected or K-selected, or they change in different conditions at different times.
True
What type of species are most invasive species classified as?
r-selected species
Why type of species are typically more adversely affected by invasive species?
K-selected species
What type of species are minimally affected by invasive species?
r-selected species
What does a survivorship curve display?
The relative survival rate of a group of individuals of the same age in a population from birth to the maximum age reached by any one cohort member.
What are the three types of survivorship curves?
Type I, Type II, Type III
What species typically follow a Type I or Type II curve?
K-selected species
What species typically follow a Type III curve?
r-selected species
What happens when a population exceeds its carrying capacity?
Overshoot occurs
What is an environmental impact of population overshoot?
Resource depletion
What is a major ecological effect of population overshoot?
A dieback of the population because the lack of available resources leads famine, disease, and/or conflict.
What environmental factors can population growth be limited by?
Available resources and space.
True or false: resource availability and the total resource base are limited and finite over all scales of time.
True
What causes population growth to accelerate?
The resources needed by a population for growth are abundant.
When the resource base of a population shrinks, the increased potential for unequal distribution of resources will ultimately result in what?
Increased mortality and/or decreased fecundity (fertility) resulting in population growth declining to or below carrying capacity.
What can population growth rates be interpreted from?
Age structure diagrams by the shape of the structure.
What will a rapidly growing popualtio have?
A higher proportion of younger people compared to stable or declining populations?
What does TFR stand for?
Total fertility rate
What is total fertility rate affected by?
The age at which females have their first child, educational opportunities for females, access to family planning, and government acts and policies.
What is the population considered if a fertility rate is at replacement levels?
Relatively stable
What factors affect infant mortality rates?
Whether mothers have access to good healthcare and nutrition.
What affects whether a human population is growing or declining?
Birth rates, infant mortality rates, overall death rates, access to family planning, access to good nutrition, and postponement of marriage.
What factors limit global human population?
Earth’s carrying capacity and the basic factors that limit human population growth as set forth by Malthusian theory.
What are the two types of factors that can affect population growth?
density-independent and density-dependent
What are some examples of density-independent factors?
major storms, fires, heat waves, and droughts
What are some examples density-dependent factors?
Clean water and air, food availability, disease transmission, and territory size.
What is the rule of 70?
dividing the number 70 by the percentage population growth rate approximates the population’s doubling time.
What does the demographic transition refer to?
transition from higher to lower birth and death rates in a country or region as development occurs and that country moves from a pre-industriall to an industrialized economic system.
How is demographic transition modeled?
through a four-stage demographic transition model (DTM).
What are characteristics of developing countries?
Higher infant mortality rates and more children in the workforce than developed countries.

What is the term used for populations leaving an area?
emigration

What is the term for populations moving into an area?
immigration

What are two factors that can cause an increase in population size?
Increase in births and decrease in deaths.
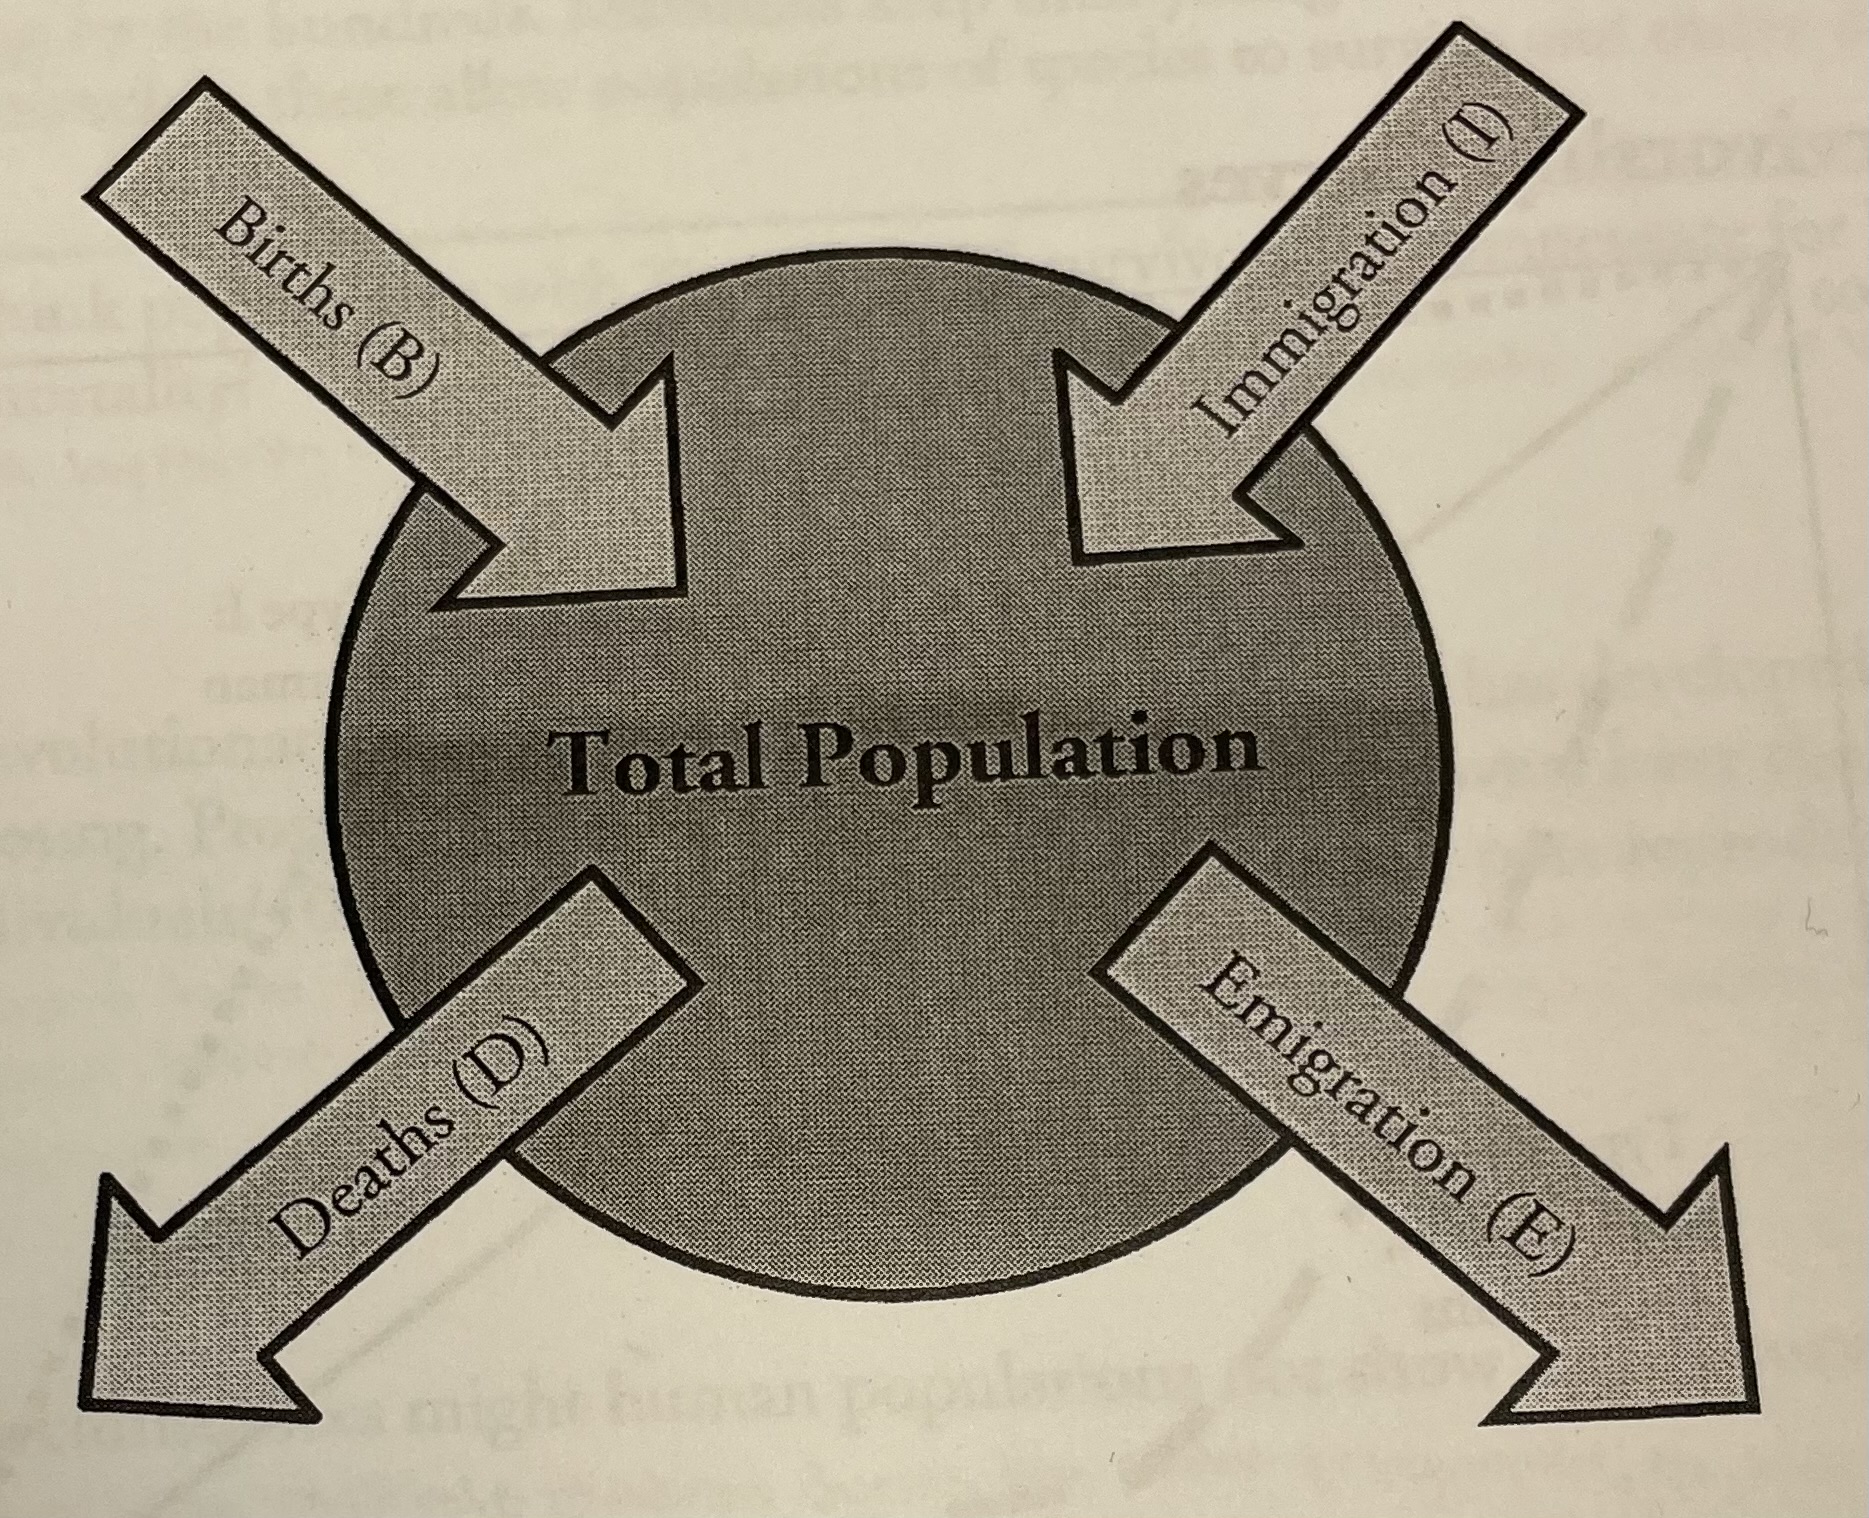
What are two factors that can cause a decrease in population size?
Decrease in births and increase in deaths.
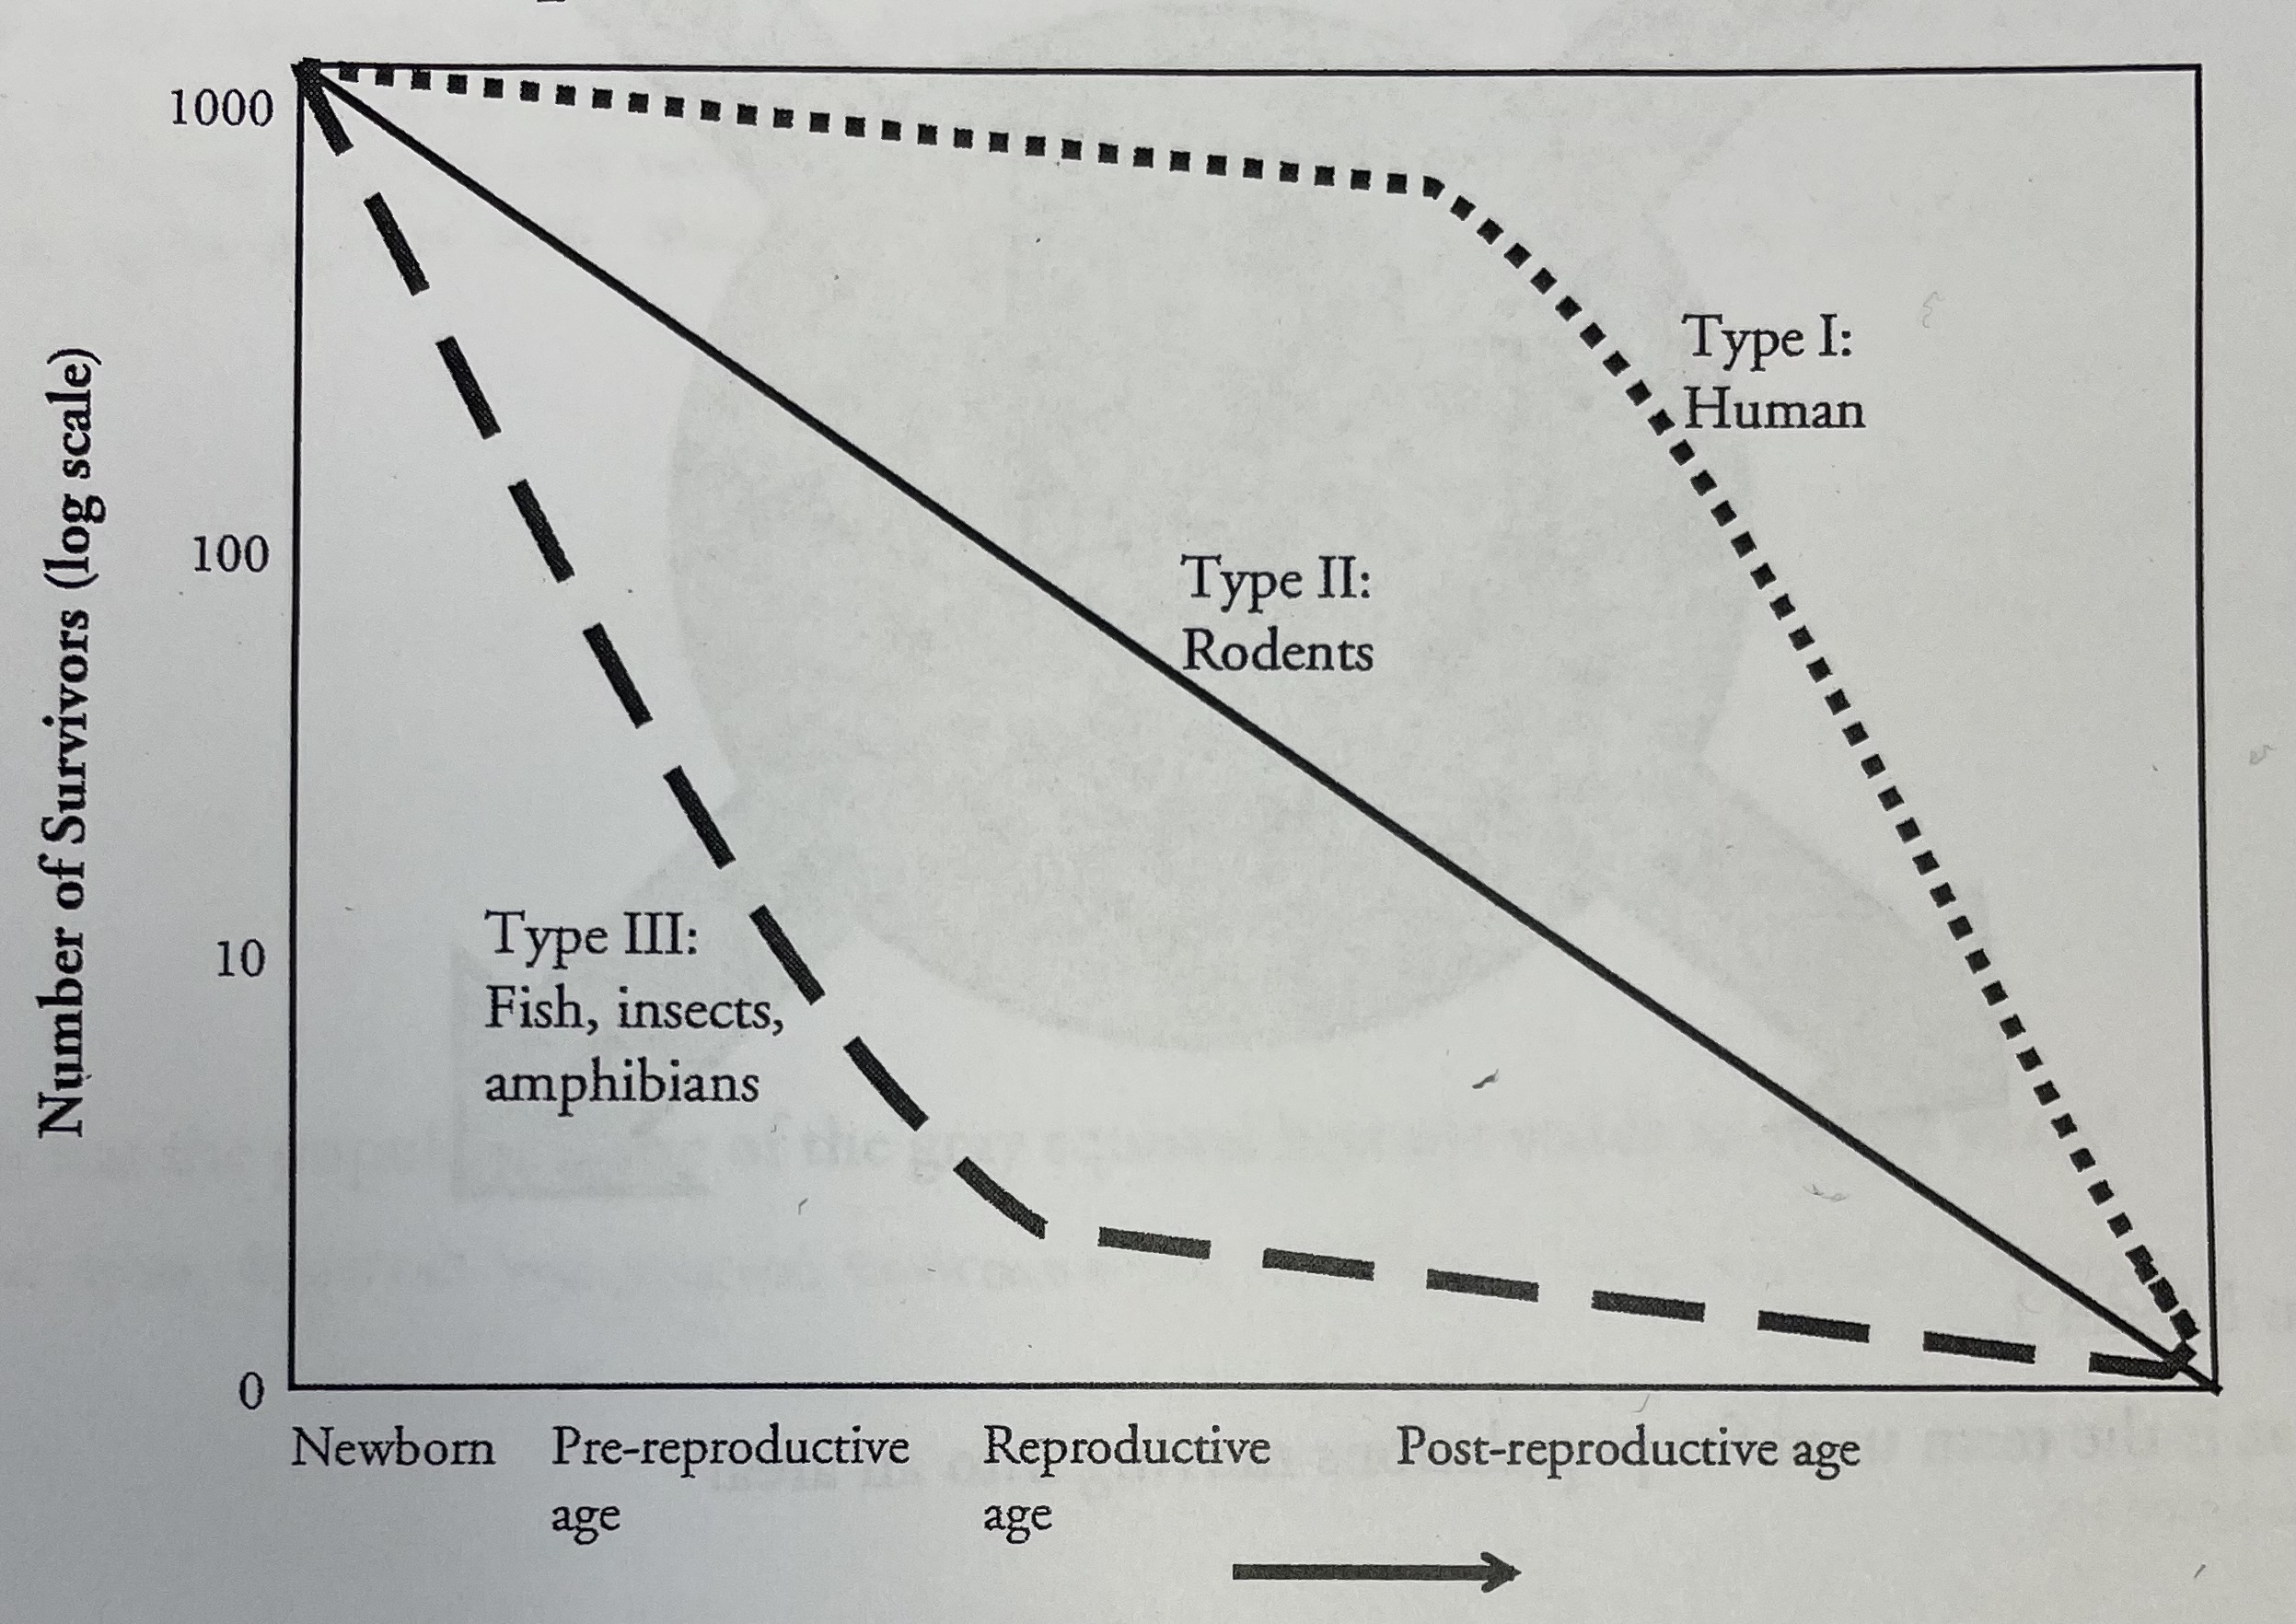
What type of organism shows a steady decline in its population at all life stages?
Type II: Rodents

Which type of organism loses most of the individuals in its population at an early life stage?
Type III: Fish, insects, amphibians

What survivor type are humans?
Type I

Which of the three types have the highest number of individuals that reach reproductive stage?
Type I: Human

How do you think populations with Type II or III survivorship compensate for high pre-productive mortality?
lay/birth an excessive amount of eggs to anticipate most of them will die early.

Under what circumstances might human populations not show Type I survivorship?
When mothers birth multiple children during the same pregnancy.

During what phase of the growth curves in each diagram is the population just beginning to colonize an area?
Lag phase
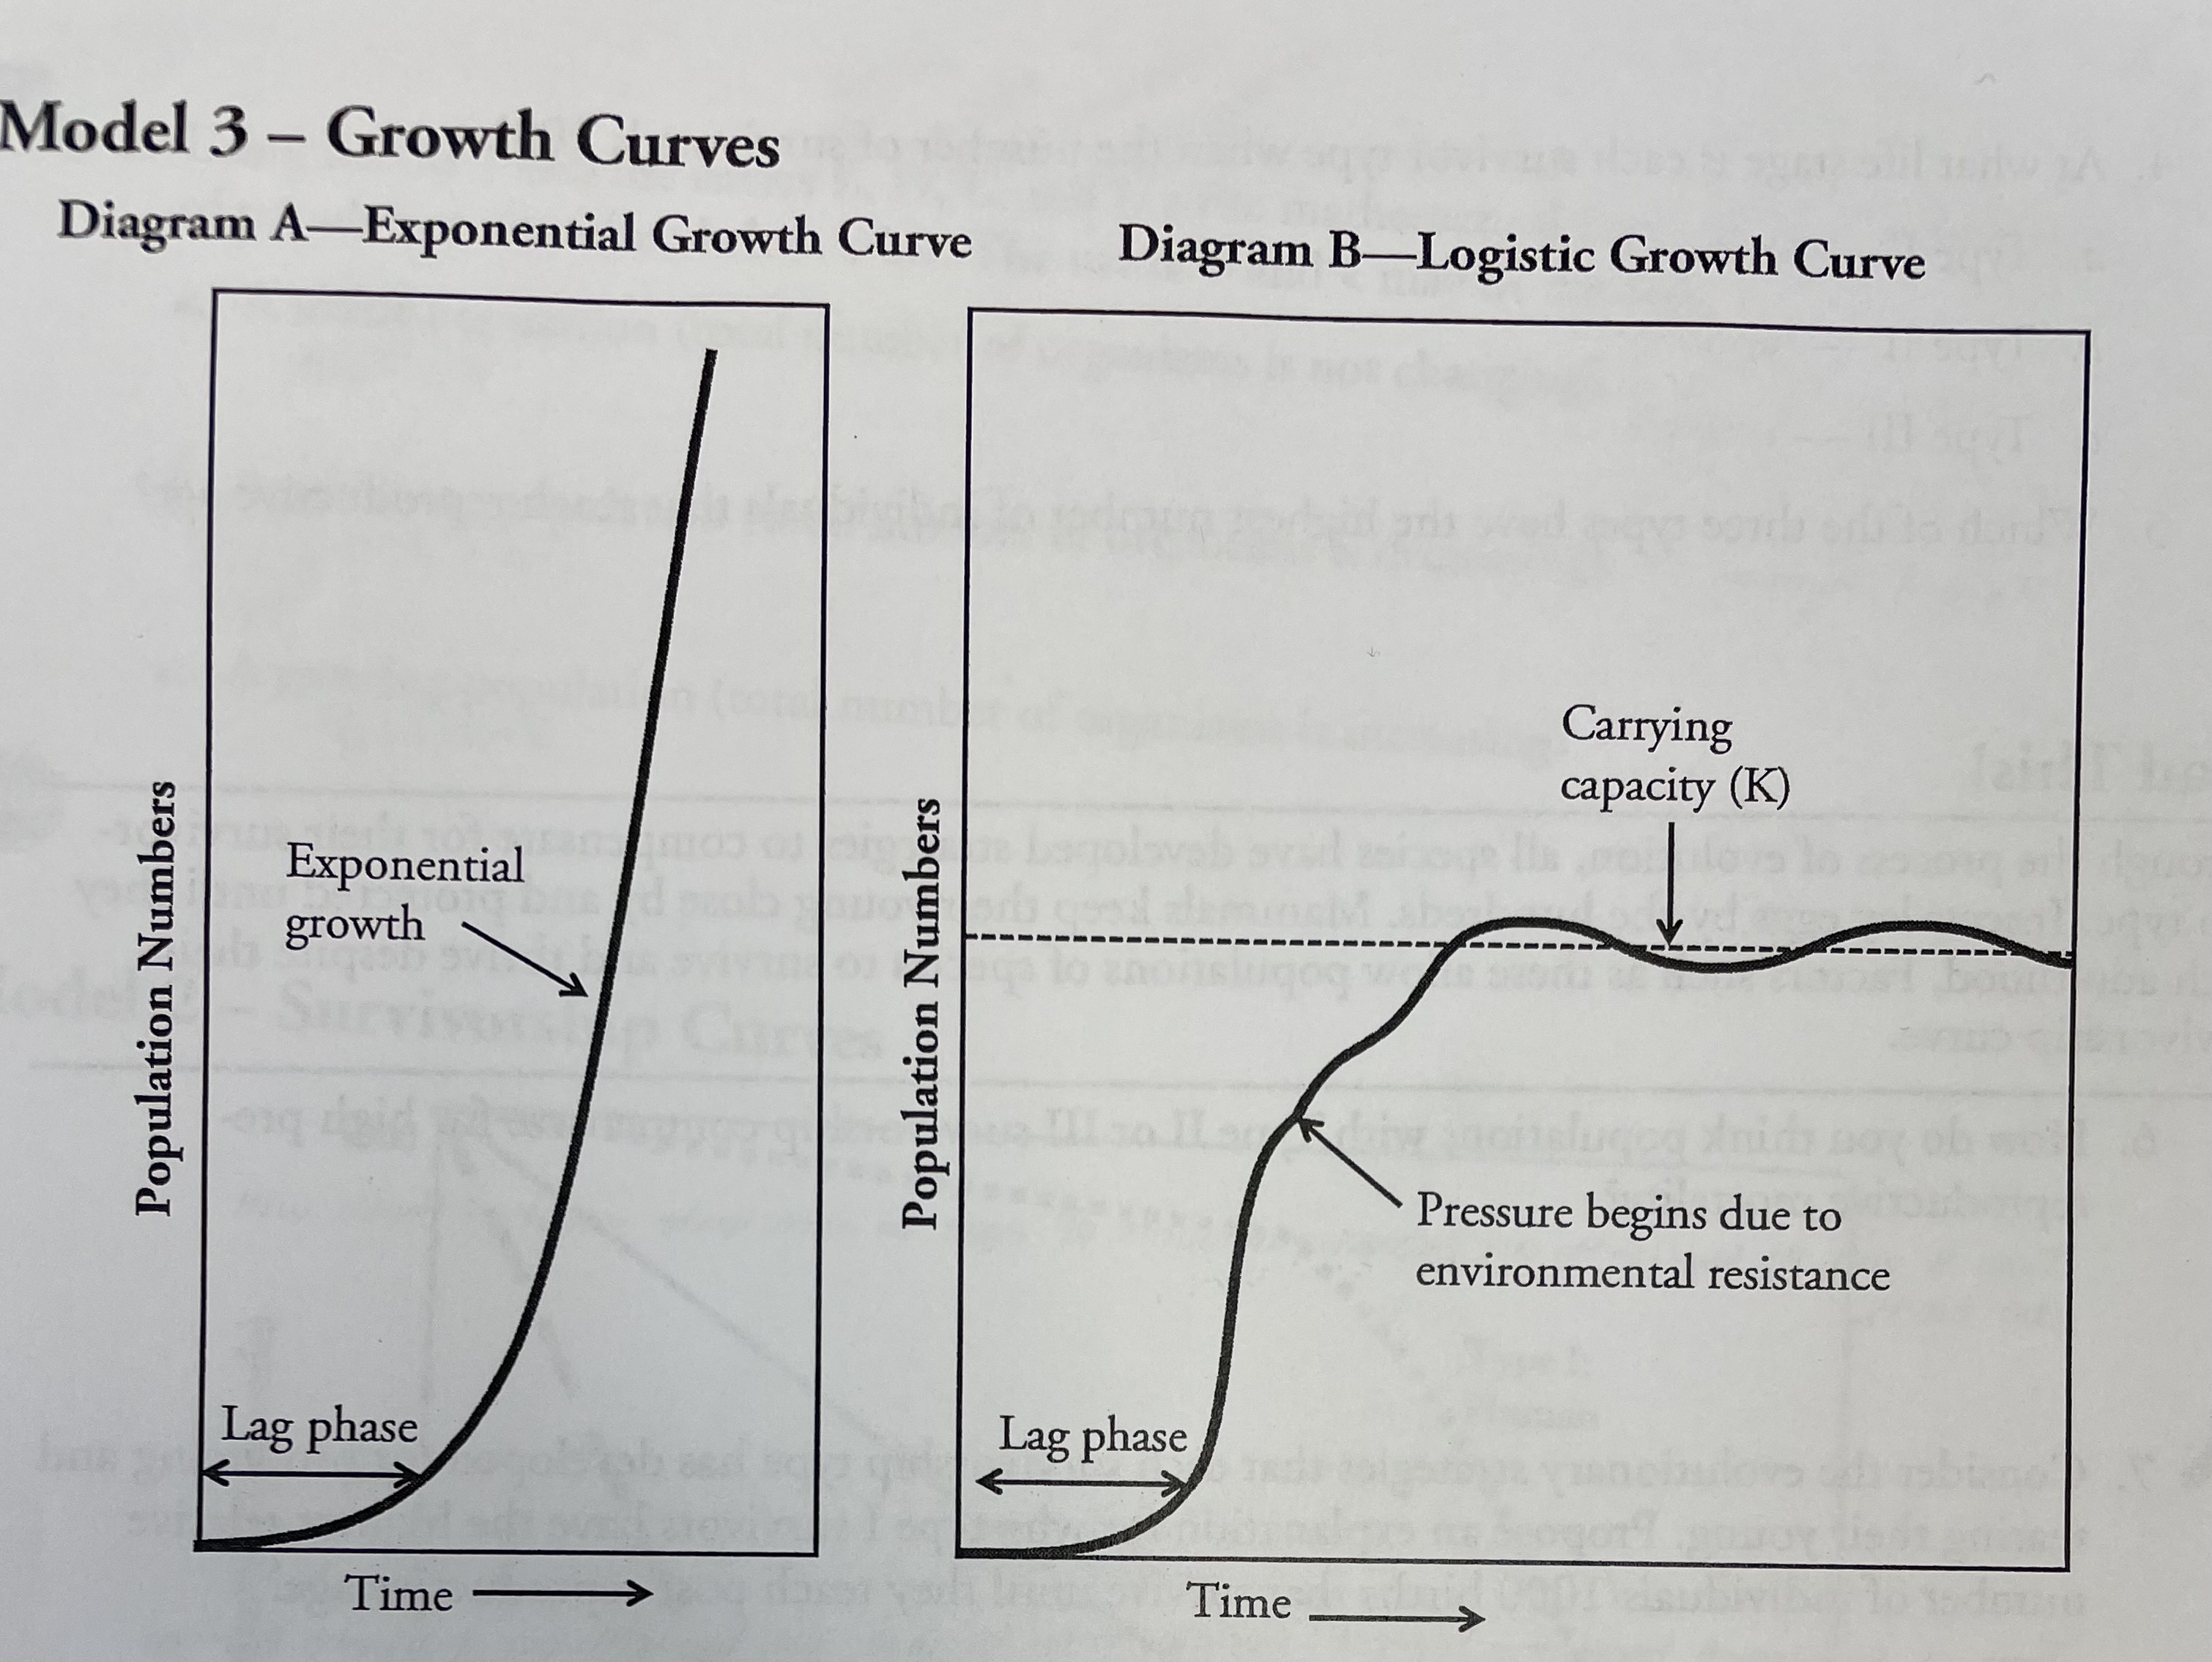
Which type of population growth appears to continue unchecked (unstopped)?
Diagram A- Exponential Growth curve

What is a logistic curve sometimes refrred to as?
An S-curve

What is an exponential growth curve sometimes referred to as?
A J-curve

What causes the population to slow down during logistic growth?
Carry capacity which is dependent on available resources and habitat requirements.
What causes growth rate to slow down until carrying capacity is reached?
environmental resistance
What are some examples of environmental resistance?
resources, environment changes, habitual requirements
What causes a population size to fluctuate around carrying capacity?
Increase in resources, decrease in predators or competition
Define density-dependent
the size of the population will influence an individual’s probability of survival.
Define density-independent
the size of the population has no effect on the individual’s probability of survival.
Define logistic growth.
when a population whose growth is initially exponential, but slows as the population approaches the carrying capacity.
Define K-selected species
the population of a species that grows slowly until it reaches the carrying capacity.
Define r-selected species.
the population of a species that grows quickly and is often followed by overshoots and die-offs.