The Carbon Cycle and Keelings curve
1/18
There's no tags or description
Looks like no tags are added yet.
Name | Mastery | Learn | Test | Matching | Spaced | Call with Kai |
|---|
No study sessions yet.
19 Terms
what form does carbon move in mostly
CO2
what are the two main processes it moves
photosynthesis and respiration
photosynthesis > respiration
the ecosystem is a carbon sink
photosynthesis < respiration
the ecosystem is a carbon source
carbon cycle diagram
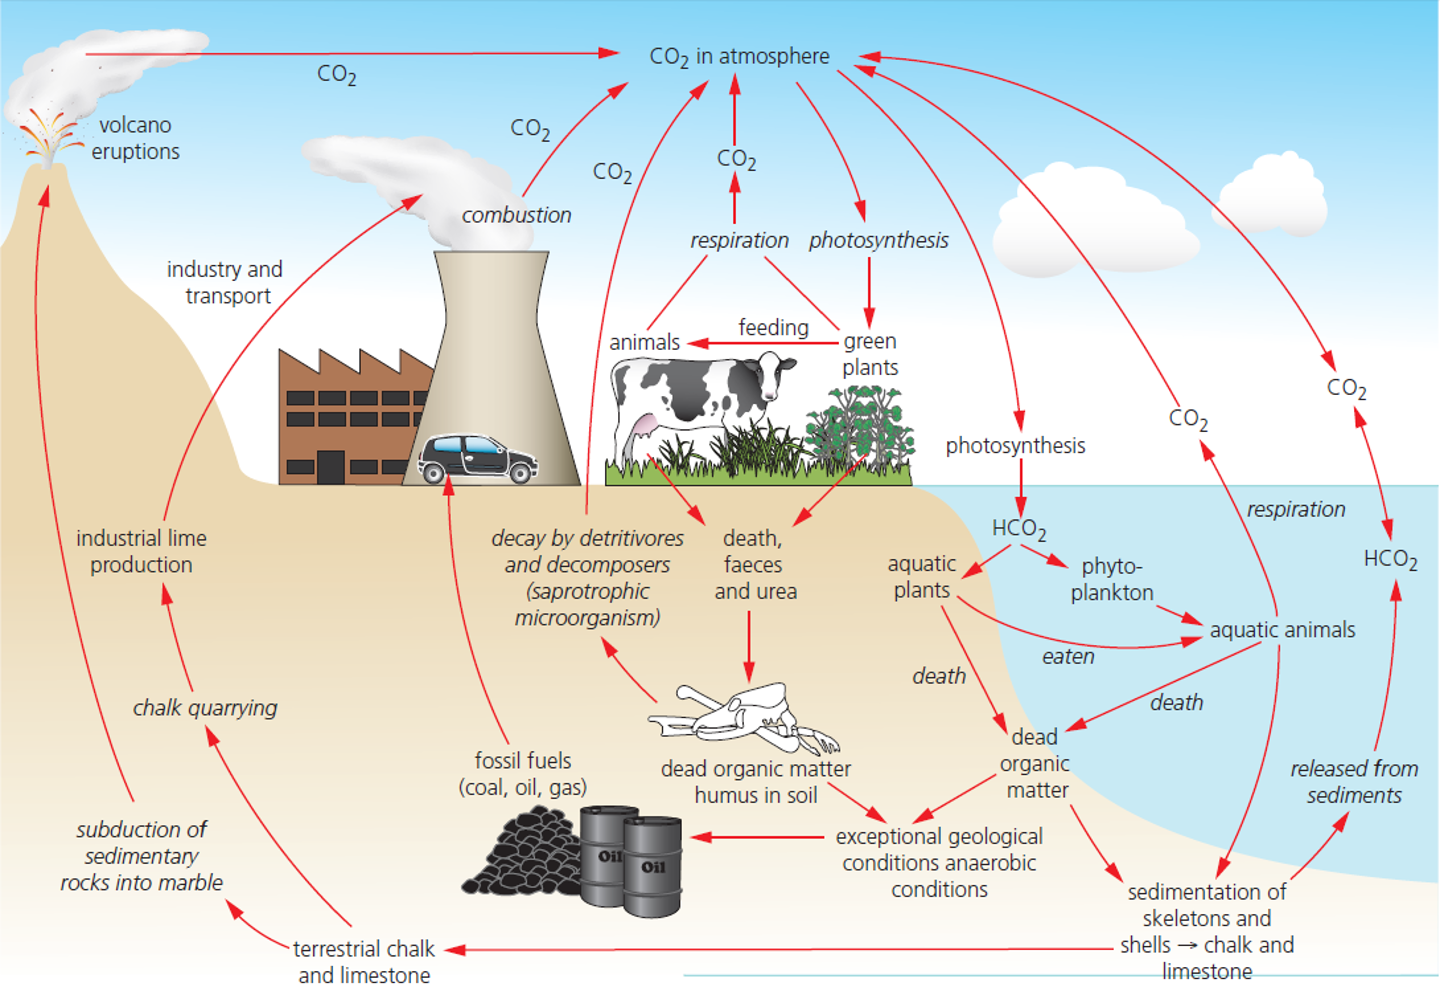
what are the 4 reservoirs where carbon storages are found
biosphere
hydrosphere
atmosphere
sediment
how does carbon move through these four pools
a variety of biological, geochemical or industrial processes called fluxes
what is a pool (carbon)
a reservoir of carbon, it can be organic or inorganic
what forms large carbon sinks
biomass, peat, coal, oil and natrual gas
how is carbon dioxide and water released
when these carbon sinks are burn as a fuel
how do they burn as a fuel
complete combustion
combustion general formula
Fuel + O2 → CO2 + H2O
what is formed over a long period of time
oil and gas
what is the original source of oil and gas
dead marine organisms containing calcium carbonate
what happens when they are buried under the sediment
sediment layer heat and compression acts on transforming them into oil and gas
how are they stored away
pockets of rocks or sand
how is peat formed
when plant matter does not fully decompose due to waterlogged, acidic conditions
why is the concentration of carbon in the atmosphere always changing
seasonal fluctiations
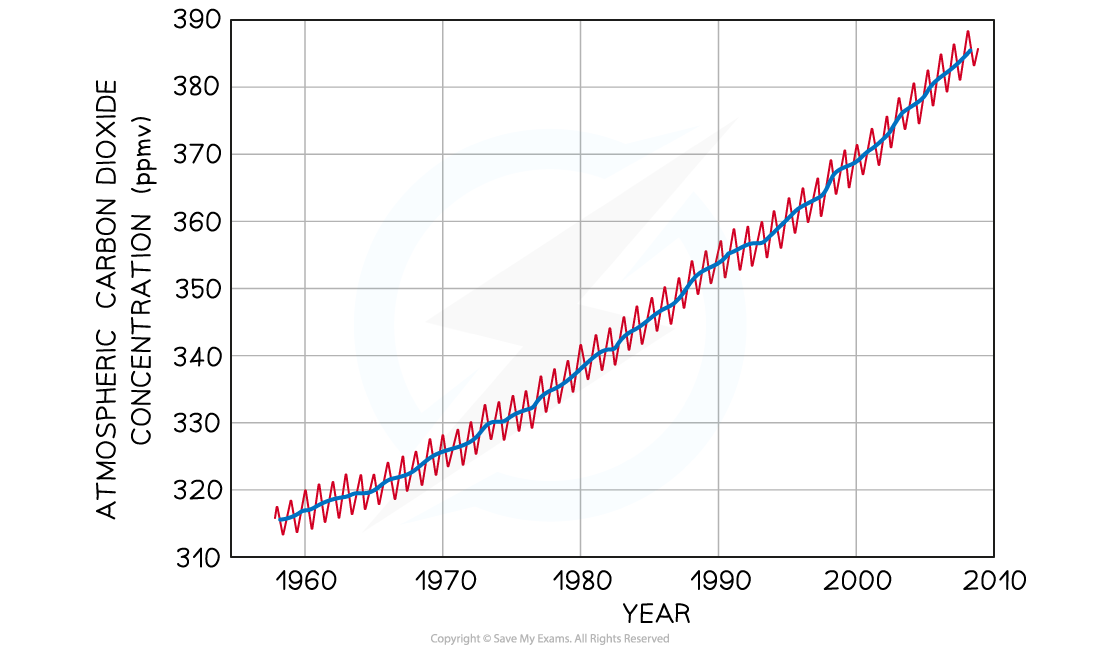
Keelings Curve
shows changes in atmospheric carbon dioxide levels measured at the Mauna Loa Observatory (ppmv = parts per million by volume)
yearly fluctuations shown in red are due to seasonal changes in photosynthesis rates, while the overall trend shown in blue is due to human combustion of fossil fuels