Mapping the Environment Final
1/77
There's no tags or description
Looks like no tags are added yet.
Name | Mastery | Learn | Test | Matching | Spaced |
|---|
No study sessions yet.
78 Terms
remote sensing
The process of collecting information related to the electromagnetic energy reflected or emitted by a target on the ground, using a device on board an aircraft or a spacecraft a considerable distance away from the target
History of remote sensing
balloons, kites, WWI and WWII, and the Cold War
Two types of aerial photography
Vertical and Oblique
Vertical aerial photography
Photos taken perpendicular to the ground. Images taken straight above the subject.
Oblique aerial photography
camera angle is less than 90 degrees- features are seen from a more or less familiar point of view
aerial photography color types
Panchromatic, Color and CIR
Panchromatic imagery
black-and-white imagery formed by viewing the entire visible portion of the electromagnetic spectrum
Color imagery
an image formed by placing a band of imagery into each of three color guns (red, green, and blue) to view that image in color rather than grayscale
CIR Photo - Color Infrared Photo
Color-Infrared Photo; a photo in which infrared reflection is shown in shades of red, red reflection is shown in shades of green, and green reflection is shown in shades of blue
Nadir
The location on the ground that lies directly below the camera in aerial photography
NAIP
principal point
the center point of an aerial photo
Relief Displacement
the effect in aerial imagery in which tall items appear to "lean" outward from the photo's center toward the edges
Orthophoto
an aerial photo with uniform scale
True Orthophoto
an orthophoto where all objects look as if they're being seen from directly above
Interpretation
analyzing, understanding, and extracting meaning from spatial data and maps
Pattern
the arrangement of objects in an image, used as an element of image interpretation
Site and Association
information referring to the location of objects and their related attributes in an image, used as elements of image interpretation
Size
the physical dimensions (length, width, and area on the ground) of objects, used as an element of image interpretation
Shadow
a dark shape in an image caused by a light source shining on an object, used as an element of image interpretation
Shape
the distinctive form of an object, used as an element of image interpretation
Texture
repeated shadings or colors in an image, used as an element of image interpretation
Tone
the grayscale levels (from black to white) or range of intensity of a particular color discerned as a characteristic of particular features present in an image, used as an element of image interpretation
Photogrammetry
the process of making measurements using aerial photos
Electromagnetic Energy
a form of energy that travels through space in the form of waves
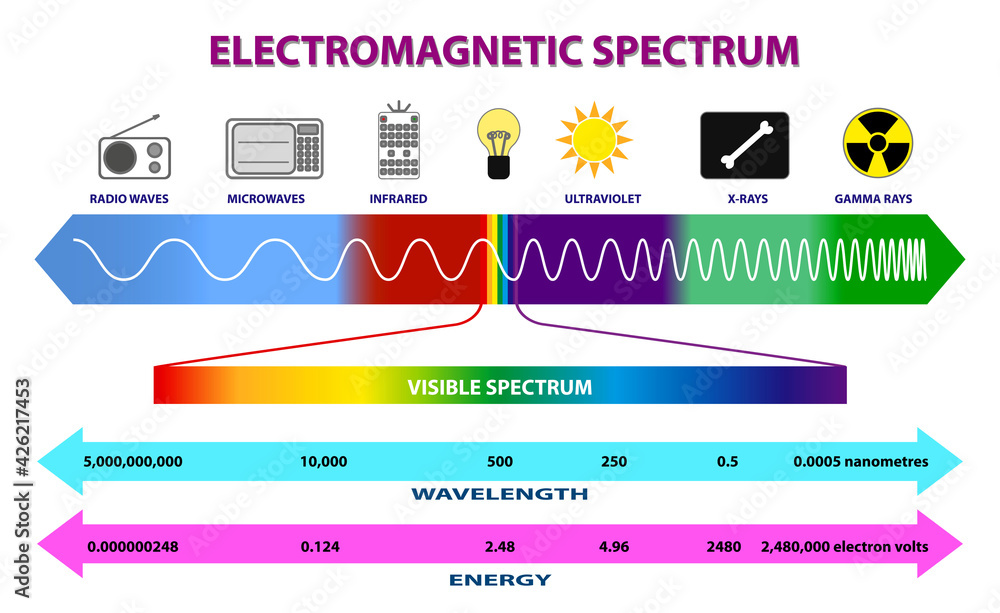
electromagnetic spectrum
the full range of energy waves that remote sensing tools detect and use in GIS
(shorter wavelength and more energy) Gamma, X-ray, UV, visible light, Infrared, microwaves, radiowaves (higher wavelength and less energy)
wavelength
the distance between the crests of two waves
spectrum (UV, visible, IR {NIR, MIR, TIR})
Different light wavelengths used
Atmospheric window
wavelengths of electromagnetic energy in which most of the energy passes through Earth's atmosphere
Types of scattering
Rayleigh, Mie, Non-selective
Rayleigh scattering
scattering of light caused by atmospheric particles smaller than the wavelength being scattered (gas)
Mie Scattering
scattering of light caused by atmospheric particles (dust, smoke)
Non-selective scattering
scattering of light caused by atmospheric particles larger than the wavelength being scattered (water vapor)
Incident Energy
the total amount of energy that hits Earth
Incident Energy types
Transmission, Absorption, Reflectance
Transmission
the process by which light passes through a target
Absorption
the process by which light is trapped and held by a target
Reflectance
ρ = (R/I) * 100, the percentage of light reflected off a surface
spectral reflectance
the percentage of the total incident energy that was reflected from that surface
NDVI (normalized difference vegetation index)
A method of measuring the health of vegetation using near-infrared and red energy measurements
Display
Spatial Resolution and Brightness Value
Spatial Resolution
the size of the area on the ground represented by one pixel's worth of energy measurement
Brightness Value (digital number)
the energy measured at a single pixel according to a predetermined scale; abbreviated DN and also referred to as brightness value, or BV
Panchromatic
black-and-white imagery formed by viewing the entire visible portion of the electromagnetic spectrum
Multispectral
remotely sensed imagery created from the bands collected by a sensor capable of sensing several bands of energy at once
Hyperspectral
remotely sensed imagery created from the bands collected by a sensor capable of sensing hundreds of bands of energy at once
Color Guns
name used for equipment used to display color pixels on a screen in the colors red, green, and blue
Color Composite Types
True Color, False Color, Standard False Color
true color composite
an image arranged by placing the red band in the red color gun, the green band in the green color gun, and the blue band in the blue color gun
False Color Composite
an image arranged when the distribution of bands differs from placing the red band in the red color gun, the green band in the green color gun, and the blue band in the blue color gun
Standard False Color
an image arranged by placing the near-infrared band in the red color gun, the red band in the green color gun, and the green band in the blue color gun
Supervised Classification
an image classification method in which the computer assigns pixels to groups based on information provided in training sites
Unsupervised Classification
an image classification method in which the computer creates groups of similar pixels and then the user must identify what each cluster represents
Z-value
the numerical value representing the elevation or height of an object assigned to an x/y coordinate
Vertical Datum
a reference surface used to measure elevations or depths
contour interval
the vertical difference between two adjacent contour lines drawn on a map
Topographic Map
a printed map created by the USGS that shows landscape and terrain as well as the location of features on the land
7.5 minute quadrangle map
7.5-minute quadrangle map is a very detailed map that covers a small area of land, showing features like hills, rivers, roads, and towns. It’s called "7.5-minute" because it maps an area that's 7.5 minutes of latitude and 7.5 minutes of longitude.
DRG
Digital Raster Graphic; a scanned version of a USGS topographic map
DLG
Digital Line Graph; the features (such as contours, roads, rivers, or boundaries) are digitized as vectors (lines) from USGS maps
US Topo
a digital topographic map series created by the USGS to allow multiple layers of data to be used on a map in GeoPDF file format
DTM
Digital Terrain Model; a digital (computerized) 3D representation of the Earth's bare ground surface, with everything like trees, buildings, and vegetation removed. It shows the natural shape of the land — just hills, valleys, slopes, etc.
TIN
Triangulated Irregular Network; a 3D surface model made of connected triangles that represents the shape of the land (terrain) using points with known elevation.
DEM
Digital Elevation Model; a representation of the terrain surface, created by measuring a set of equally spaced elevation values
DSM
Digital Surface Model; a measurement of the heights of ground elevations as well as the objects on top of the ground, as captured by lidar
Lidar
a process in which a series of laser beams fired at the ground from an aircraft is used both to create highly accurate elevation models and also to measure the elevation of objects from the ground
Point Cloud
the name given to the massive number of elevation data measurements collected by lidar
LAS File
the industry standard data format used for lidar data
Bathymetric Lidar
a lidar process that uses a green laser beam for measuring underwater terrain heights
Slope
Hillshade (Azimuth, Altitude)
a shaded relief map of the terrain created by modeling the position of the Sun in the sky relative to the landscape
perspective View
the oblique angle view of a digital terrain model from which the model takes on a three-dimensional appearance
Draping
a process in which an image is given z-values to match the heights in a digital terrain model (draping a 2D image over a 3D one)
Base Heights
a z-value of a digital terrain model that can then be applied to an image in the process of draping
Z-Scale
The ratio between the vertical scale and the horizontal scale in a perspective view. Also called the vertical exaggeration factor.
Cloud
a technology wherein data, resources, or applications are kept in a remote location and made available to users over the internet
Webmap
an interactive online representation of geospatial data, which can be accessed via a web browser
Basemap
an image layer that serves as a backdrop for the other layers that are available on a web map
Mashup
the combination of two or more map layers that result in a combination