Working Scientifically Model Answers - Physics
1/33
There's no tags or description
Looks like no tags are added yet.
Name | Mastery | Learn | Test | Matching | Spaced | Call with Kai |
|---|
No analytics yet
Send a link to your students to track their progress
34 Terms
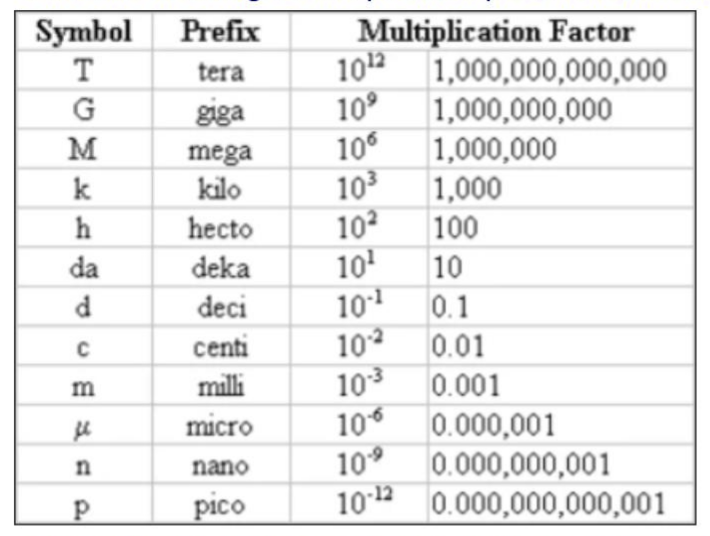
Prefixes
Tera T (10^12) Giga G (10^9) Mega M (10^6) Kilo k (10^3)
Milli m (10^-3) Micro µ (10^-6) Nano n (10^-9) Pico p (10^-12)
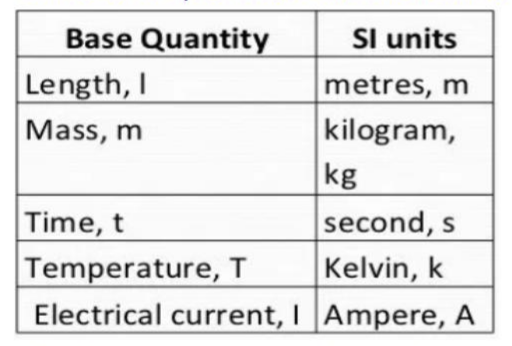
SI units
meter, kilogram, second, ampere, mole, kelvin, candela
Define accurate
How close a measured value is to the true value.
Define precise
How close repeated measurements are to one another.
Define resolution
The smallest measuring interval on a measuring instrument.
Define valid
A measurement is valid if it measures what it is supoposed to be measuring.
Define repeatable
If measurements are repeated by the same person in the same laboratory, with the same equipment and the repeated results are close to each other.
Define reproducible
If measurements are repeated by a different person or using different techniques and the results are close to each other.
Define true value
The value that would have been obtained in an ideal measurement.
Define uncertainty
The interval within which the true value can be considered to lie, with a given level of confidence.
Define error
The difference between the measurement result and the true value (not a mistake in measurement).
A student comments that the measurement of 2.40V is more precise than the measurement of 2.4V. Explain why they are incorrect.
a) Precision is a measure of closeness of repeated measurements. b) Both 2.40V and 2.4V are single measurements, so we cannot comment on their 'precision'. c) The results 2.40V has been measured using a higher resolution multimeter. d) So 2.40V has a lower absolute uncertainty (= resolution/2 = 0.005V), compared to 2.4V (absolute uncertainty = 0.1/2 = 0.05V).
Explain why doing repeat measurements increases the likelihood of an accurate measurement.
Repeating measurements reduces the effect of random error.
Describe how data with a systematic error would affect the appearance of a line of best fit on a graph.
It would adjust the value of the y or x intercept as every data point has the same error.
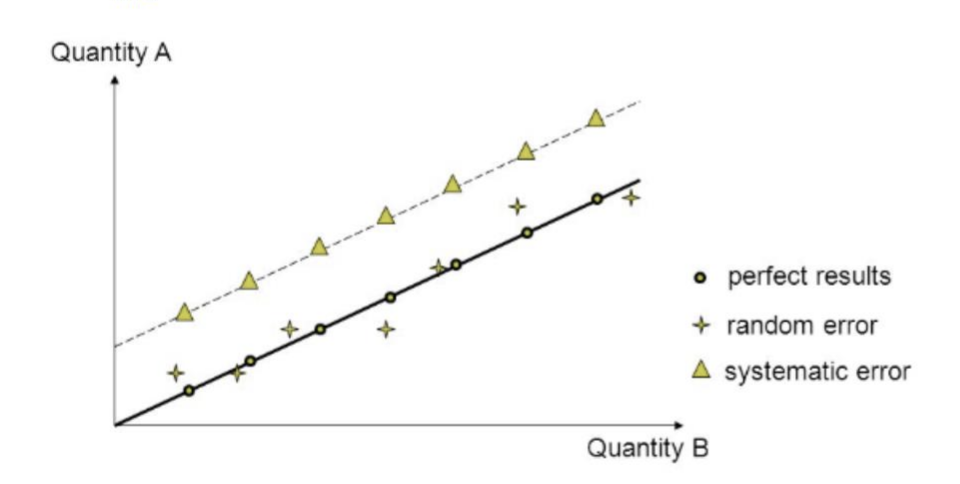
Describe how data with random error would affect the appearance of a line of best fit on a graph.
It would increase the spread of data around the line of best fit - both above and below the line.
Describe how to calculate the absolute uncertainty in a single reading.
Absolute uncertainty in a single reading = resolution/2
Describe how to calculate the absolute uncertainty in a set of repeated data (e.g. in the diameter measurements of 66mm, 65mm and 63mm).
Exclude anomalies. Then calculate range. Absolute uncertainty. = range/2
State the formula for calculating percentage uncertainty.
Repeat measurement: % uncertainty = absolute uncertainty / mean value (x 100).
Single measurement: % uncertainty = absolute uncertainty / measurement (x 100)
Explain the experimental choices we should make, to increase the likelihood of us getting an accurate result.
• We should aim to reduce the % uncertainty in the measurements. • To do this, we chould choose equipment with a high resolution. This will have a low absolute uncertaity, resulting in a low % uncertainty. • Or, where possible, we should increase the measurement we are taking. FOr the same absolute uncertainty, this will reduce the % uncertainty (as % uncertainty = absolute uncertainty/ measurement x100).
To determine the acceleration due to gravity, a student drops a ball from an upstairs window, instead of a lower one. Explain why this is more likely to produce an accurate result.
• The time taken for the ball to fall increase • Reducing the % uncertainty in the measurement of time
Show how to calculate the absolute uncertainty in a measurement when given its % uncertainty.
Absolute uncertainty = (% uncertainty / 100) x mean value or measurement.
State the range of values, a measured value can taken, when given its % uncertainty (e.g. if resisitance = 4.0Ω +/- 2%, what is the range of resistance?).
• Calculate the absolute uncertainty first: (2/100) x 4 = 0.08Ω • So resistance = 4.0 +/- 0.08Ω • Or minimum resistance = 3.92Ω and maximum resistance = 4.08Ω
23a. State the equation for % difference and explain what it can tell us about a measurement.
• % difference = (measured value - true value) / true value (x100) • This is a measure of the accuracy of the experiment as it is quantifying the difference between the true value and the measurement.
Describe examples of things that may have caused a result to be inaccurate.
• Parallax error introduces random error (if the viewer is looking at the scales from different angles each time) or systematic error (if the viewer is looking at the the svale from a consistently wrong angle). • Zero error may have introduced systematic error.
Describe what is meant by zero error and explain how to correct for it.
• Zero error is a systematic error that occurs when a measuring instrument does not display exactly zero when no object is being measured. • To correct for it, you should subtract or add the zero error.
Explain why a digital thermometer is a better choice of a device, than an in-glass thermometer to measure temperature.
• A digital thermometer will have a higher resolution, leading to a measurement with a lower absolute uncertainty and theresfore a lower % uncertainty. • A digital thermometer also avoids parallax error.
Describe 5 things to identigy when criticising a table of results.
• All data in a column should be to the same number of decimal places as the resolution of an instrument. • All data that has been calculated from raw data should be to the same number of significant figures as the raw data. • Repeats should be evident (clear). • The range of the independent variable should be high. • At least 6 sets of results should be taken (note - 6 minimum, more values will achieve a result that is more likely to be closer to the true value).
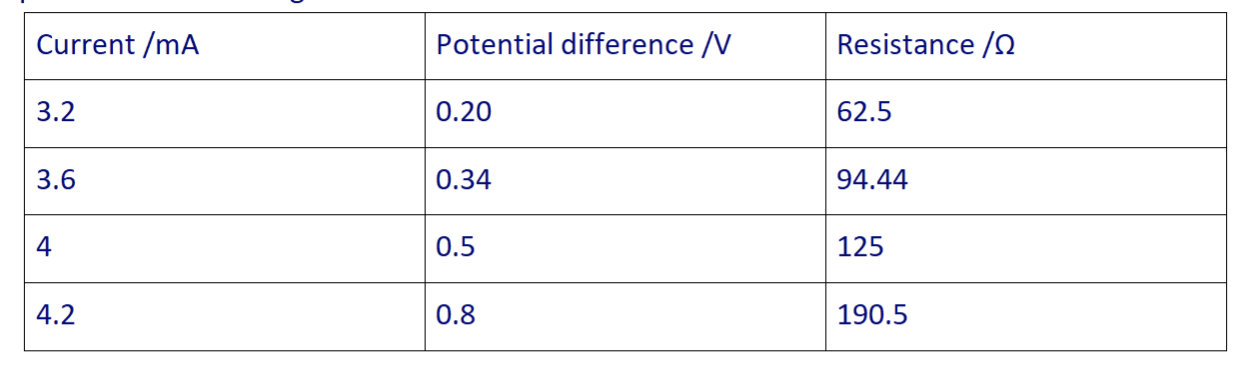
Example: A student carries out an experiment to determine the resisitance of a device by measuring the current and p.d. across it for different values of the current. They produce the following table. Criticise this set of results.
• All values of current should be given to the same number of decimal places. • All values of p.d. should be given to the same number of decimal places. • All values of resistance should be given to the same number of s.f. as the raw data it was calculated from (i.e. as the p.d. and current, so all resistance values should have 2.s.f.). • There are only 4 set of results - there should be at least 6. • There is no evidence of repeats. • The range of values of the current is too small.
(Make sure answers are applied to the question - be specific)
Define directly proportional and describe its graphical appearance.
• Two quantities are directly proportional if when, one increases by a certain factor, the other increases by the same factor. • It will be a straight line through the origin.
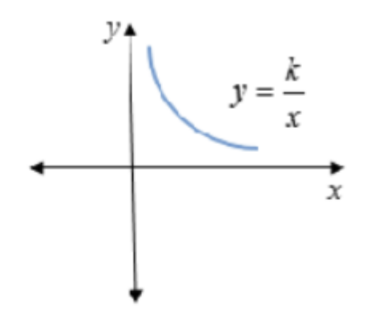
Draw a graph illustrating the relationship between two quantities that are inversely proportional.
y = k/x (reciprocal graph)
Explain why we should always seek to plot a straight line graph in physics.
• It is only through converting equations into y=mx+c form and drawing straight line graphs, that the validity of equations can be tested and constants determined. • An inverse proportion graph looks very similar to (e.g.) an inverse square graph - it is difficult to spot the relationship when drawing curves.
A student wants to determine the value of acceleration due to gravity. He measures the time taken for a ball to fall a distance s. He substitutes his measured values into the equation g = 2s/t^2.
Another student changes the displacement through which the ball falls, s, and measures the time taken for each case. She plots a graph of t^2 against s, draws a line of best fit and determines the gradient = 2/g. She calculates g as 2/gradient.
Explain which result is likely to be mroe accurate.
• The student who plots a graph is likely to get a more accurate result. • Because the line of best fit averages the results. • This reduces the effect of random error.
Describe, by rearranging the equation into y = mx+c form, what should be plotted on each axis, to give a straight line graph fro the following equations: a) EMF = V + Ir (changing I, measure V) b) s = 1/2 gt^2 (changing s, measure t) c) T = 2π √(l/g) (changing I, measure T) d) E = hc/λ (changing λ, measure E) e) ρ = RA/I (changing I, measure R)
a) V = -rl + EMF b) t^2 = 2/gs c) T^2 = 4π^2/g x l d) E = hc x 1/λ e) R = ρ/A x I
Explain why a graph of R against I, would produce a straight line graph through the origin.
• The equation linking R and I can be arranged into the form: • R = ρ /A x I (in y = mx + c form) • Where the gradient is ρ /A. As both ρ and A are constants, the gradient is a constant and so the graph should be a straight line. • The line should pass through the origin as the y-intercept (c) is zero.