Time Series Visualizations
0.0(0)
0.0(0)
New
Card Sorting
1/21
Earn XP
Description and Tags
Pls Andrew pls pt. 2
Study Analytics
Name | Mastery | Learn | Test | Matching | Spaced |
|---|
No study sessions yet.
22 Terms
1
New cards
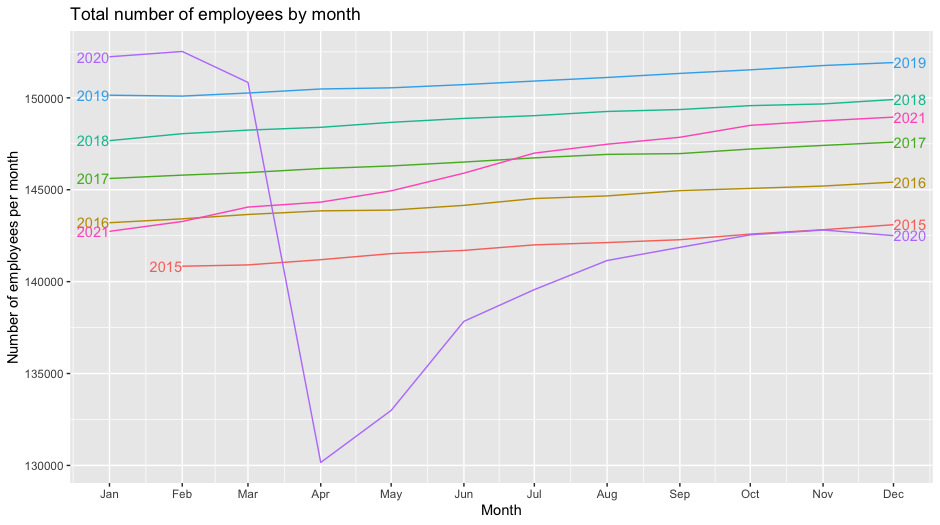
What is this?
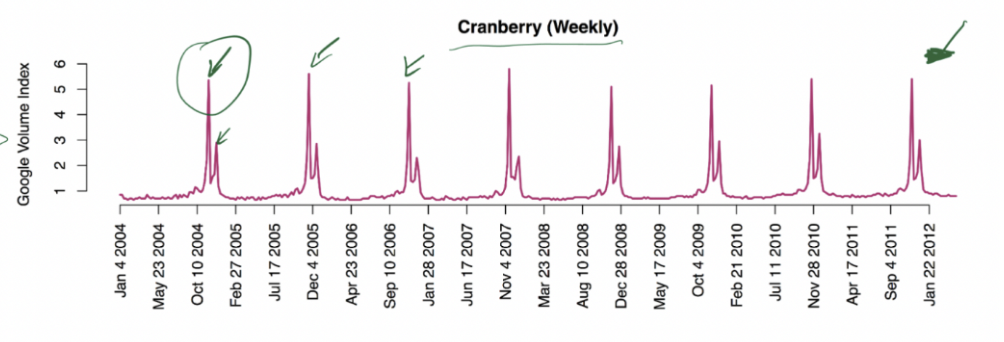
seasonal plot
2
New cards
When to use a Seasonal Plot
Can be used to visualize seasonality more clearly and have data from each season overlap
3
New cards
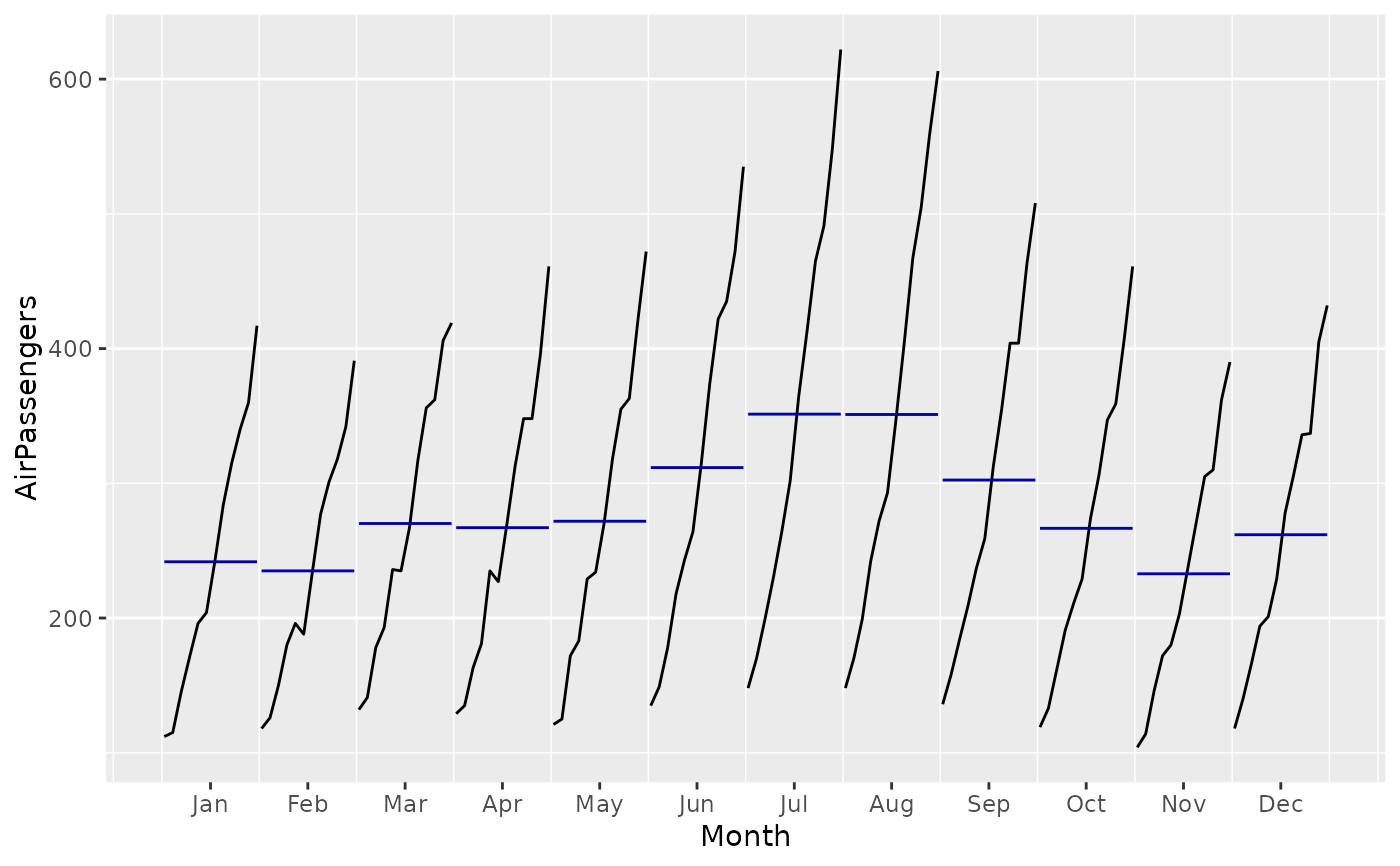
What is this?
Seasonal Subseries Plot
4
New cards
When to use a Seasonal Subseries Plot
\-Can be used to study the seasonality
\-Useful if we already know about the period of seasonality
\-Effective way to analyze between and within group seasonal patterns
\-Useful if we already know about the period of seasonality
\-Effective way to analyze between and within group seasonal patterns
5
New cards
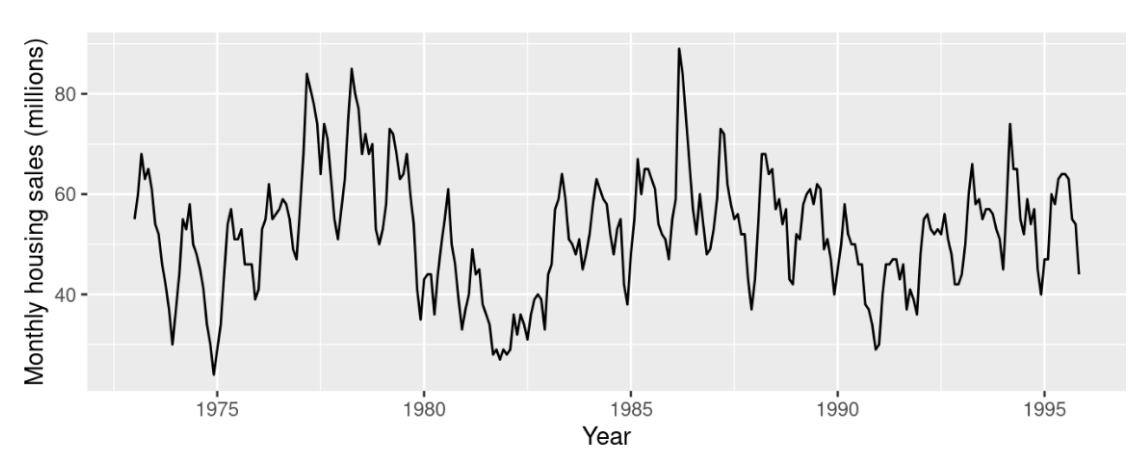
Characteristics within a time series plot
Seasonality, cycles, trends, and variability
6
New cards

What is this?
connected scatter plot
7
New cards
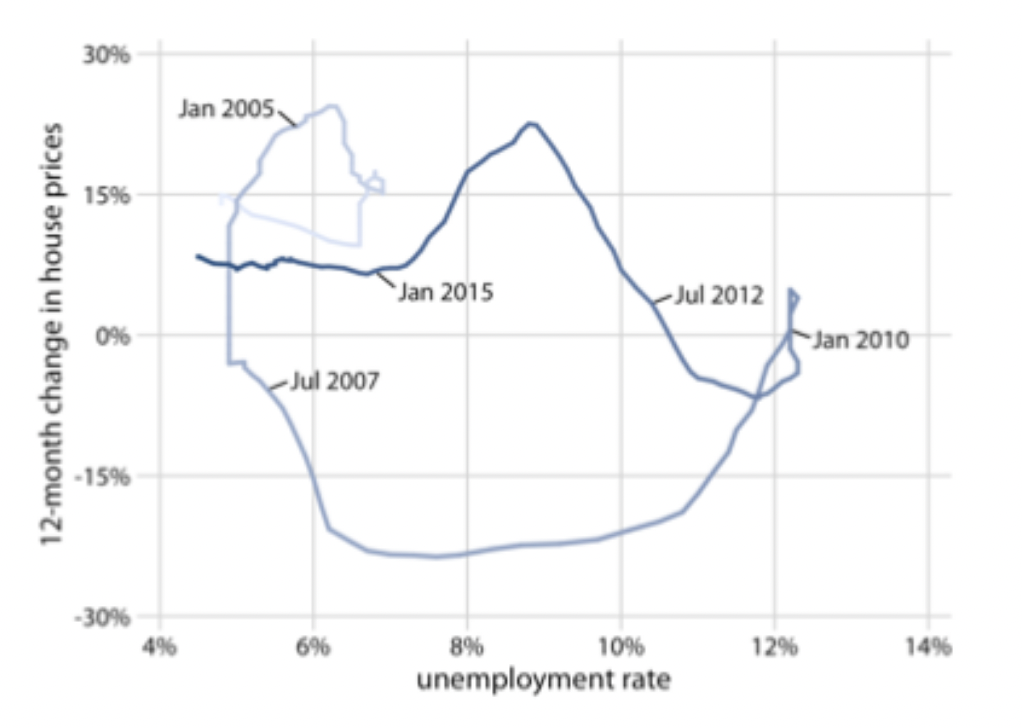
How to read this connected scatter plot
\-line going from the lower left direction to the upper right indicate positively correlated movement
\-line going from the upper right direction to the lower left indicate negatively (anti) correlated movement
\-line going from the upper right direction to the lower left indicate negatively (anti) correlated movement
8
New cards
When to use Line graphs
\-Help visualize the temporal trend of the points
\-They are especially useful for visualizing multiple time series on a single plot
\-Lines can be color coded or drawn differently (dotted, solid, dashed) to distinguish the trends from different categories
\-They are especially useful for visualizing multiple time series on a single plot
\-Lines can be color coded or drawn differently (dotted, solid, dashed) to distinguish the trends from different categories
9
New cards
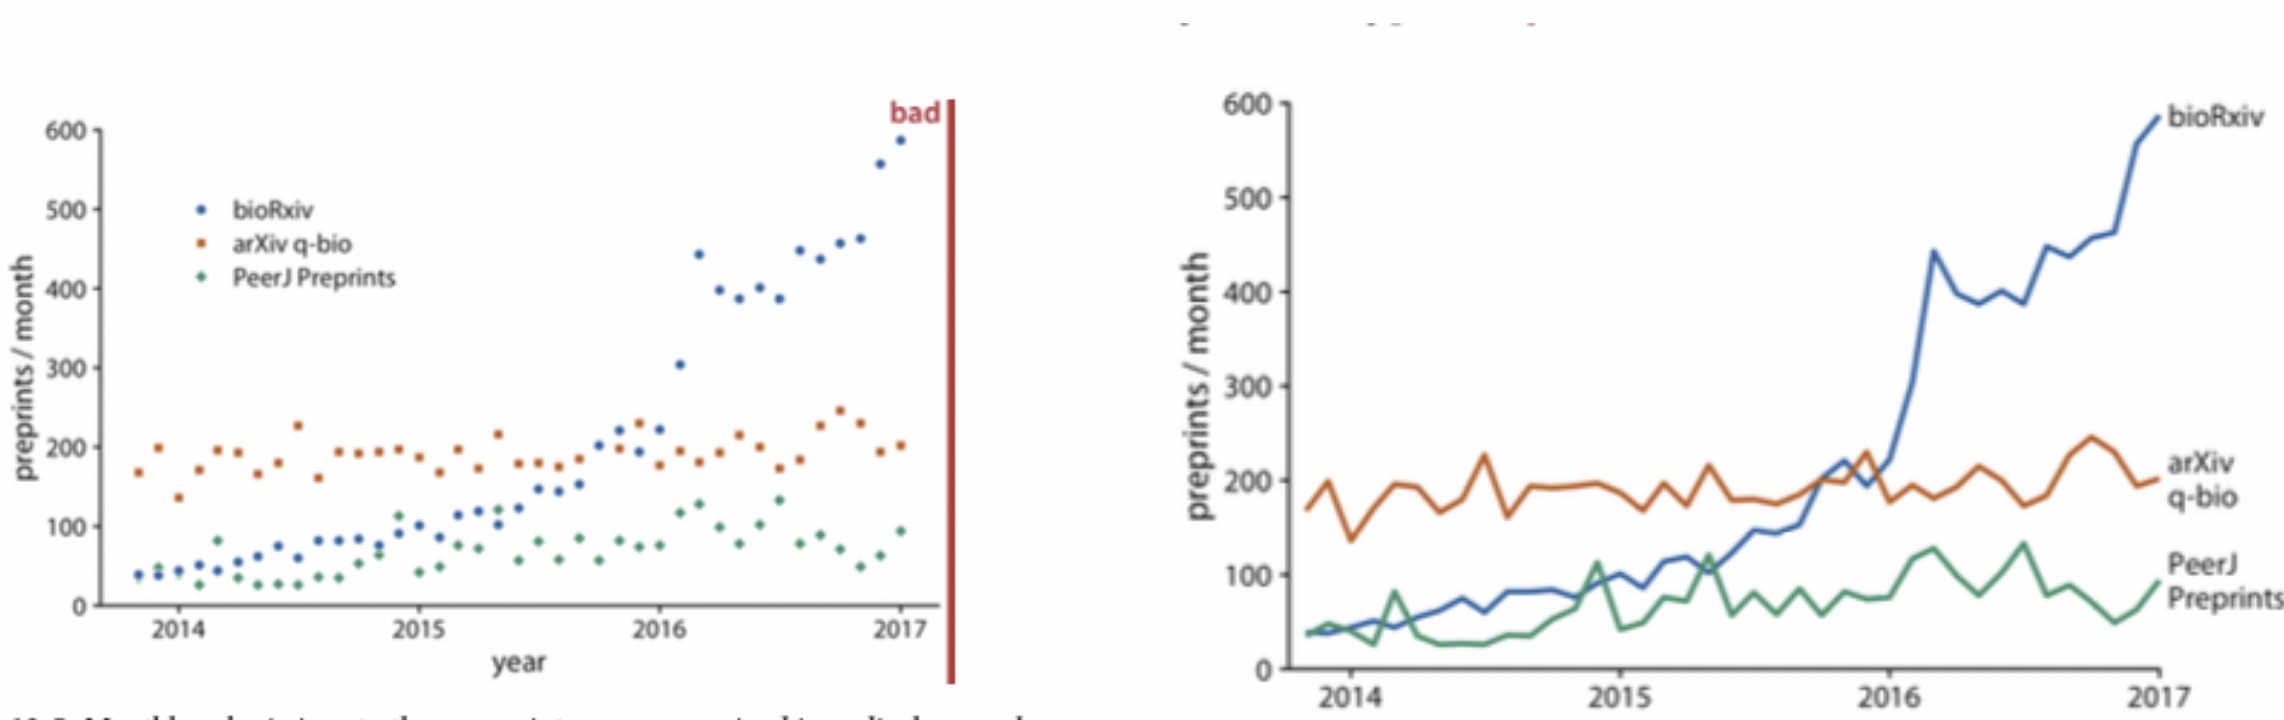
What is this?
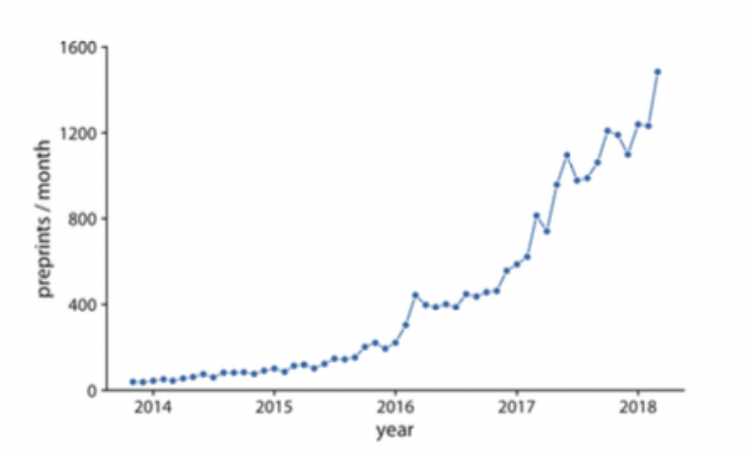
Line Graph
10
New cards
Definition of a line graph
A line graph is formed when we connect the points in a time series plot
11
New cards
What does the x and y axis represent in a time series plot?
In a time series plot, the x-axis represents time and the y-axis represents the variable of interest measured at each time point
12
New cards
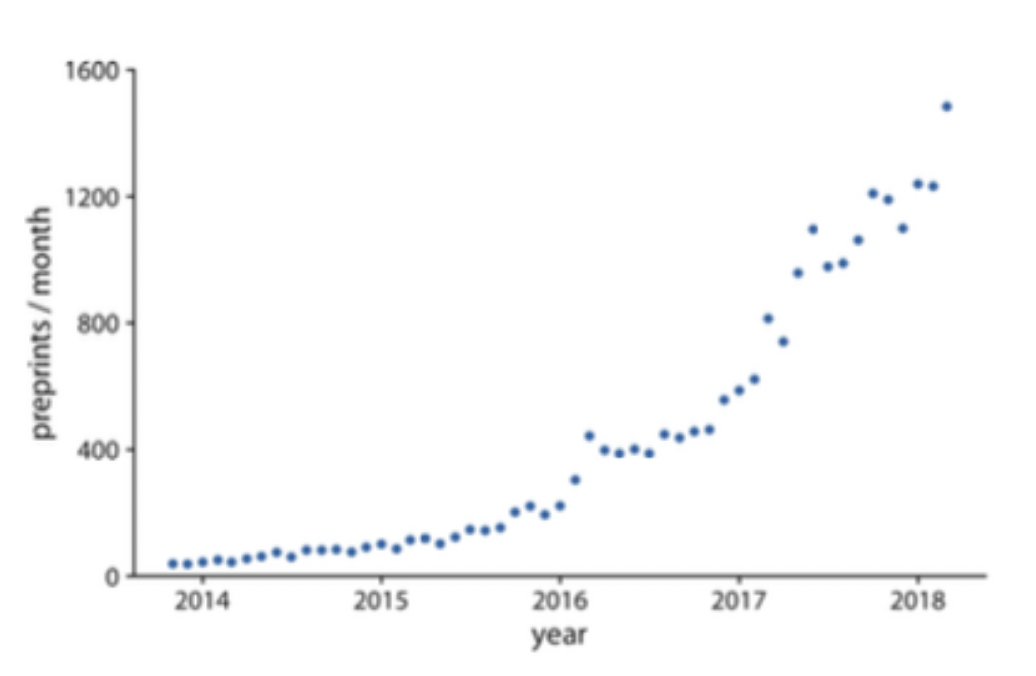
What do these dots represent?
These dots represent the number of submissions during the respective month
13
New cards
What is the seasonal pattern of a time series based on the seasonal and seasonal sub-series plot?
When consistent and repeating factors occur within a year (so basically just look at the graph and see if there are repeating patterns)
14
New cards
Seasonality
The repeating patterns that occur within a year; it is a systemic calendar related effect
15
New cards
Cycles
Patterns; when time series data exhibits repeating behavior over an area that is not of fixed frequency (so not seasonal); can only be observed over a long enough period of time
16
New cards
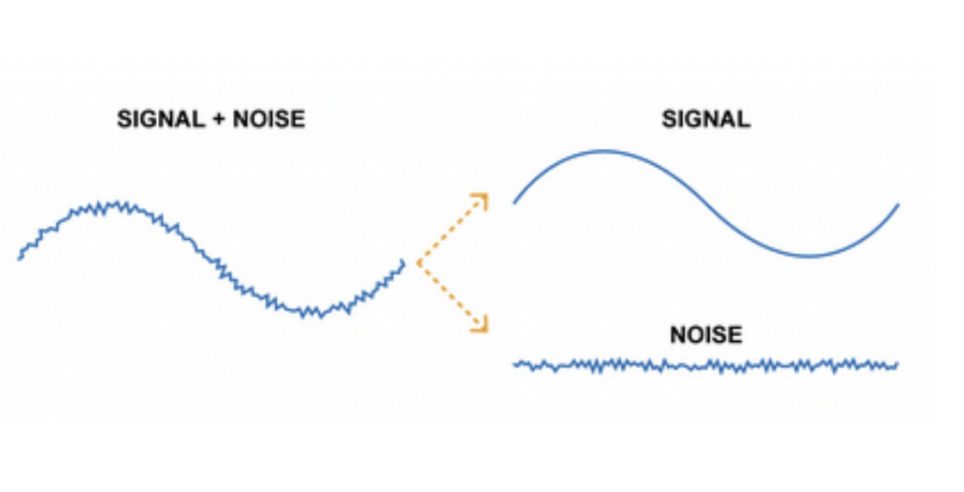
Random Variation (variability)
Noise; random factors that make up a time series
17
New cards
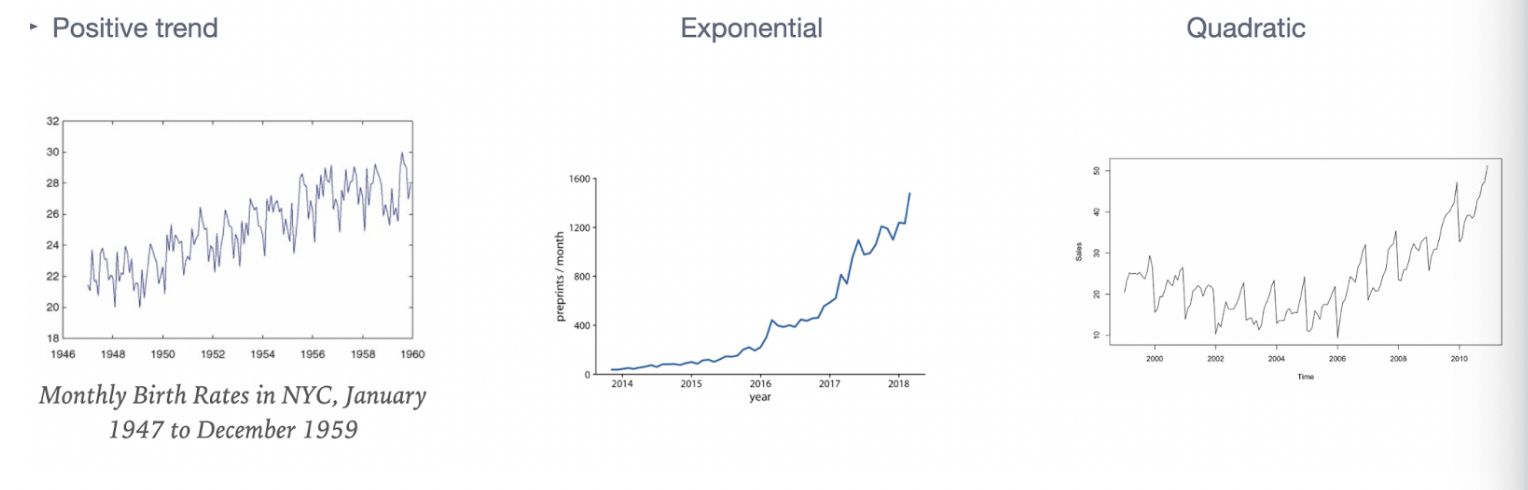
Trend
Exists when there is “movement” (long-term increase or decrease) in the data; there should be an increasing or decreasing slope in your time series
Note: a trend does not have to be linear, it could be quadratic for example
Note: a trend does not have to be linear, it could be quadratic for example
18
New cards
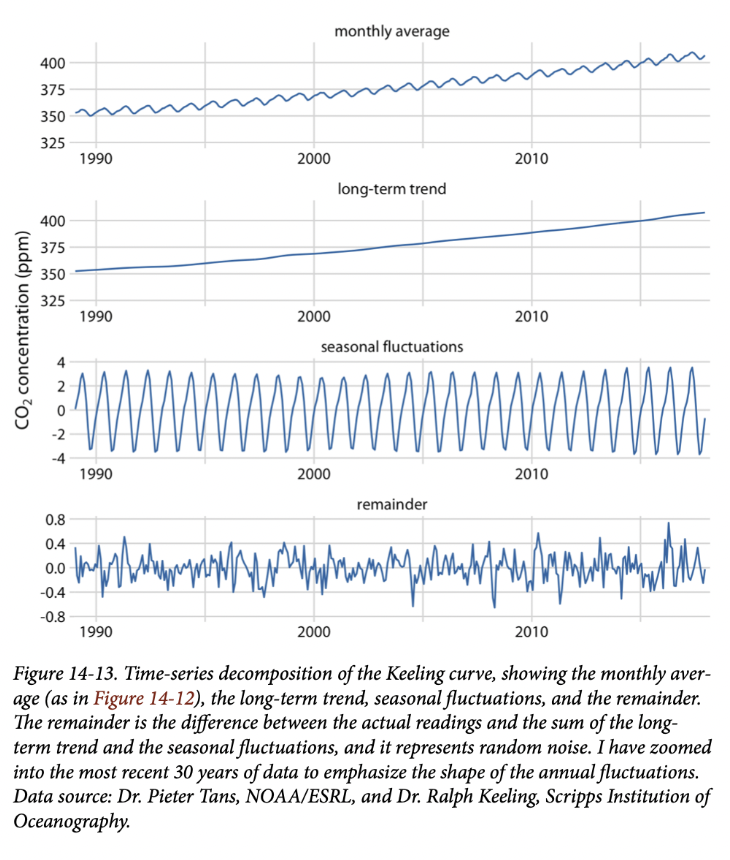
How to read a time series decomposition
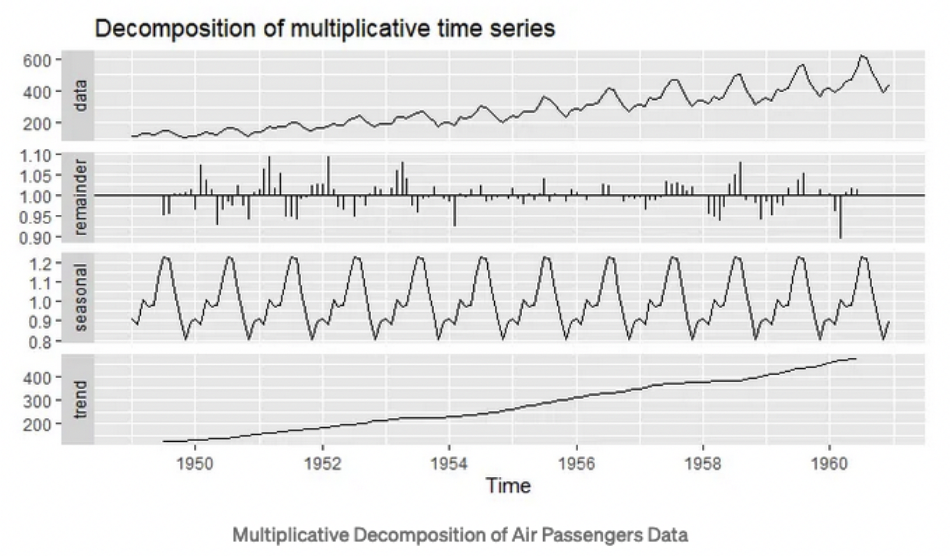
When the overall time series is modeled as the sum of each component, it is **additive**. When there is increasing variability, it is **multiplicative**.
19
New cards
Comparing mean vs median filtering for smoothing a time series
Mean is a measure of center that is not robust to outlier and unusual observation. Since the median is robust to outliers, it is a more appropriate filter to use when there are outliers to smooth data
20
New cards
How to interpret the trend-cycle pattern and sources of variability
idk lol
21
New cards
Multiplicative time series
When the original time series is equal to the product of the components
22
New cards
Time series are made up of what two parts?
Signal and Noise