10 circular flow
1/47
There's no tags or description
Looks like no tags are added yet.
Name | Mastery | Learn | Test | Matching | Spaced | Call with Kai |
|---|
No analytics yet
Send a link to your students to track their progress
48 Terms
circular flow
model illustrating how money, goods, and services move through an economy
represents the interactions between households and businesses in the production and consumption of goods and services
injection
additions to the circular flow
income
exports
government spending
withdrawal (leadkage)
factors that leas to income not being passed on within the circular flow
savings
tax
imports
saving
the portion of income not spent on consumption and instead set aside for future use
investment
money spent on capital goods to generate future income flows
what causes businesses to invest
low interest rates
high confidence
higher income
lower corporation tax
technology to replace obsolete assets
what causes households to save
high interest rates
threat of recession
higher national income
age of population
what causes households to save less
low interest rates
high consumer confidence
economic growth
disposable income
Income available to households after taxes and necessary expenses are deducted, which can be used for saving or consumption
saving ratio
The proportion of disposable income that households save rather than spend on consumption
positive multiplier effect
a situation where an increase in injections (such as investment, government spending, or exports) leads to a larger final increase in GDP
an initial increase in spending creates income for someone, who then spends part of that income, which becomes income for someone else, and the cycle continues
negative multiplier effect
a situation where a decrease in injections or an increase in leakages (like savings, taxes, or imports) leads to a larger fall in GDP
a cut in spending reduces income, leading to less consumption and further declines in income/output throughout the economy
reasons for an higher multiplier
Marginal propensity to consume (MPC) is high
When people receive extra income, they spend a large portion of it, fuelling further rounds of spending
Low savings rate
Less income is saved, meaning more money continues to circulate in the economy.
Strong consumer and business confidence
People are more likely to spend and invest, amplifying the impact of initial injections.
Low taxes
More disposable income is available to be spent rather than taken out of the circular flow.
Spare capacity in the economy
If there's unemployment or unused resources, increased demand leads to more output rather than just higher prices.
Reasons for the Negative Multiplier Effect
High marginal propensity to save (MPS)
People save most of their income instead of spending it, weakening the cycle of income generation.
High taxes
A larger portion of income is withdrawn by the government, reducing consumers' spending power.
High import spending (high marginal propensity to import)
Increased income leads to more spending on foreign goods, so the money leaves the domestic economy.
Falling confidence
If consumers and firms are pessimistic, they cut back on spending and investment, deepening downturns.
Austerity measures
Cuts in government spending or tax hikes reduce demand and can trigger a downward spiral in output and employment.
additional income equation
MPC + MPS + MPM(import) + MPT(tax)
multiplier formula
1 / (1 - MPC)
importance of the MPC
confidence
if consumers are confident they will consume more
household income level
with lower incomes, households will spend a greater proportion of income on essential goods and services, increasing their MPC
interest rate
higher interest rates makes borrowing more expensive and saving more attractive so the MPC falls
real income
the actual income of an individual or group, adjusted for inflation, reflecting the purchasing power of money
nominal income
the income of an individual or group without adjusting for inflation
marginal propensity to consumer
the fraction of additional income that a household consumes rather than saves, influencing overall spending in the economy
marginal propensity to save
the fraction of additional income that a household saves rather than consumes, impacting savings rates and investment in the economy
marginal propensity to tax
the fraction of additional income that a household pays in taxes rather than consumes or saves, influencing government revenue and economic behaviour
marginal propensity to import
the fraction of additional income that a household spends on imported goods rather than domestic products, worsening the current account balance and affecting domestic production
marginal propensity to withdraw
the fraction of additional income that is not spent in the domestic economy, affecting overall demand and economic growth
aggregate demand
the total demand for all goods and services in an economy at a given price level and in a given time period
AD =
C + I + G + (X - M)
why does the AD curve slope downwards
income effect
as price level falls the real value of income rises, money goes further
substitution effect
as the price level falls, UK products become cheaper to international buyers and so the demand for UK goods and services rises
interest rate effect
low inflation results in lower interest rates, which encourage borrowing and spending, increasing aggregate demand
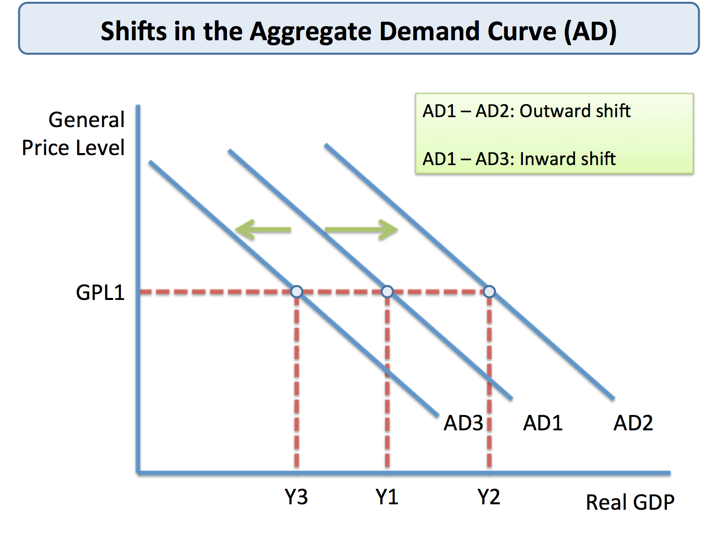
what causes AD to shift
change in any C + I + G + (X - M)
consumption
consumer expenditure on goods and services, included durable and non durable goods
goods - visibles
services - invisibles
credit - money flowing in
debt - money flowing out
factors effecting investment
business confidence
interest rates
depreciation
technological advancements
income
substitutes
profit retained
price of capital
factors affecting consumption
taxation
interest rates
confidence
wealth
distribution of income
MPC
wealth effect - when prices of assets fall, consumers feel poorer and reduce spending
age, size of population
government spending
expenditure by the government to influence economic activity, including public services, infrastructure or welfare payments
factors effecting government spending
economic growth
unemployment rates
inflation rates
tax income
shocks
state of economy
accelerator effect
a rise in national income results in a proportionately larger rise in investment
businesses invest lots now so then they can produce extra units when demand increases, leading to higher production and investment
capital output ration
ratio of capital required to produce a given level of output, indicating how efficiently capital is used in the production process
invest 400, get an every 100 every year after the investment = capital out ration 4:1
multiplier and accelerator together
increase in spending
multiplier effect
rise in national income
accelerator effect
increase in investment
back to top
net exports
X - M, trade balance
when exports are positive there is a trade surplus
when exports are negative there is a trade deficit which reduces AD
factors effecting net exports
strength of pound
if UK goods are competitive
tariffs
substitutes
inflation
consumer income
non-price factors
reputation
quality
demand shocks
when AD fall unexpectedly
examples
credit crunch 2008
price bubbles
recession
aggregate supply
total quantity of output that producers in the economy are willing and able to supply at a given price level over a time period
factors affecting total production
price level rises there is a profit incentive to supply more
as output increases production costs increase as resources become more scarce so firms raise prices to maintain profit margins
price of raw materials
cost of labour
level of tax
better production techniques
improve quality / quantity of capital
increased productivity
availability of FOP
SRAS
Short-Run Aggregate Supply, representing the total production output available in the economy at varying price levels over a short time period
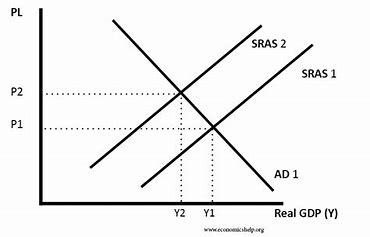
factors affecting SRAS
if costs change at each price level/output
average costs = total costs / output
wage rates
raw material and component prices
taxation/subsidy
interest rates affecting cost of loans
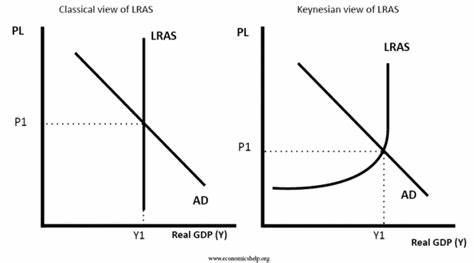
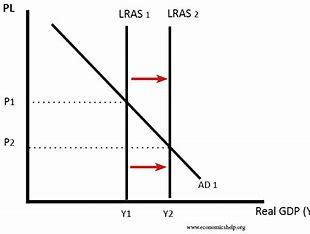
LRAS
Long-Run Aggregate Supply, representing the total output of an economy when all input prices can adjust, indicating full employment and production capacity
reflects an economies productive capacity
the maximum output that can be produced with UK FOP
factors affecting LRAS
only way to move LRAS is through an increase in the quality or quantity of FOP
land
labour
education, birth rate
capital
technological advancements
enterprise
training, tax incentives
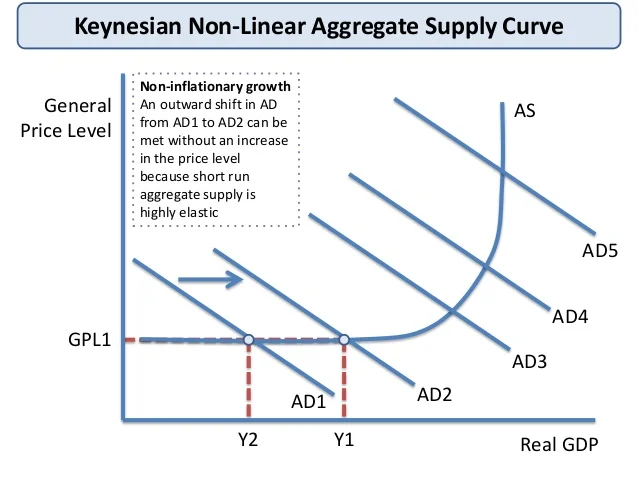
Keynesian AS
AS is highly price elastic as producers have spare capacity and can increase output without higher costs
output can only be increased at the expense of an increase in PL as resources become more scarce and firms get close to full capacity
full employment, no extra resources available so AS becomes inelastic. FOP very expensive
supply side shocks
rise in oil/gas prices
strikes
natural disaster
breakthrough in technology
change in ER

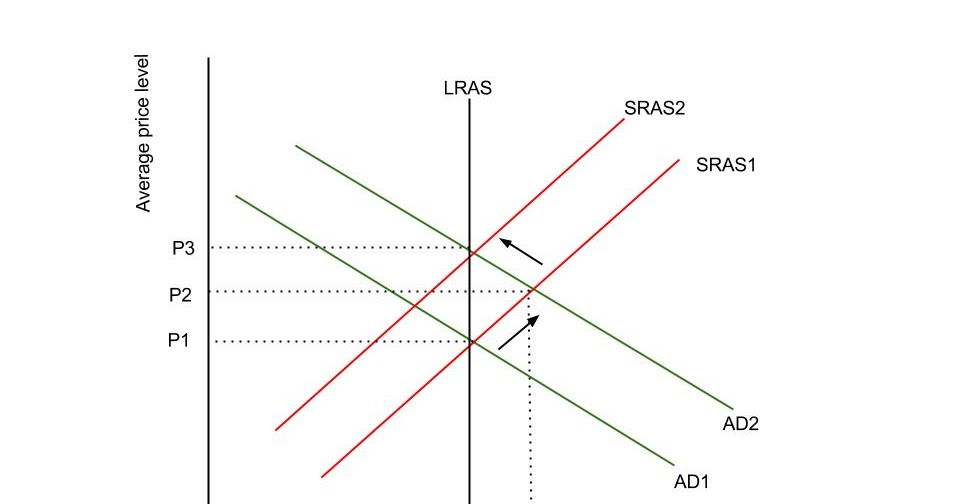
classical AD, AS diagram
AD increases above capacity
firms want to increase out put as there is a profit incentive (excess demand)
firms can only do this by working employees overtime
firms only willing to extend supply if PL increases to compensate
contraction down AD2
however in the long run costs increase at every price level
SRAS shifts left, resulting in a new equilibrium at a higher price level