ENVS Dr. Moreno Exam 2
1/42
Earn XP
Description and Tags
based on lecture
Name | Mastery | Learn | Test | Matching | Spaced |
|---|
No study sessions yet.
43 Terms
genetic diversity
all the different genes contained in all individual plants, animals, fungi, microorganisms
species diversity
all the differences within and between populations of a species, as well as between different species
ecosystem diversity
all the different habitats, biological communities, and ecological processes, as well as variation within individual ecosystems
Functional diversity
Ecological roles in a system
Vertical Diversity
Different layers of organisms that occupy a vertical space
Horizontal Diversity
spacial distribution of organisms across a horizontal space
Structural Diversity
Different morphological structures within a system
Example of Structural Diversity
Shade grown coffee plantation
Temporal diversity
Variations in the pattern of biotic and abiotic change over time
Biodiversity
The concept of variation within and among individual organisms, biotic populations and communities, ecosystems, biomes, as well as variation in the biotic and abiotic processes that time them together
Ways to assess biodiversity
Species richness, species evenness, Shannon index
Species richness
The number of species present in a given area
Species evenness
relative abundance of species in a given area
Shannon Index (H)
Value that describes number and proportionality of species
Shannon Index Formula
Shannon Index (H) = -Σ (pᵢ * ln(pᵢ)) where pᵢ = proportion of each species.
The 5 threats to biodiversity
Climate change, habitat loss/fragmentation, invasive species, pollution, overexploitation
Acronym to remember 5 threats to biodiversity
CHIPO
Biological communities
multiple species in a given area
Common characteristics of community structure
Community composition is dynamic and changes over time, composition of a community is shaped by abiotic and biotic factors, communities are composed of numerically dominant and subdominant species
Example of Community Structure
Cat Island, Tashirojima Japan. Silkworm trade booms, mice find their way to island and start eating the silkworms so people leave the island, cats are introduced to decrease mice population
Species Abundance Distribution (SAD)
Numerically dominant are a few species that comprise about 70% of all individuals in a community whereas the numerically subdominant are the majority of species but only comprise 30% or less of all individuals
Examples of SAD
Upstate New York Bird Study, Beetles in Freshwater streams in UK, United States plains grasses in grasslands
Top 3 factors that drive numeric dominance and subdominant (in order)
Competition , predation, reproductive ability
Example of Competition driving ND/SD
Paramecium caudatum and Paramecium aurelia. When grown together aurelia (ND) outcompeted caudatum (SD). When grown separate: caudatum reaches ~70 cells, aurelia reaches ~250 cells. When grown together: caudatum reaches ~10 cells then dies, aurelia still reaches ~250 cells
Example of Predation driving ND/SD
Snowshoe hare and arctic fox
Islands are biodiversity hotspots because
they cover ~7% of global surface area but have ~20% of all plant and animal species
Endemism
a species is only found in one specific place
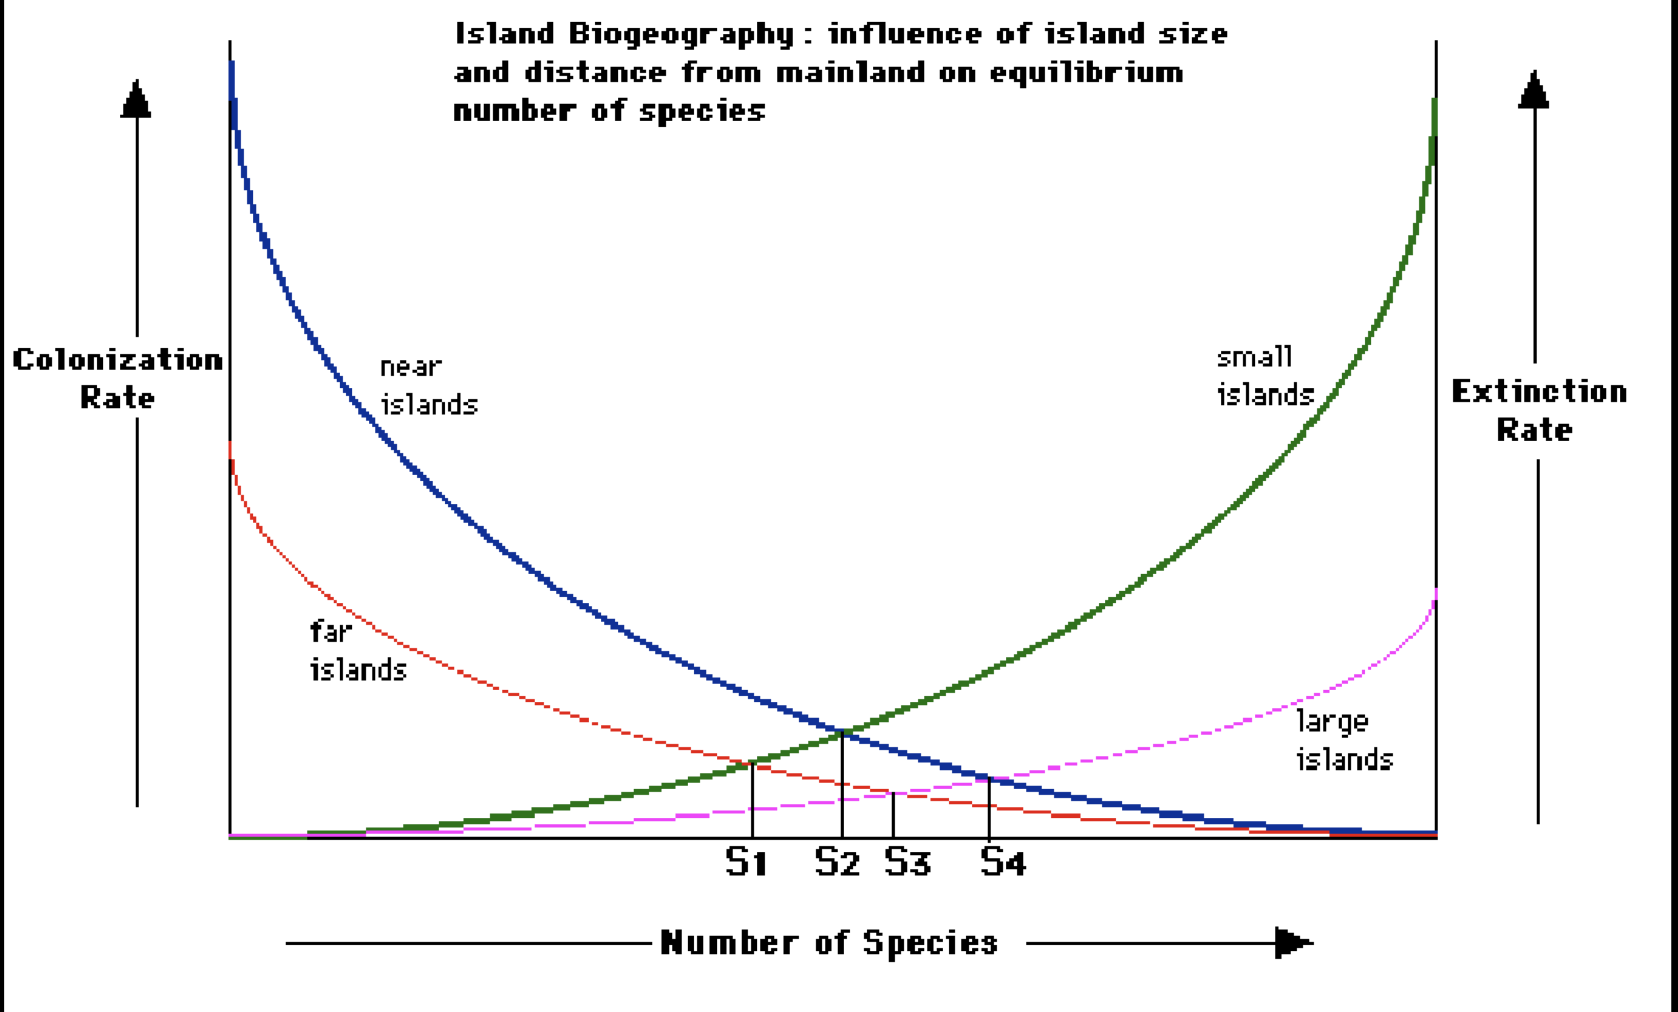
Theory of Island Biogeography
Species richness on islands based on immigration/colonization and extinction. The closer the island is the to mainland the larger the species richness
Colonization Island Biogeography Model
As the number of species increases the rate of colonization decreases. The island is more populated and the chances are lower that an individual that arrives is a new species
Extinction Island Biogeography Model
As number of species increases, extinction rate increases due to composition. Smaller islands have higher extinction rates
Equilibrium points Island Biogeography Model
the number of species you would prediction on an island. where the number of new species that arrives each year is equal to the number of species that go extinct each year
Rank of most species to least species TIB
Most to least: Large near, small near, large far, small far
Example of TIB
Cuba and Hispaniola have more richness out of the Caribbean islands as they are larger and closer to mainland. Islands such as Jamaica have less
Island Biogeography Model
Density dependent factors definition
population limiting factors that depend on size of population
Density independent factors definition
Population limiting factors that do not depend on the size of a population
Examples of density dependent factors
Disease, predation, competition
Examples of density independent factors
natural disasters, pollution, climate
Positive density dependence
as population density increases factors that grow population increase
Example of positive density dependent factors
predation, resource abundance, genetic diversity
Negative density dependence
as population density increases factors that shrink population increase. population is reduced as density increases
example of negative density dependent factors
conflict, competition, disease
Example of species change due to density
Locusts (Shistocerca gregaria var. solitana) transforms into var. gregaria triggered by overpopulation. Their legs touching each other triggers the change. they revert back after finding new resources