Unit 8: inference for Categorical Data: Chi-Square / Unit 9: Inference for Quantitative Data: Slopes
1/61
Earn XP
Description and Tags
Name | Mastery | Learn | Test | Matching | Spaced | Call with Kai | Chat |
|---|
No analytics yet
Send a link to your students to track their progress
62 Terms
What does a chi-square goodness of fit test do?
compare the distribution of categorical data in one population to a hypothesized distribution
What is H0 for a chi-square goodness of fit test?
the distribution of [categorical variable] in the [population] is the same as the claimed distribution
What is Ha for a chi-square goodness of fit test?
the distribution of [categorical variable] in the [population] is not the same as the claimed distribution
How do you calculate expected counts for a chi-square goodness of fit test?
npi, where pi is the proportion for the category i specified by the null hypothesis
What is the chi-square test statistic a measure of?
how far the observed counts are from the expected counts
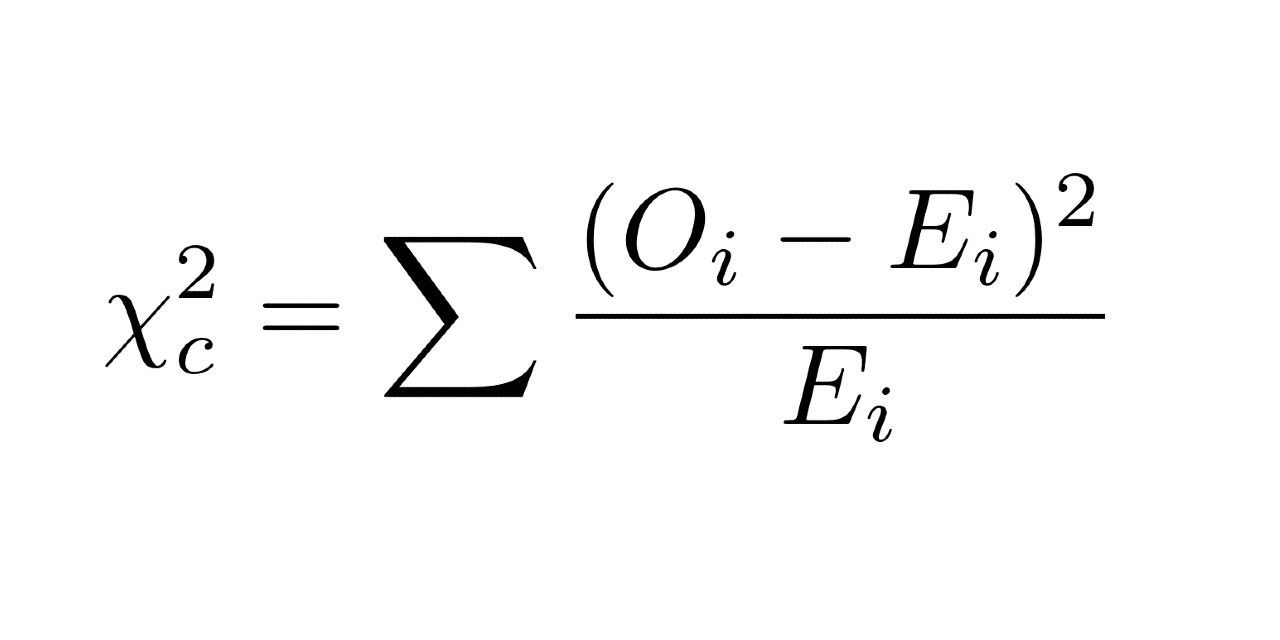
What is the formula for the chi-square test statistic?
What is a chi-square distribution described by?
a density curve that takes only nonnegative values and is skewed to the right
How does the chi-square distribution change shape as df increases?
the curve becomes less skewed
How does the chi-square distribution change center as df increases?
the center increases; it is equal to df
Where is the mode of the chi-square density curve for df > 2?
at df - 2
What is degrees of freedom equal to for chi-square tests?
number of categories - 1
What does the p-value represent in chi-square tests?
the probability of getting an x² value as large or larger than the one calculated
How do you find x² on a calculator?
2nd → VARS → 8: x²cdf(lower: ___, upper: ___, df: __)
How do you find x² using Table C?
calculate df (number of categories - 1) and find the x² critical value you calculated in the row for df
What are the conditions for performing a chi-square test for goodness of fit?
Random
10%
Large Counts
What is the Random condition for a chi-square test?
the data come from a random sample from the population of interest
What is the 10% condition for a chi-square test?
when sampling without replacement, n < 0.10N
What is the Large Counts condition for a chi-square test?
all expected counts are at least 5
How do you perform a chi-square goodness of fit test on the calculator?
enter observed and expected counts in LIST
STAT → TESTS → D: x²GOF-Test(observed: ___, expected: ___, df: ___)
What is the State step in a chi-square test?
state a correct pair of hypotheses (and identify what significance level you will use)
H0 =
Ha =
α =
What is the Plan step in a chi-square test?
check conditions and identify test procedure
chi-square test for goodness of fit
Random
10%
Large Counts
What is the Do step in a chi-square test?
calculate x² test statistic
x² =
df =
p-value =
What is the Conclude step in a chi-square test?
draw conclusion in the context of the problem
Because the p-value of ____ (>/<) α = ____, we (fail to reject/reject) H0. We do not/do have convincing evidence of (Ha in context)
What does a chi-square test for homogeneity do?
compares the distribution of categorical data in two or more populations/treatments to see if they are of the same distribution
What is H0 for a chi-square test for homogeneity?
there is no difference in the true distributions of ______, ______, and _______
What is Ha for a chi-square test for homogeneity?
there is a difference in the true distributions of ______, ______, and _______
How do you conduct a follow-up analysis for a chi-square test for homogeneity?
start by identifying the cells that contribute the most to the chi-square test statistic, then describe how the observed and expected counts differ in those categories, noting the direction of the difference
When do we do a follow-up analysis?
when we reject a null hypothesis in a chi-square test for homogeneity, so we can examine the differences in detail
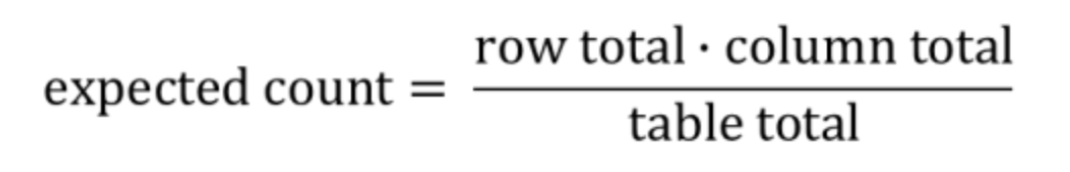
How do you calculate expected counts in a two-way table?
How do you perform a chi-square test for homogeneity or independence on the calculator?
2nd → x-1 → enter observed counts in matrix [A]
STAT → TESTS → x²Test → Calculate
2nd → x-1 → Edit → [B]
What are the conditions for a chi-square test for homogeneity?
Random
10%
Large Counts
(homogeneity)
What is H0 for a chi-square test for independence?
there is no association between _________ and _______ in the population of __________
What is Ha for a chi-square test for independence?
there is an association between _________ and _______ in the population of __________
How do you differentiate between the chi square test for homogeneity and the chi square test for independence?
homogeneity - data comes from two or more independent random samples or treatment groups
independence - data comes from a single random sample with the individuals classified according to two categorical variables
What is a population regression line?
a regression line calculated from every value in the population
What is the equation for the population regression line?
µy = α + βx
What is µy?
the mean y-value for a given value of x
What is α?
the population y-intercept
What is β?
the population slope
What is a sample regression line?
a regression line calculated from a sample
What is the equation for the sample regression line?
𝑦̂ = a + bx
What is 𝑦̂?
the estimated mean y-value for a given value of x
What is a?
the sample y-intercept
What is b?
the sample slope
What is the Shape of the sampling distribution of b?
appx. Normal
What is the Center of the sampling distribution of b?
µb = β
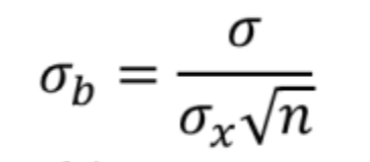
What is the Variability of the sampling distribution of b?
σb = σ/(σx)(√n)
What are the condition for regression inference?
Linear
Independent
Normal
Equal SD
Random
What is the Linear condition for regression inference?
the actual relationship between x and y is linear; for any particular value of x, the mean response µ, falls on the population regression line µy = α + βx
examine the scatterplot to see if the overall pattern is roughly linear; make sure there are no leftover curved patterns in the residual plot
What is the Independent condition for regression inference?
individual observations are independent of each other; when sampling without replacement, check the 10% condition
knowing the value of the response variable for one individual shouldn’t help predict the value of the response variable for other individuals
What is the Normal condition for regression inference?
for any particular value of x, the response y varies according to a Normal distribution
make a histogram, dotplot, stemplot, boxplot or Normal probability plot of the residuals and check for skewedness or outliers
What is the Equal SD condition for regression inference?
the standard deviation of y is the same for all values of x
look at the scatter of the residuals above and below the “residual = 0” line in the residual plot; the variability of the residuals in the vertical direction should be roughly the same from the smallest to the largest x-value
What is the Random condition for regression inference?
the data come from a random sample from the population of interest or a randomized experiment
see if the data came from a random sample form the population of interest or randomized experiment
What parameter does a estimate?
α
What parameter does b estimate?
β
What parameter does s estimate?
σ
What is the standard deviation of the sampling distribution of the slope b?
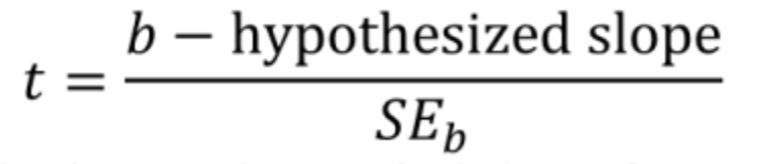
What is the formula for standard error of the slope?
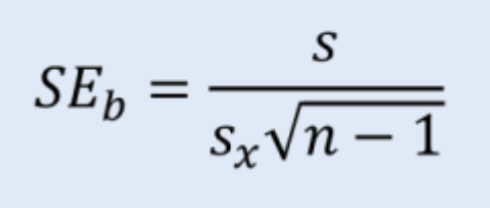
What is the standard error of the slope interpreted as?
how far the sample slope typically varies from the population slope if we repeat the data production process many times
What is the formula for the confidence interval for a slope?
b ± t* (SEb)
What are the degrees of freedom for slope?
n - 2
What is the standardized test statistic for the slope?