Ch. 4- Organism and Population Ecology and Evolution
 Call Kai
 Learn
Learn Practice Test
 Spaced Repetition
 Match
Match Flashcards
 Knowt Play
1/29

Earn XP
Description and Tags
Name | Mastery | Learn | Test | Matching | Spaced | Call with Kai | Chat |
|---|
No analytics yet
Send a link to your students to track their progress
30 Terms
The cells of all plants have _____.
a.) chloroplasts but not mitochondria and use proteins to power their functions
b.) chloroplasts and mitochondria and use carbohydrates to power their functions
c.) chloroplasts but not mitochondria and use carbohydrates to power their functions
d.) mitochondria but not chloroplasts and use proteins to power their functions
b.) chloroplasts and mitochondria and use carbohydrates to power their functions
Which of the following is a difference between cellular respiration and anaerobic respiration?
a.) Only anaerobic respiration produces water.
b.) Only anaerobic respiration produces carbon dioxide.
c.) Only cellular respiration uses oxygen to break down carbohydrates.
d.) Only cellular respiration breaks down carbohydrates.
c.) Only cellular respiration uses oxygen to break down carbohydrates.
Which of the following are found in the cells of a dog but not in the bacteria found on a dog's fur?
a.) membrane-enclosed nucleus and mitochondria
b.) mitochondria, nuclei, and cytoplasm
c.) membrane-enclosed nucleus, chloroplasts, and cytoplasm
d.) mitochondria and chloroplasts
a.) membrane-enclosed nucleus and mitochondria
- Eukaryotes have a membrane-enclosed nucleus and mitochondria not found in bacteria
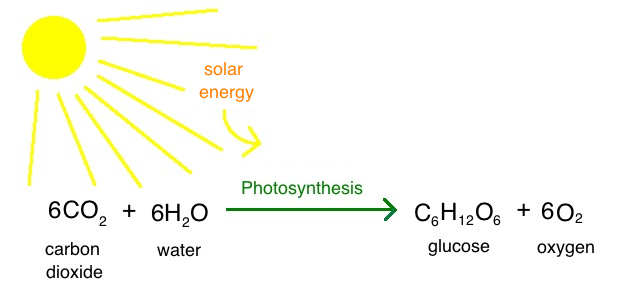
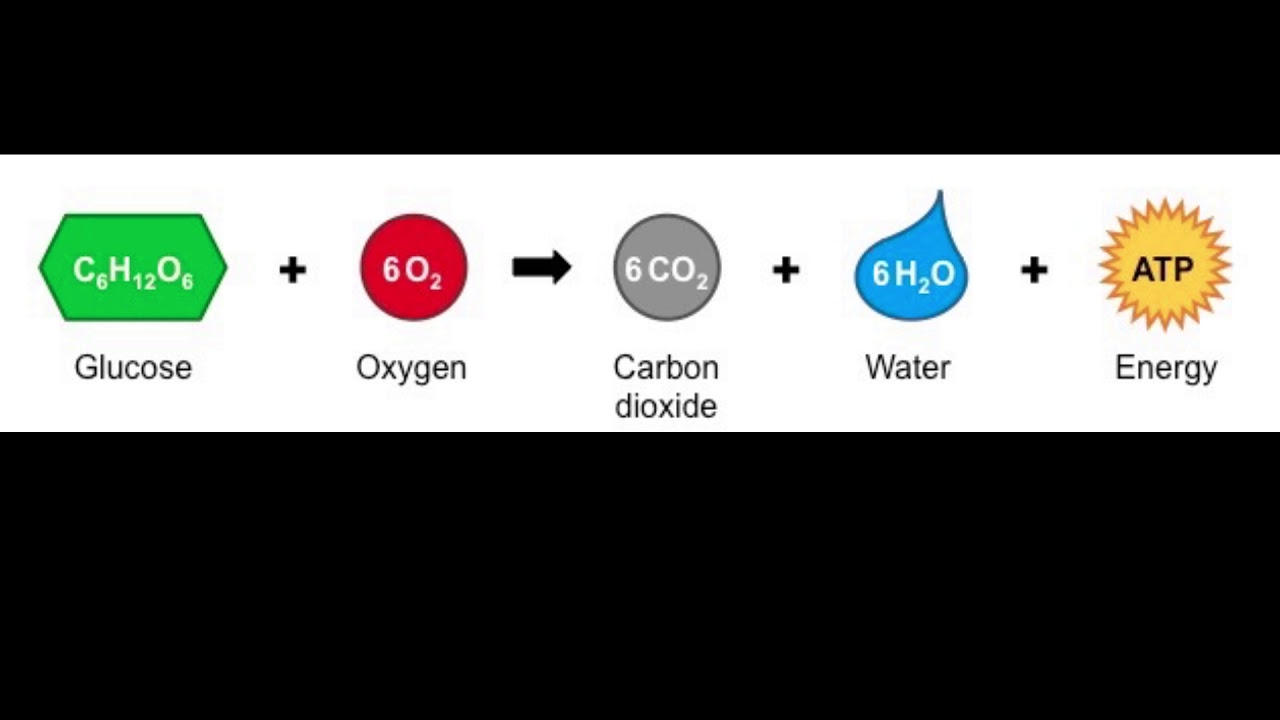
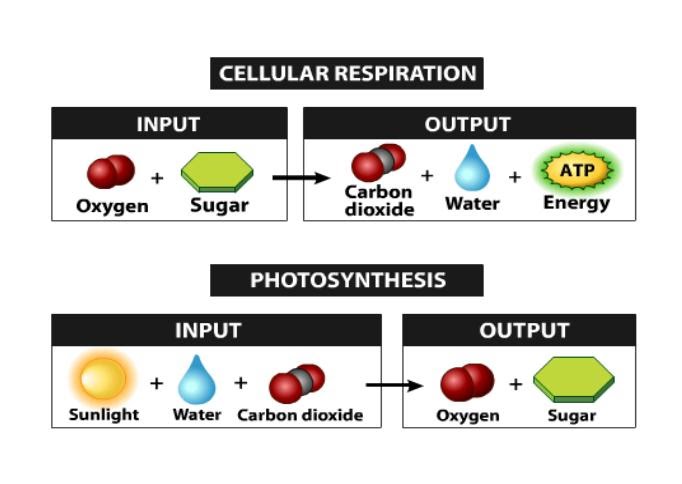
The products of photosynthesis are the materials that react in the process of _____.
cellular respiration
Tissues within an organism's body are different from each other because the cells in each tissue _____.
activate different portions of the identical DNA
An egg and a sperm are _____.
gametes that combine in sexual reproduction to produce a zygote
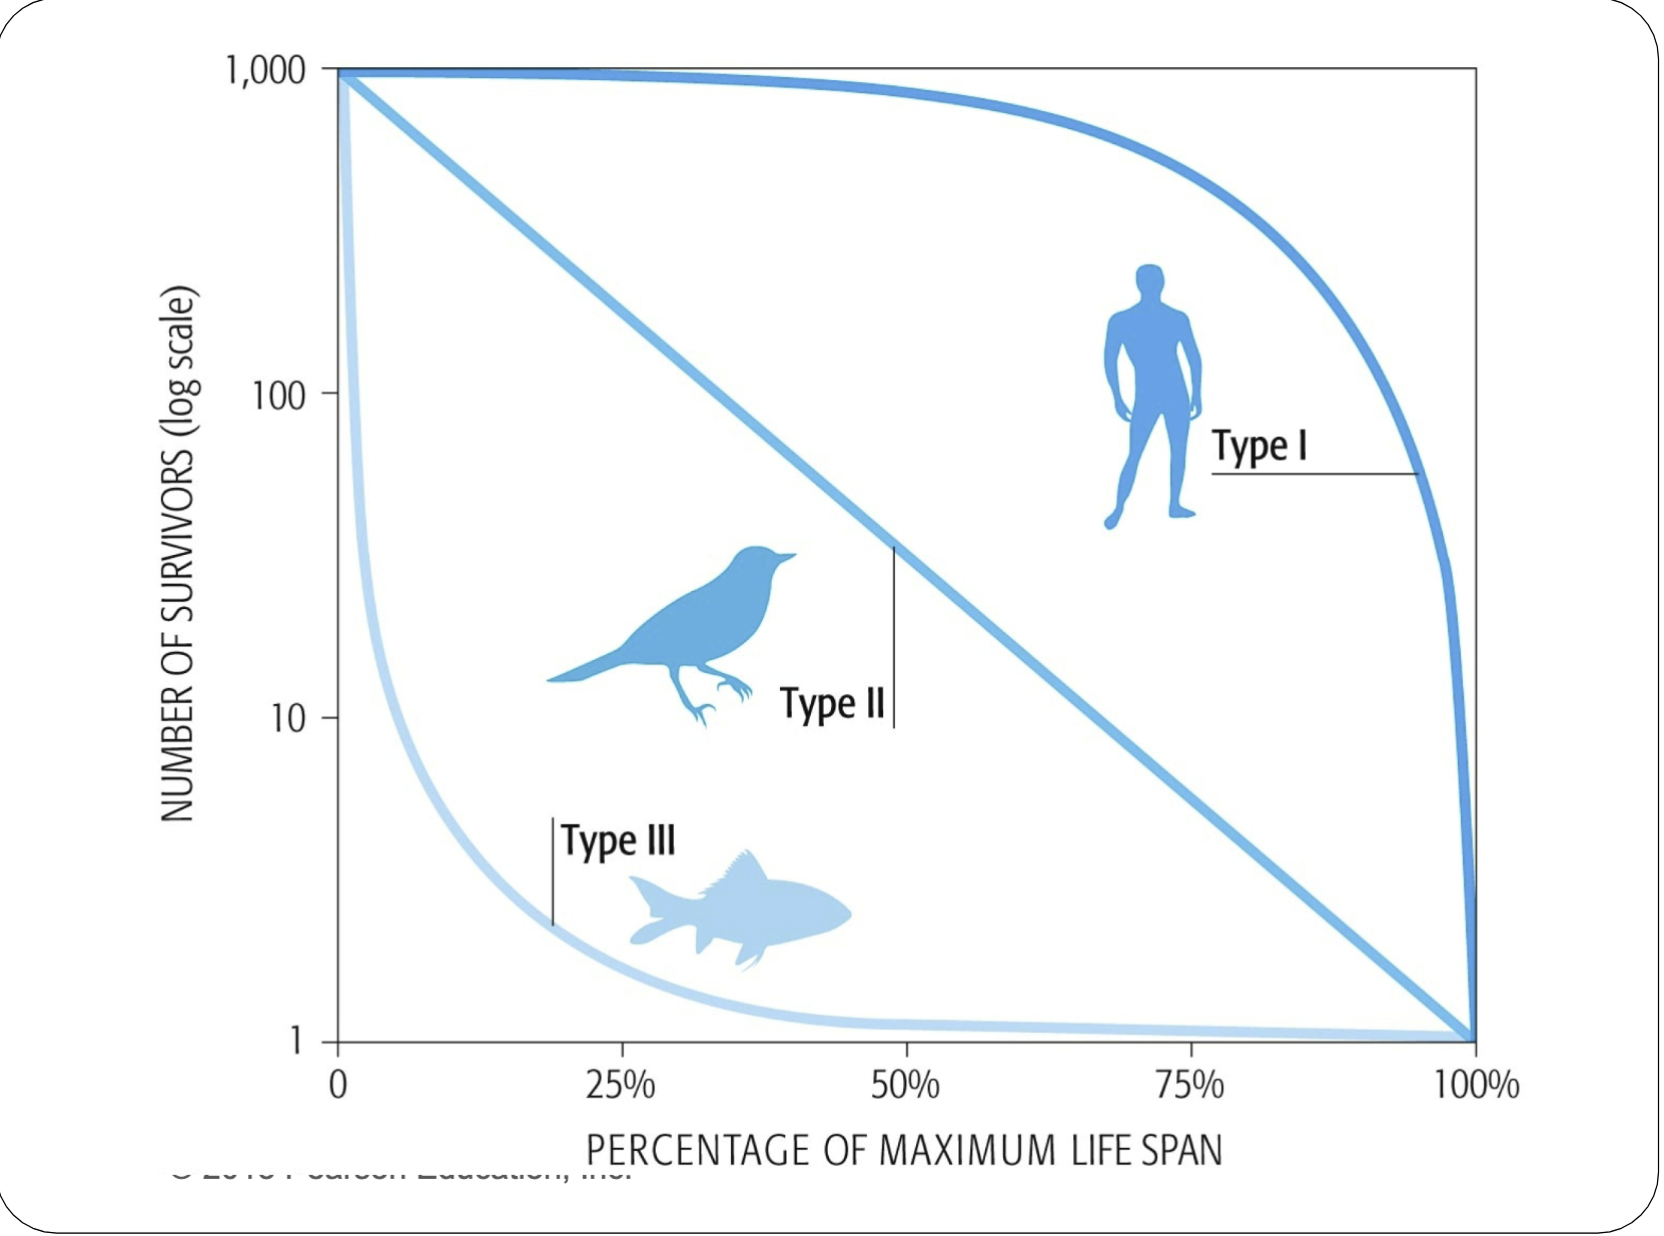
The growth of a population of sparrows accelerates with each generation. Regardless of age, the chances of dying are about the same for these sparrows. This population of sparrows, therefore, demonstrates _____.
exponential growth and a type II survivorship curve
A population will grow the fastest when total fertility rates are _____.
high and generation times are short
A population will not change in size if the _____.
The birth rate equals the death rate, and the immigration rate equals the emigration rate
if the number born equals the number that dies, there is no change. If the number of organisms leaving equals the number coming in, there is no net growth of the population size.
As a population increases to near its carrying capacity, _____.
Birth rates decline, death rate increases, and the overall rate of population growth declines.
The various activities that define an organism's role in an ecosystem are that organism's _____.
ecological niche
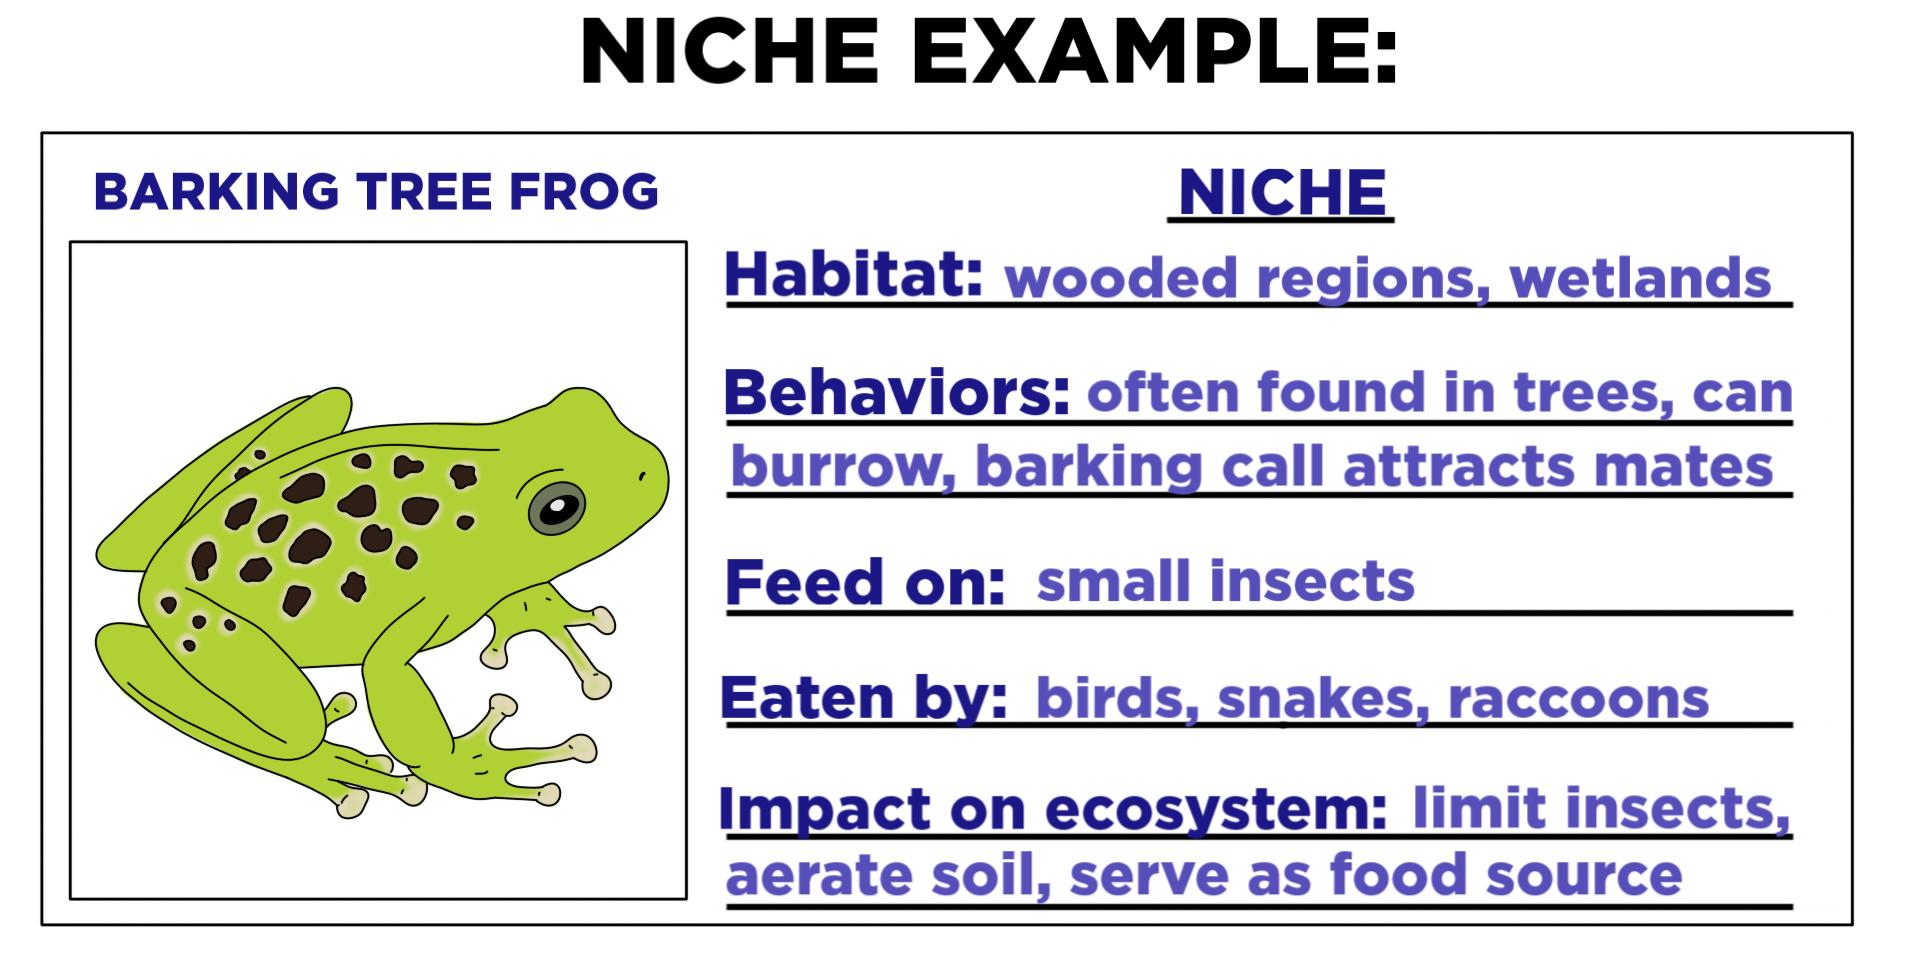
Largemouth bass and rainbow trout are stocked in a small, deep 10-acre pond. The bass are most active in 20-30 °C water, and the rainbow trout prefer water at about 6-22 °C. We expect to find few places in this pond where the two species interact because they have different _____.
ranges of tolerance
What are the inputs of photosynthesis?
carbon dioxide, water, and sunlight
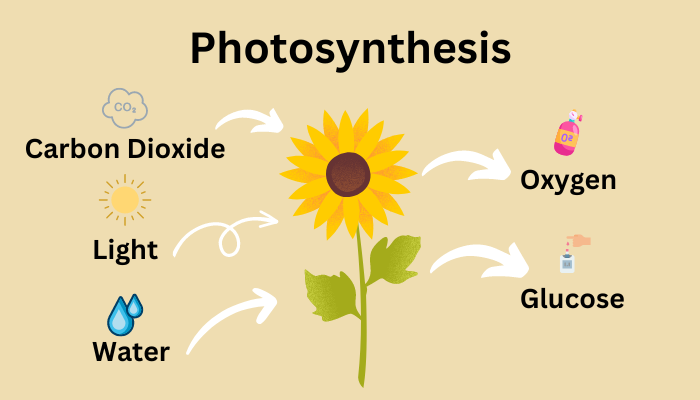
What are the outputs of photosynthesis?
glucose and oxygen
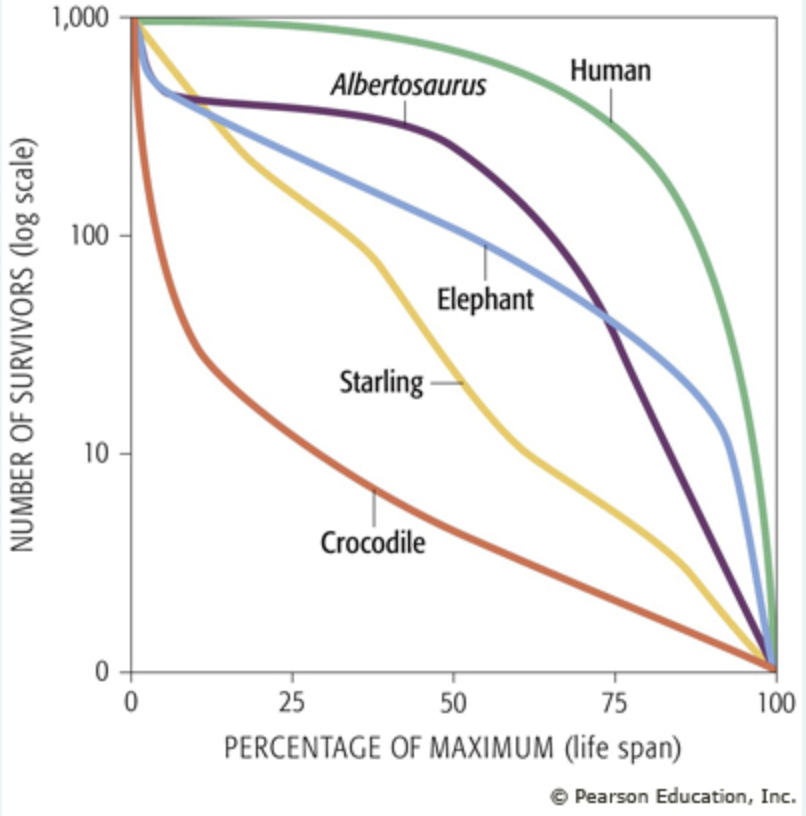
Dr. Gregory Erickson studied the fossilized bones of a dinosaur called Albertosaurus to determine the age at which individual dinosaurs died. From this data, he constructed a survivorship curve.
The graph below compares Albertosaurus's survivorship curve to four modern species. Can you interpret the graph to answer these questions?
What is shown on the x-axis?
percentage of the maximum life span of a species
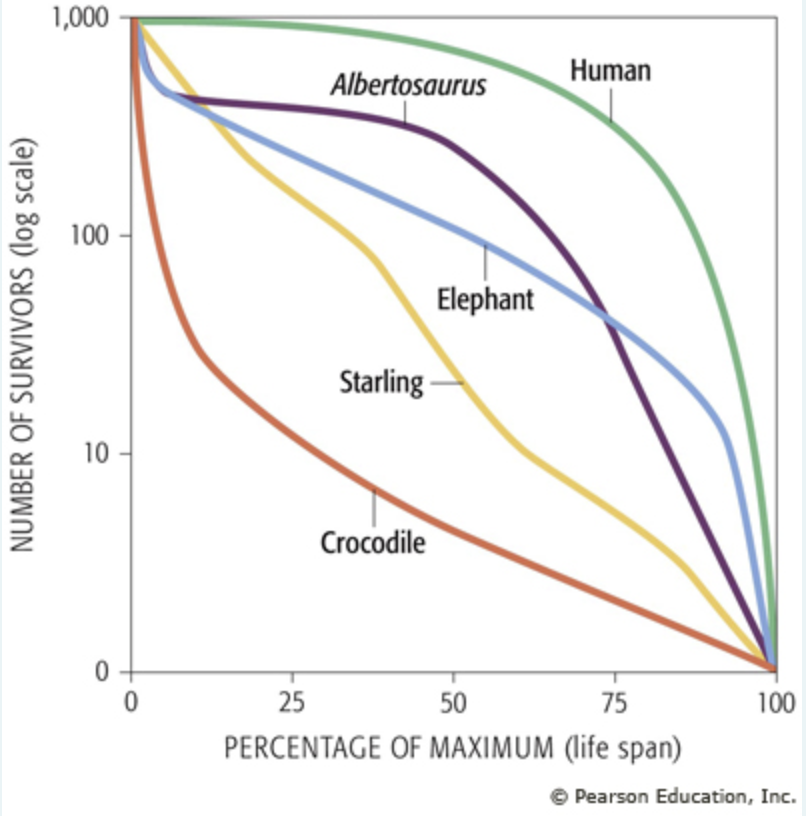
Look closely at the scale on the y-axis. What number would be represented by the point midway between the tick mark labeled 10 and the tick mark labeled 100?
Approximately 32
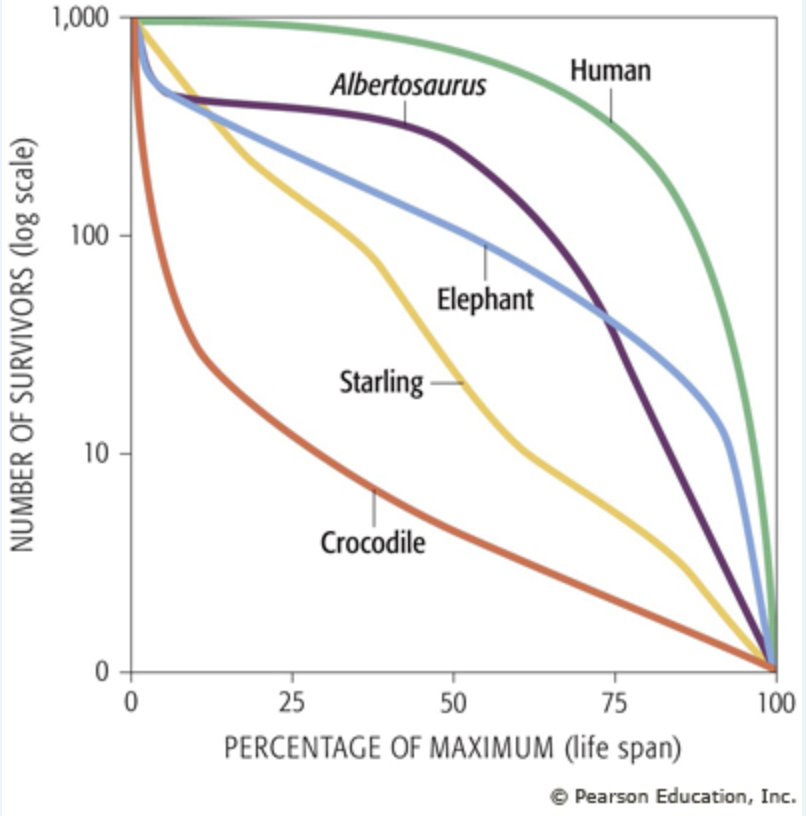
In a population of 1,000 elephants, how many individuals would survive for 50% of the species’ maximum life span?
about 100
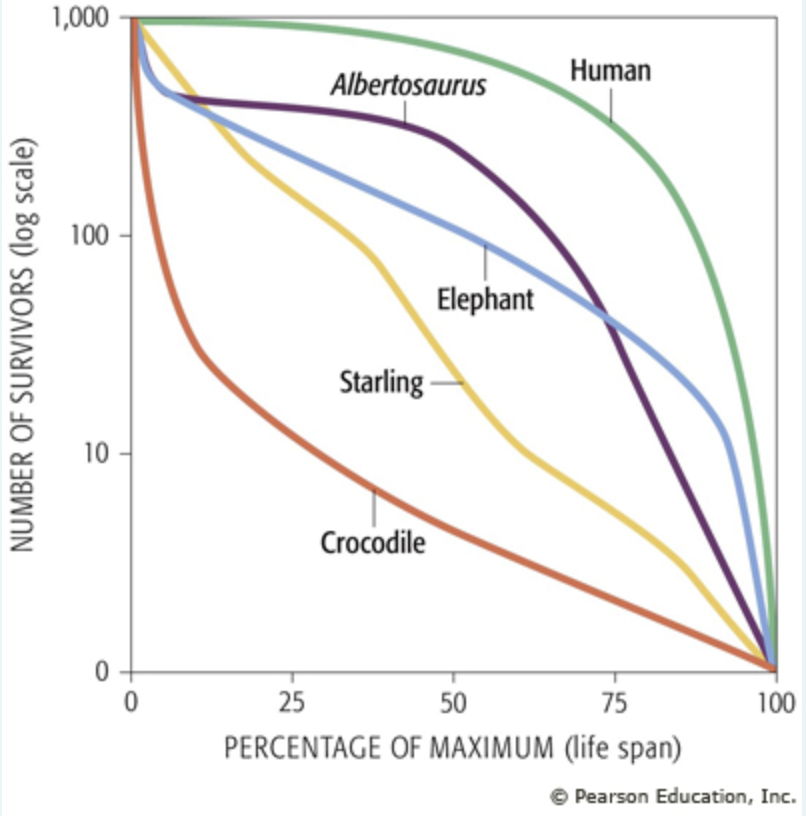
According to the graph, which modern animal has a relatively constant mortality rate throughout its life span?
starling
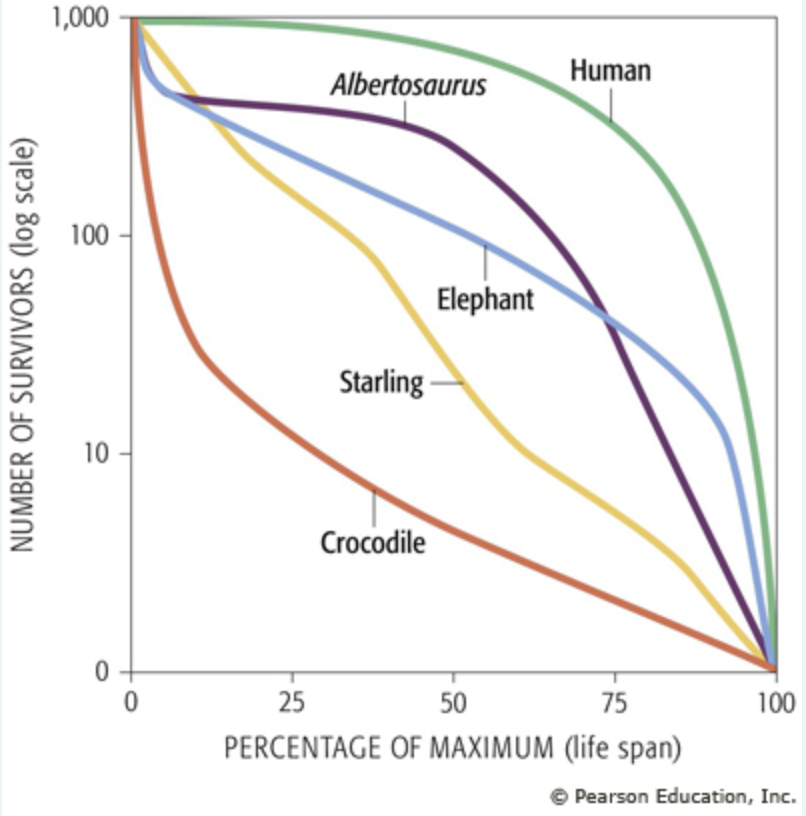
At 50% of maximum life span, how does the survivorship of Albertosaurus compare to the survivorship of the crocodile?
The survivorship of Albertosaurus is about 100 times greater than that of the crocodile.
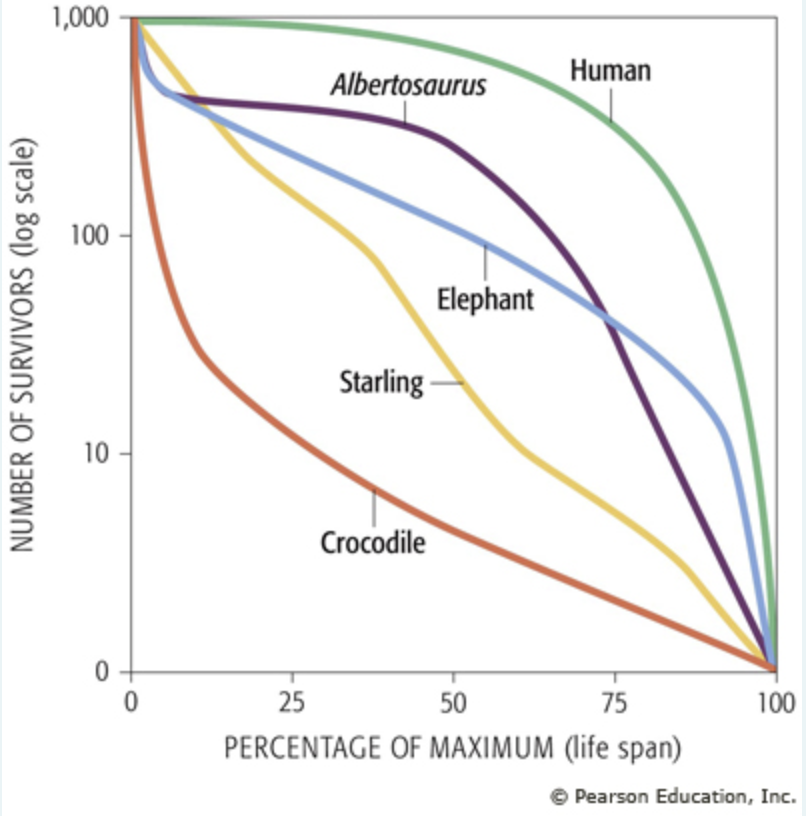
s the following statement supported or not supported by the data shown in the graph?
The maximum life span of Albertosaurus was about 100 years.
cannot be determined from this graph
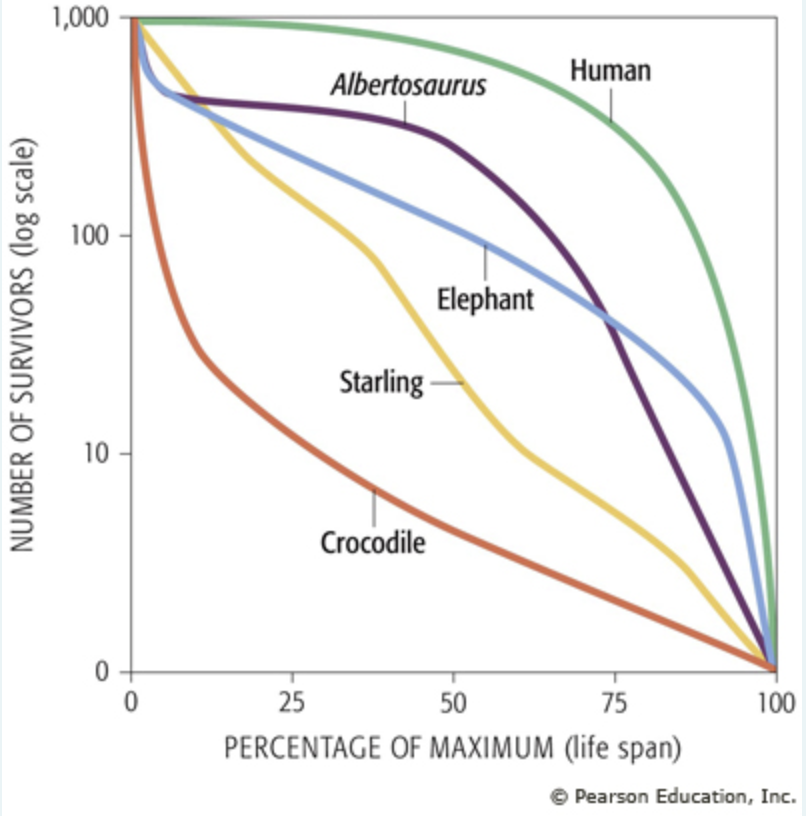
Is the following statement supported or not supported by the data shown in the graph?
The mortality rate of young Albertosaurus dinosaurs aged between 25% and 50% of their maximum life span was far greater than the mortality rate of dinosaurs that reached 75% of their maximum life span.
not supported
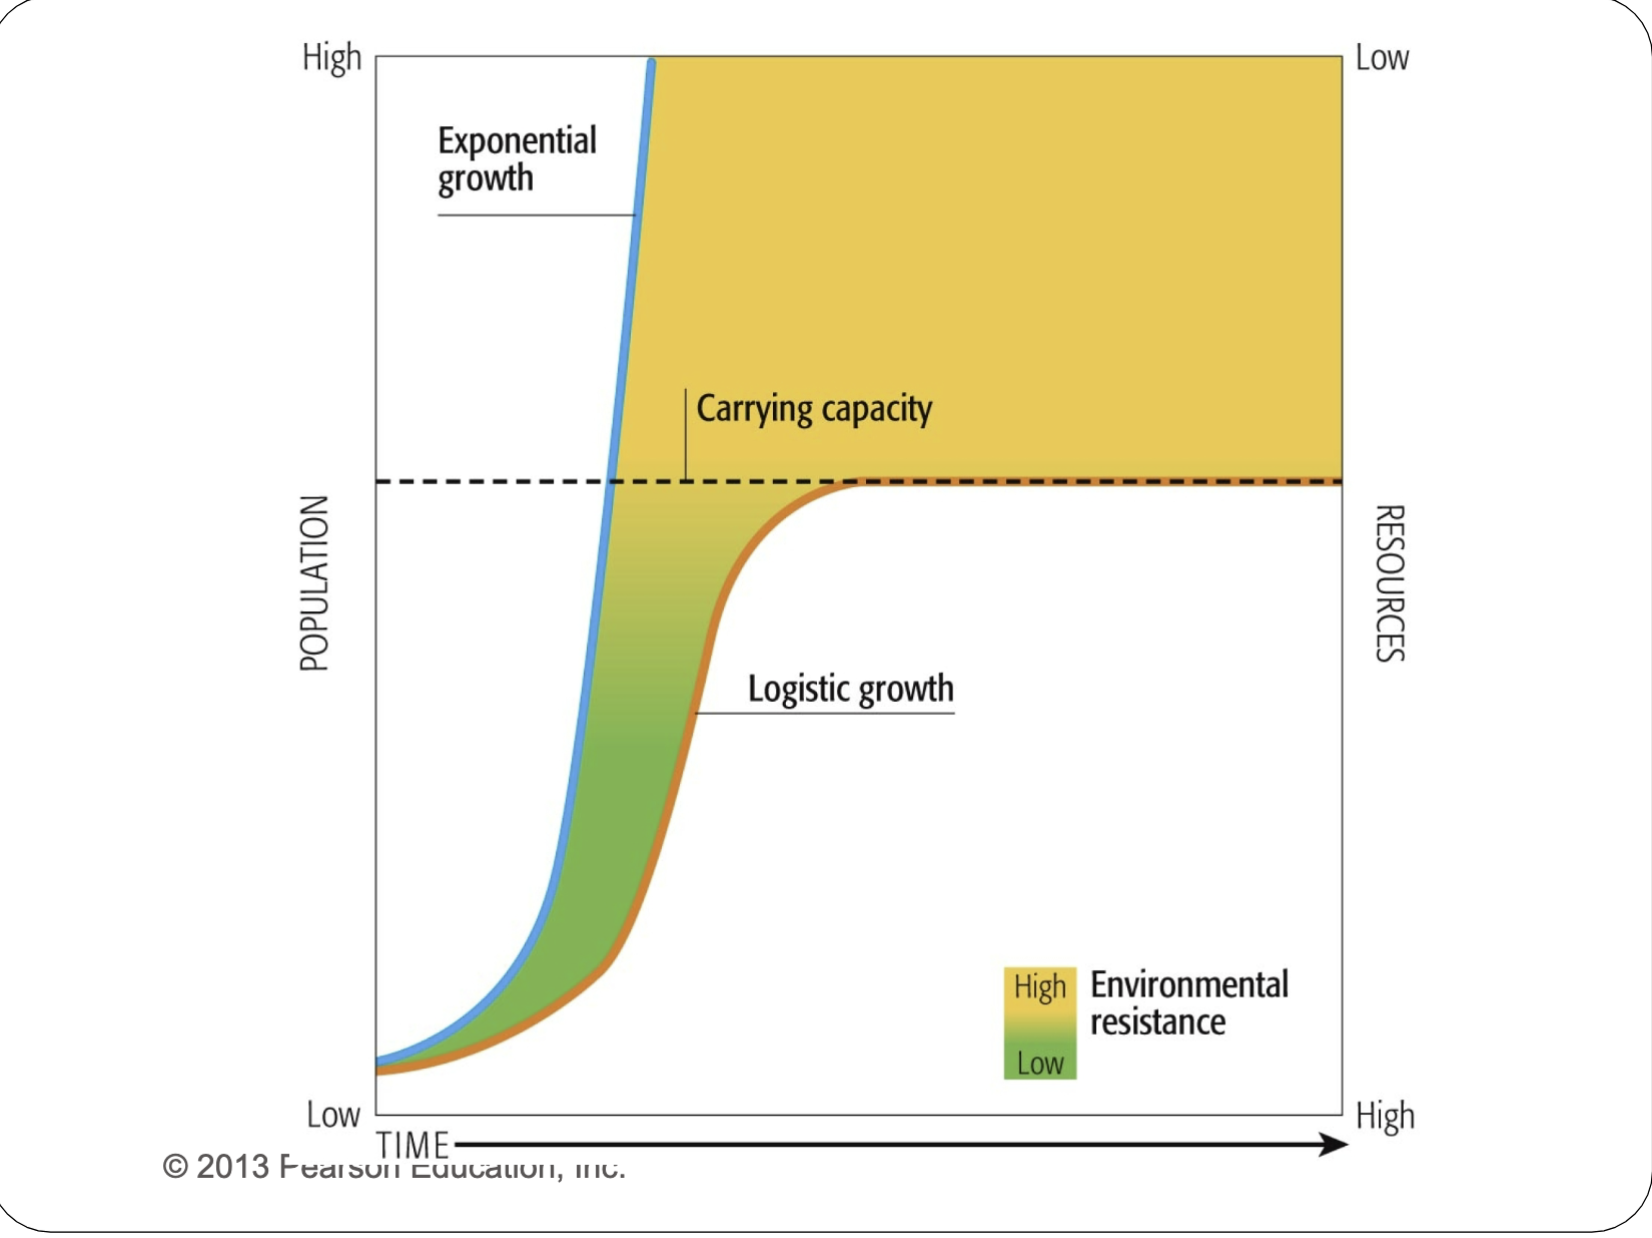
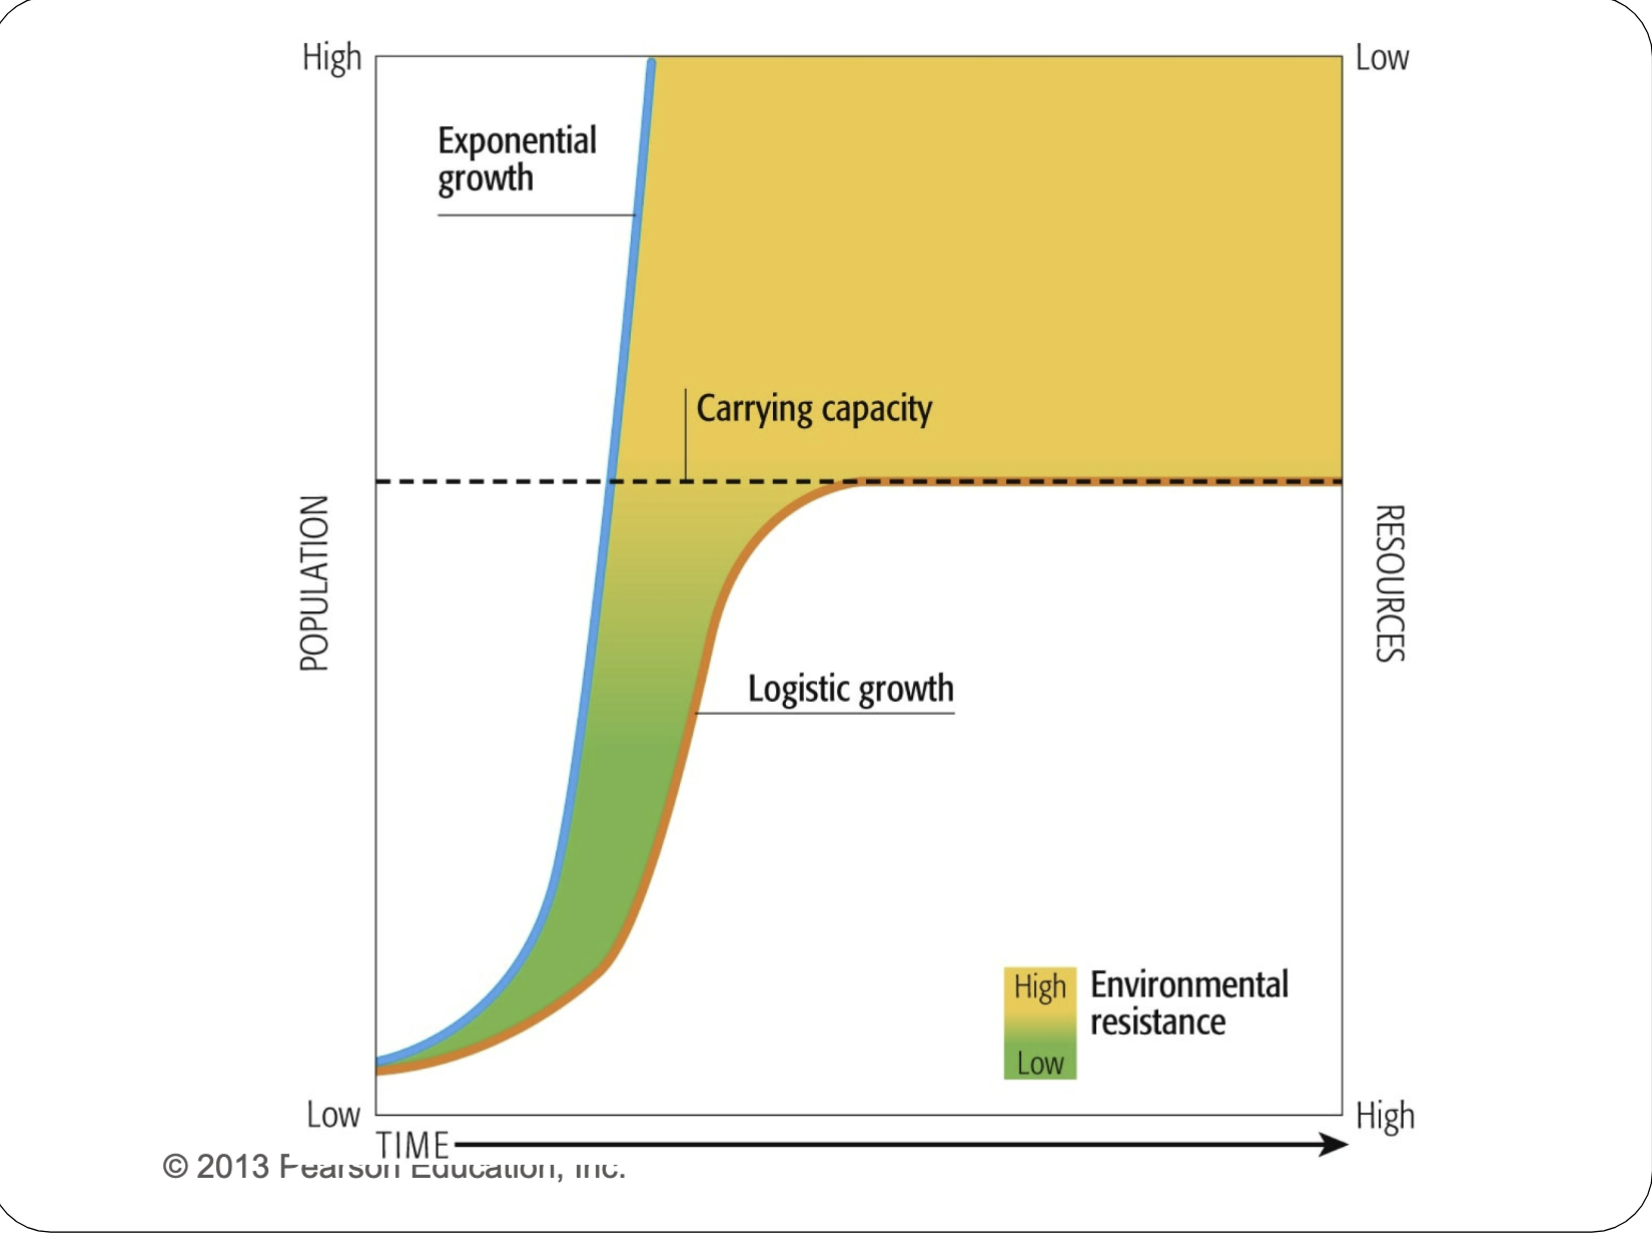
Can you interpret this graph about population growth to answer these questions?
The y-axis to the right represents ___________.
the level of resources available per capita
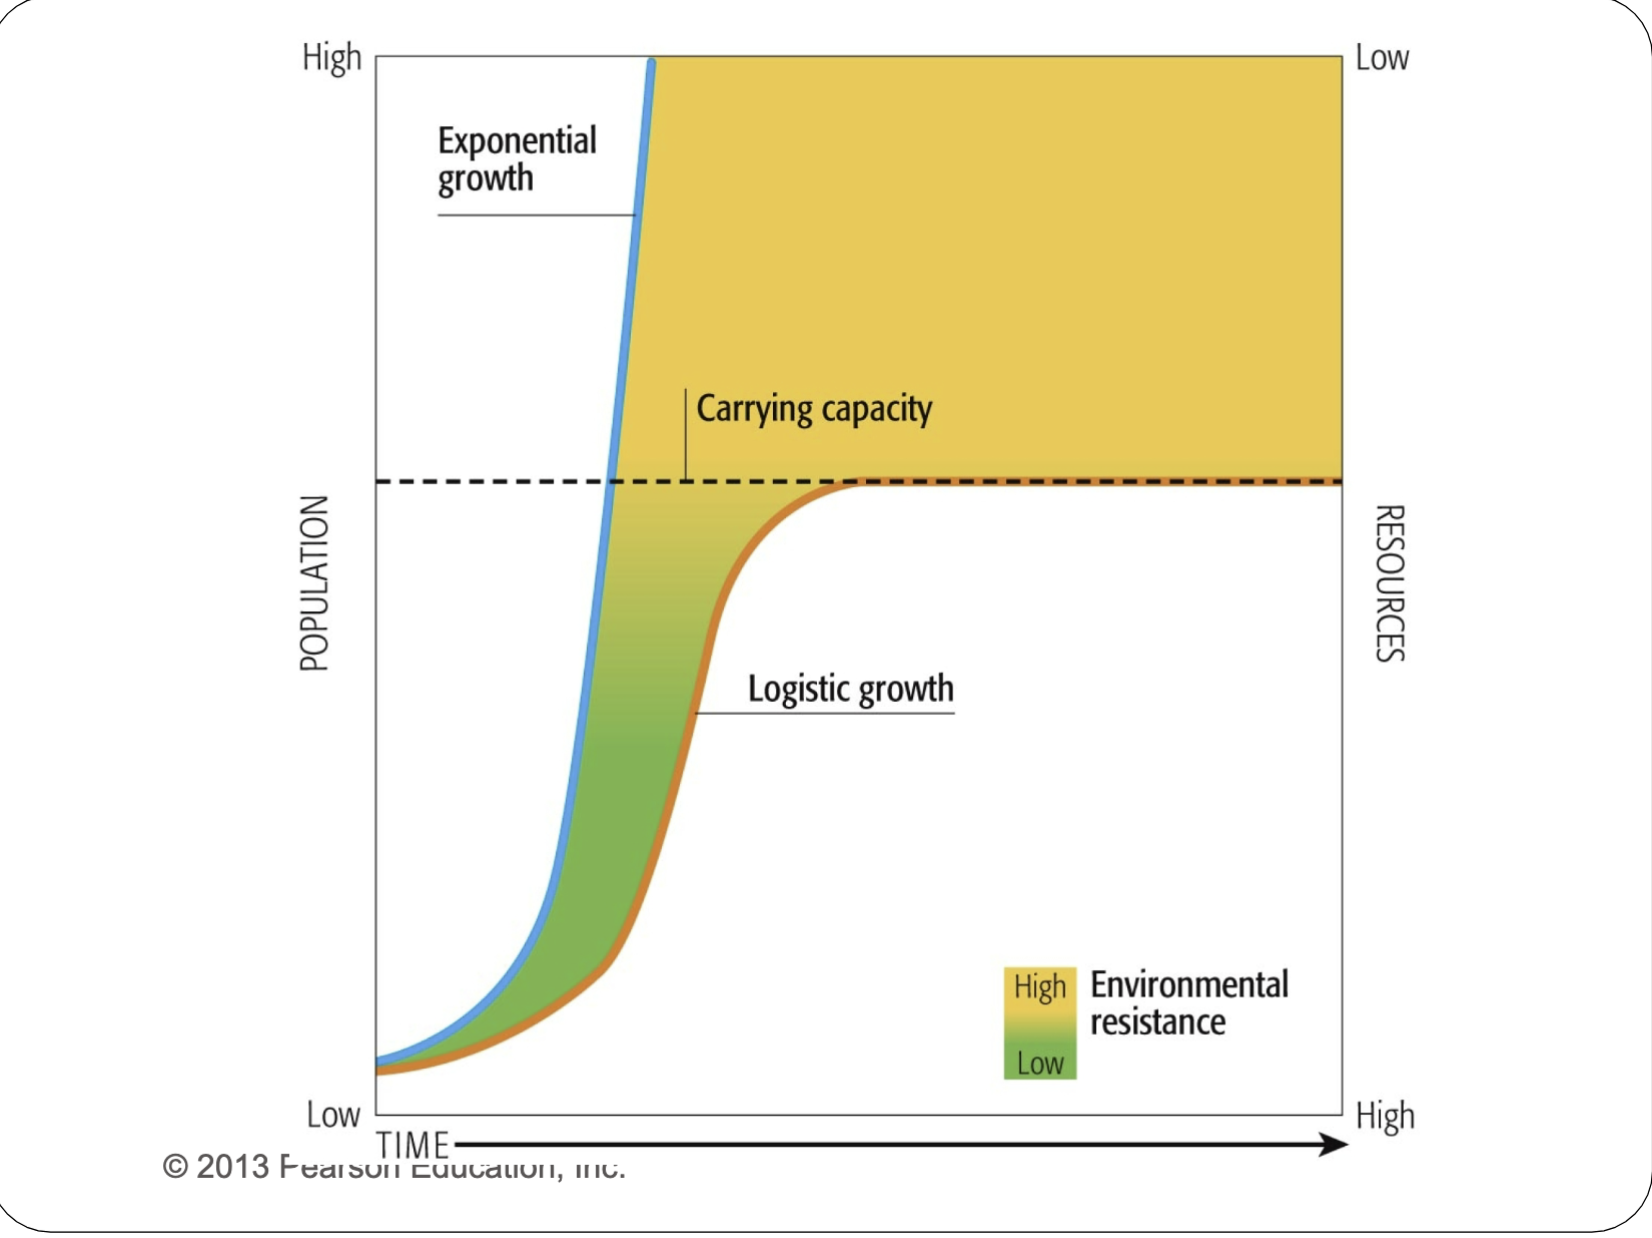
What does the orange graph line represent?
logistic growth
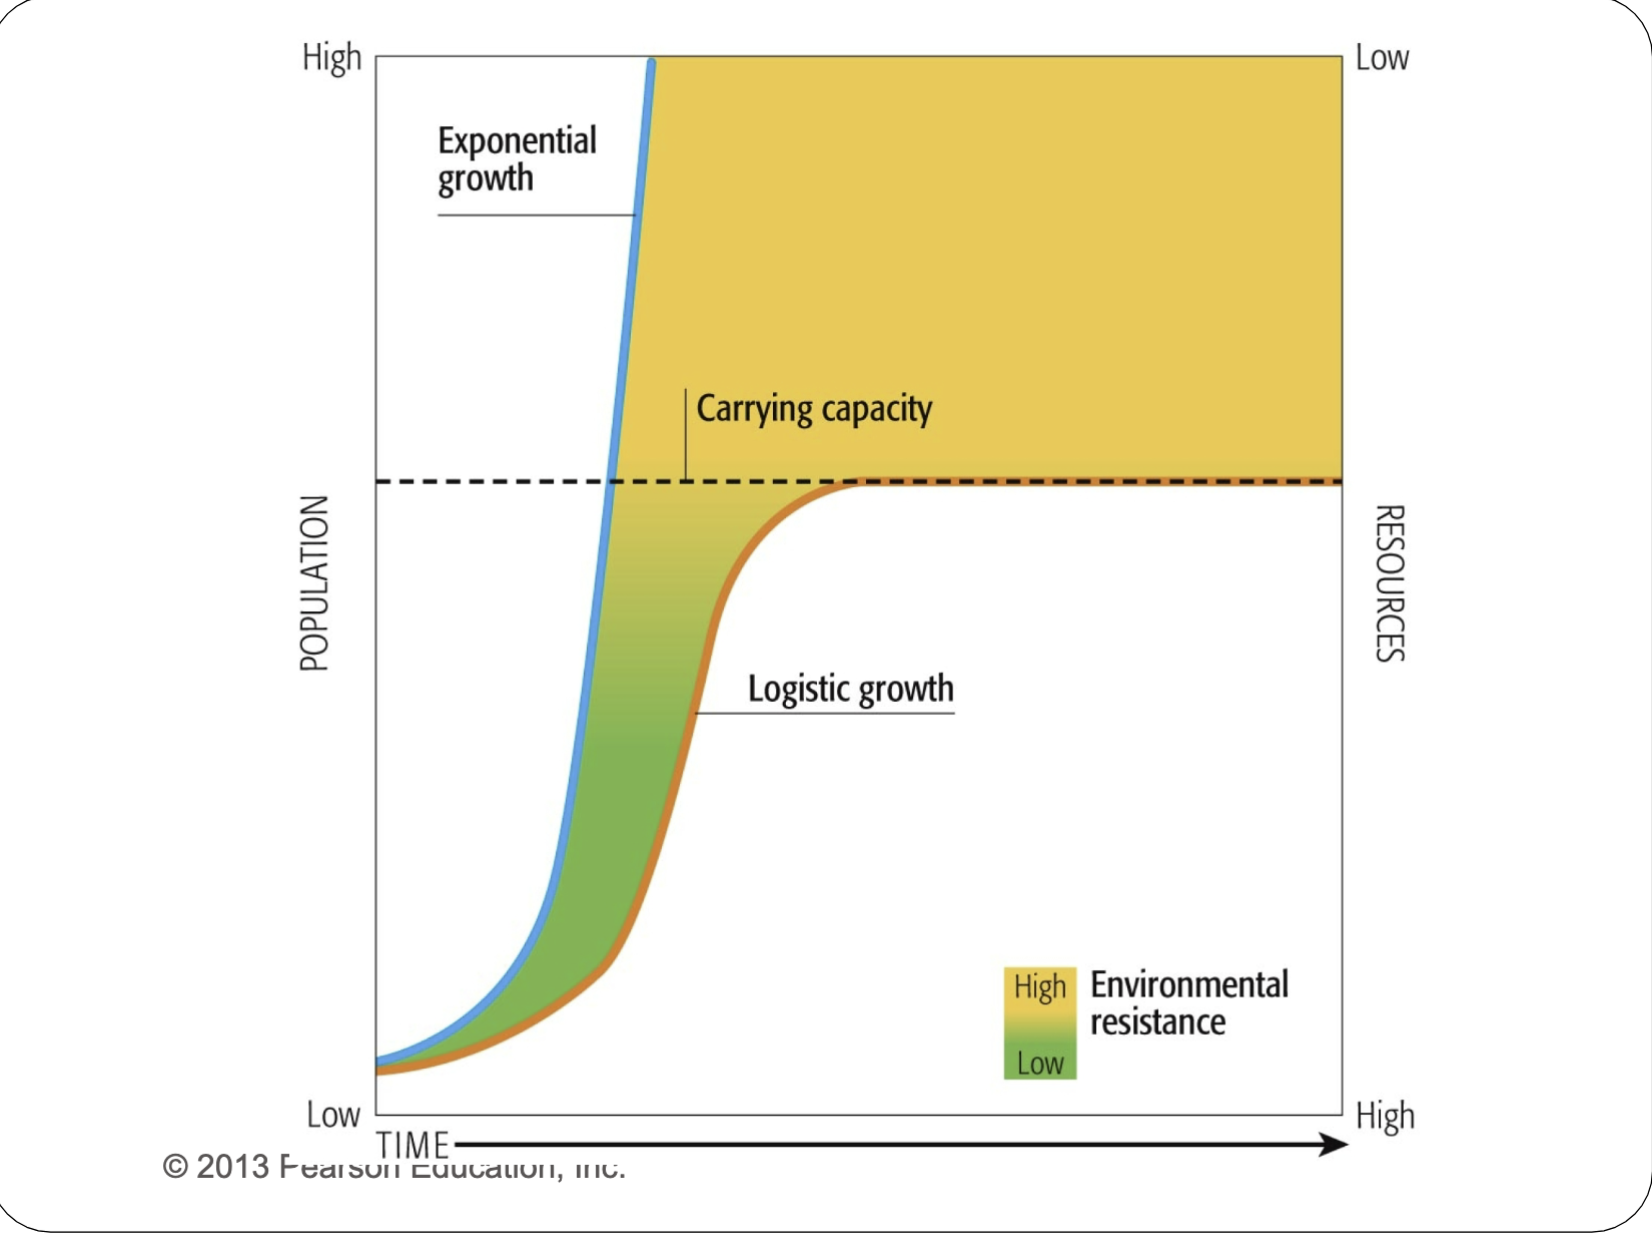
Which of the following statements is true of logistic growth?
a.) as the population approaches carrying capacity, it grows more rapidly.
b.) as the population approaches carrying capacity, it grows more slowly.
c.) the population grows at a steady rate
d.) When the population reaches carrying capacity, it stops growing
b.) as the population approaches carrying capacity, it grows more slowly.
d.) When the population reaches carrying capacity, it stops growing
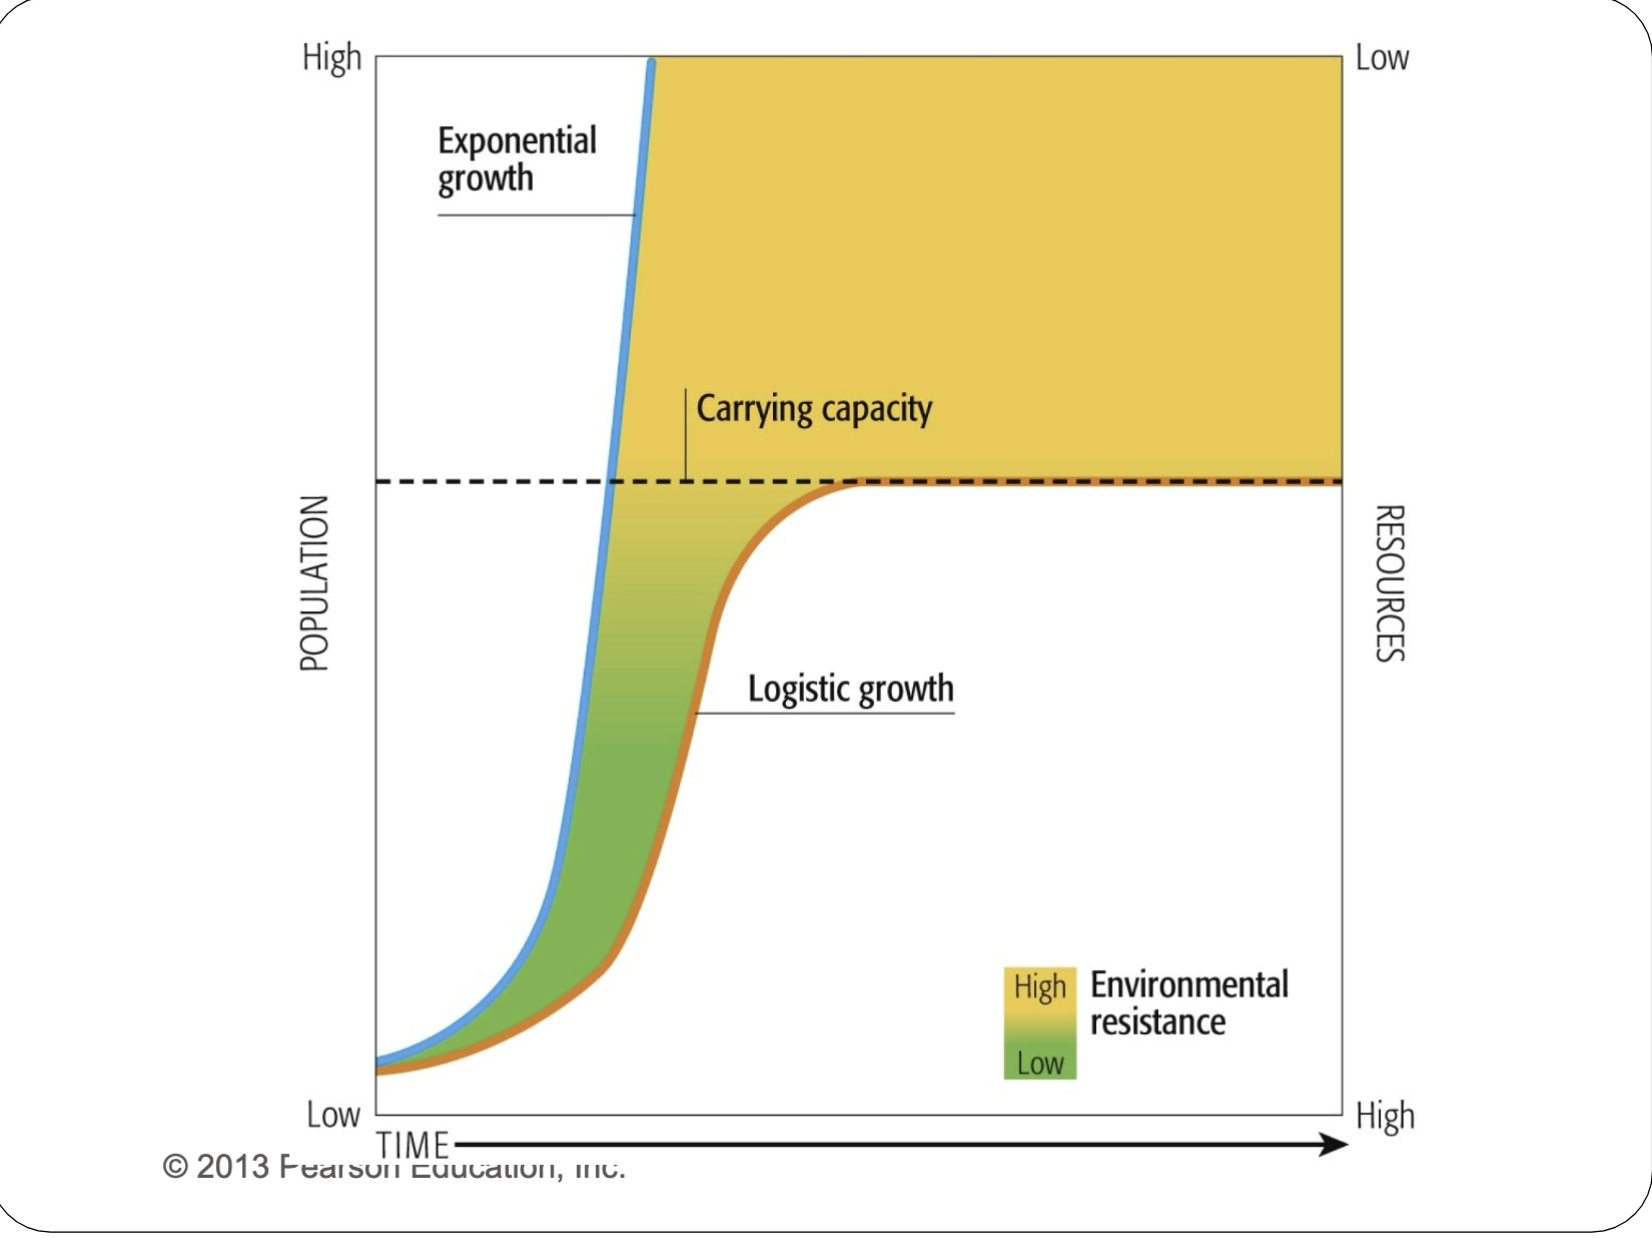
Which of the following statements are true of a population at carrying capacity?
You can select all that apply.
the population continues to grow at a constant rate
the rate at which resources are used is equal to the rate at which they are supplied
the population growth rate equals zero
the birth rate equals the death rate
the rate at which resources are used is equal to the rate at which they are supplied
the population growth rate equals zero
the birth rate equals the death rate
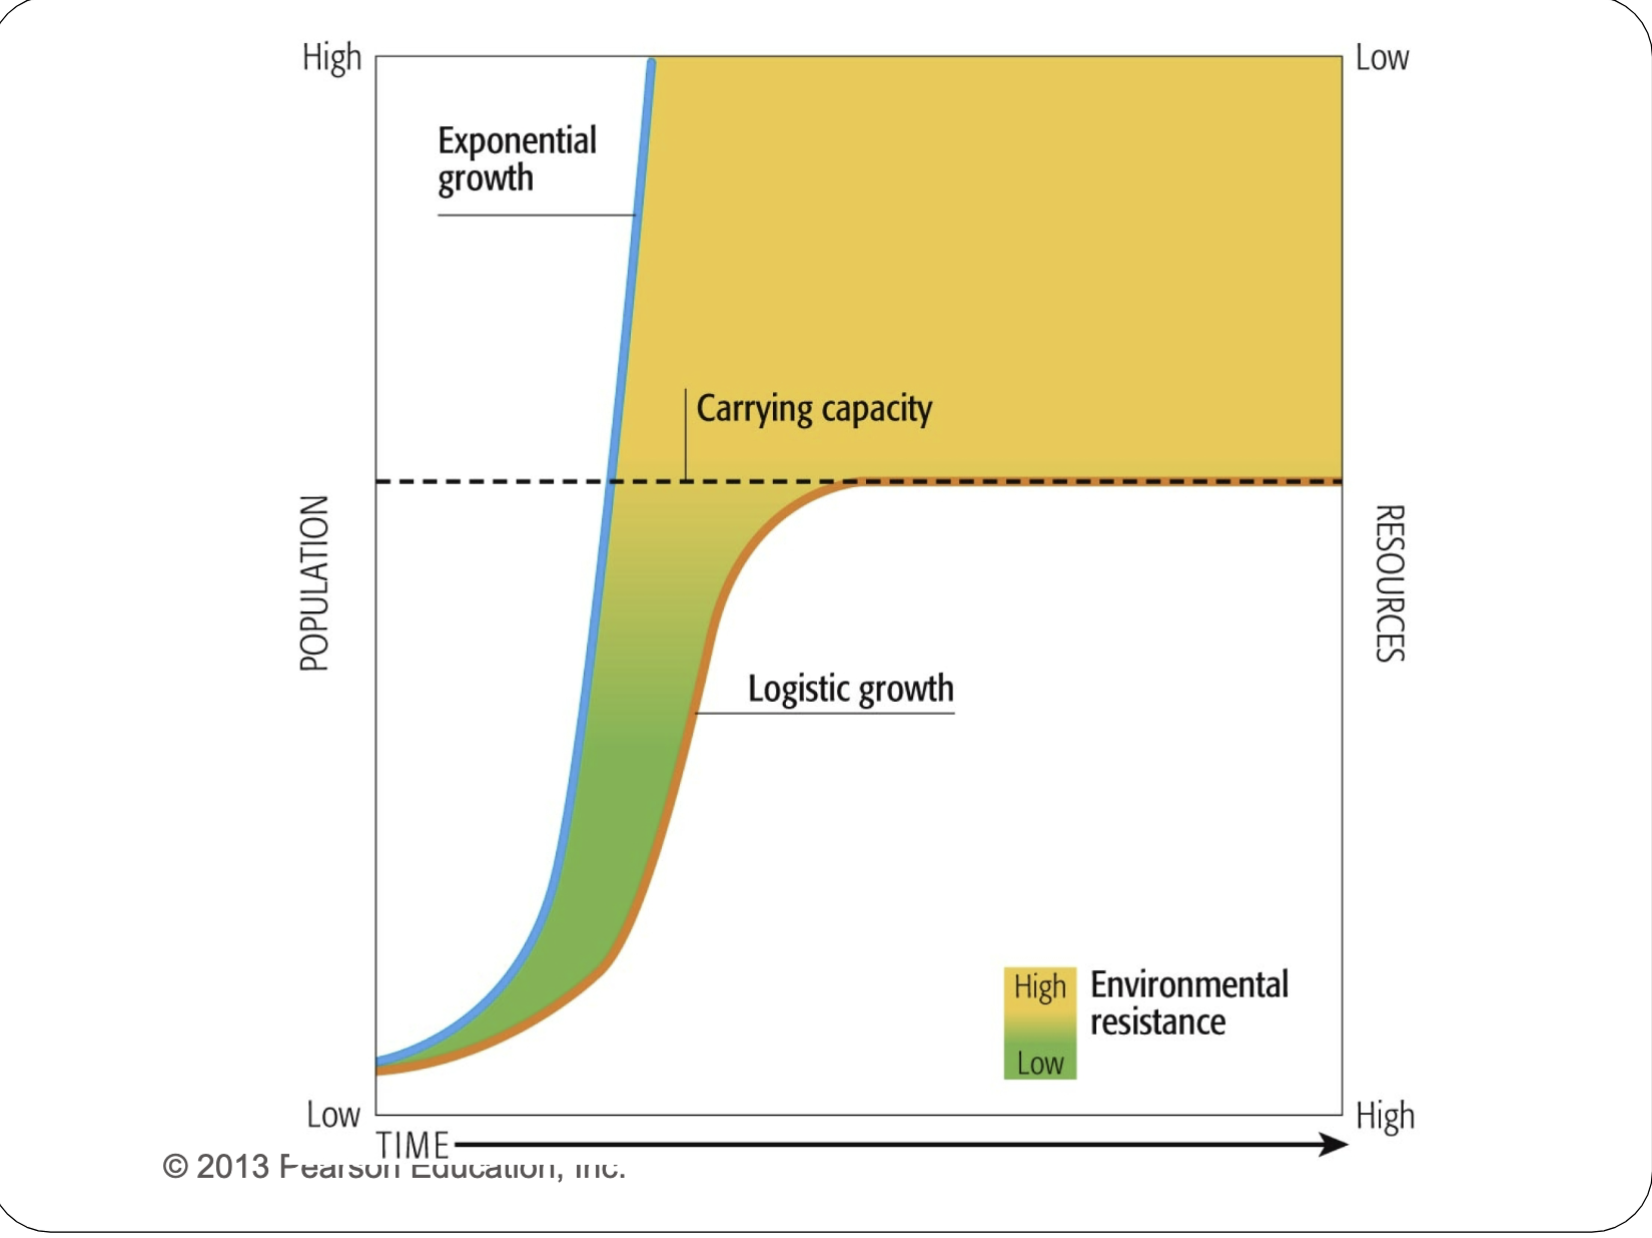
As a population approaches carrying capacity, environmental resistance __________.
increases
Which of the following factors does not contribute to environmental resistance?
a.) competition for space
b.) environmental toxins
c.) birth rate
d.) weather conditions
e.) competition for food
c.) birth rate
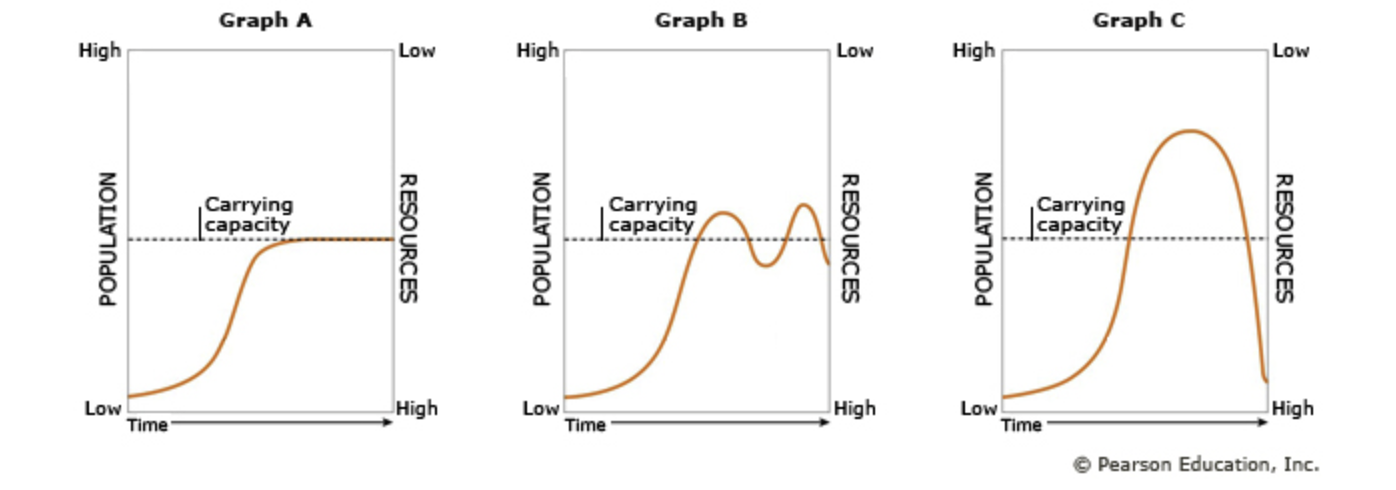
Graphs A, B, and C represent three different population growth patterns. Refer to these graphs in the following questions as you read about the populations.
A female darkling beetle laid her eggs in a sack of corn meal. The corn meal was an excellent food source for the beetle larvae (mealworms), and the beetle population quickly increased. After four months, the beetles had eaten all of the corn meal, and the adult beetles flew away to find new food sources.
Which graph best represents the growth of the beetle population in the sack of corn meal?
graph C
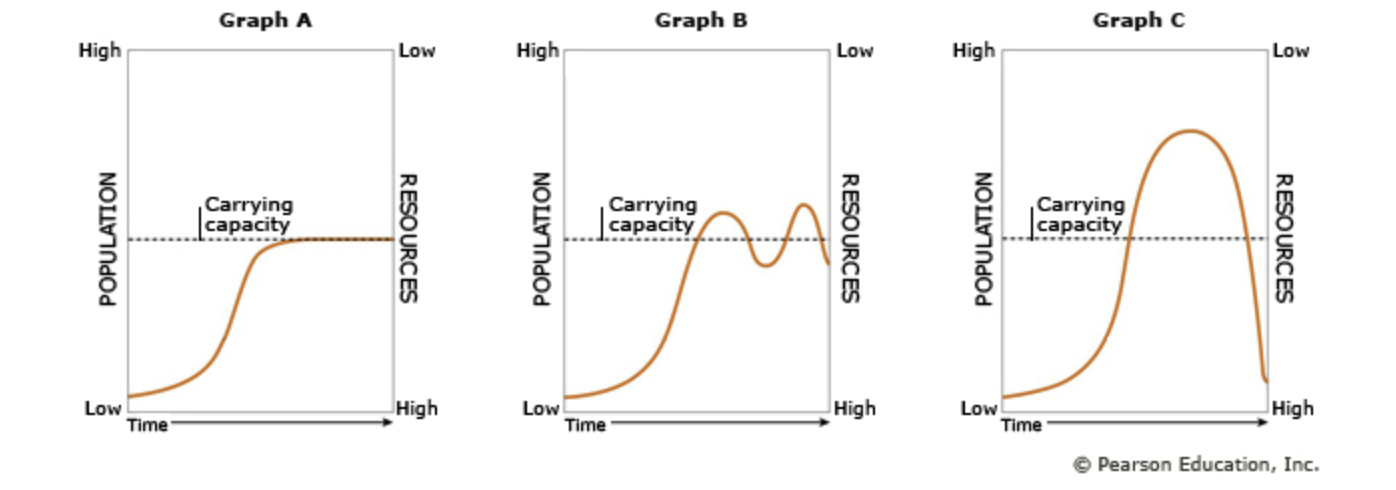
Scientists grew a population of yeast cells in a flask to which they provided a constant supply of nutrients. As the population of yeast cells increased, competition for the nutrients also increased. This caused the population to grow more slowly, until the rate at which the yeast cells used the nutrients was equal to the rate at which the nutrients were supplied to the flask.
Which of the three graphs shown in Part G best represents the growth of these yeast populations?
Graph A
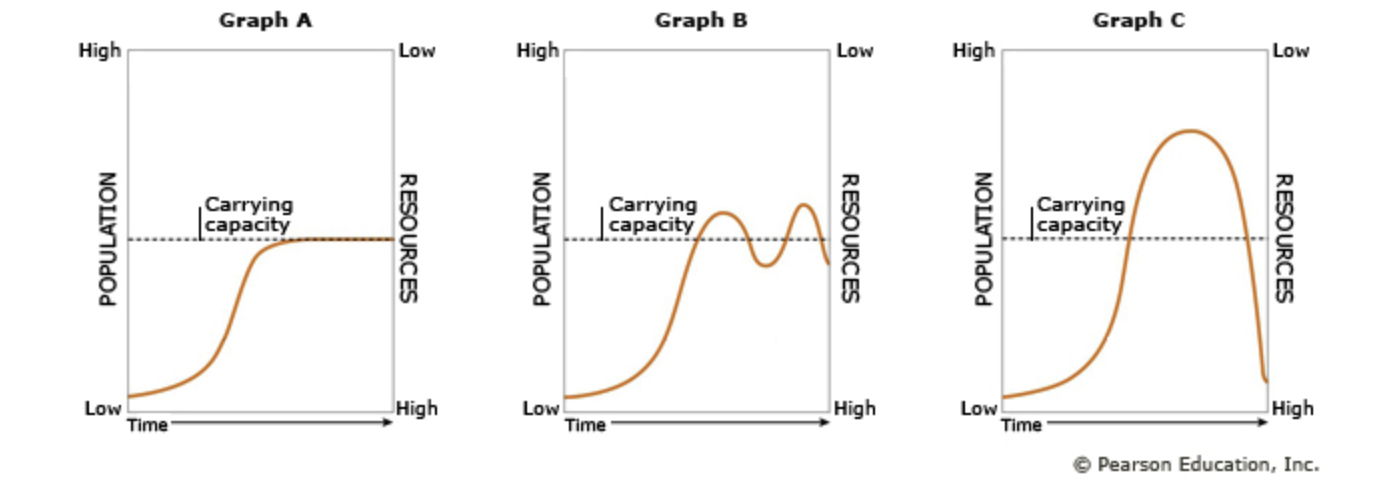
A pair of coyotes colonized a large island where rodents (their prey) were abundant. At first the number of coyotes increased. But as the coyote population increased, competition for prey also increased and the coyote population grew more slowly. In some years, weather conditions killed many of the rodents, causing some coyotes to starve. In other years, weather conditions were favorable for the rodent poulation, allowing the coyotes to thrive, reproduce, and raise many pups.
Which of the three graphs shown in Part G best represents the growth of this coyote population?
Graph B