2: Descriptive Statistics in Interpreting Participants' Profiles

0.0(0)
studied byStudied by 0 people
GameKnowt Play
learnLearn
examPractice Test
spaced repetitionSpaced Repetition
heart puzzleMatch
flashcardsFlashcards
Card Sorting

1/7

flashcard set

Earn XP

Description and Tags

Prelim Topic

Study Analytics
Name
Mastery
Learn
Test
Matching
Spaced

No study sessions yet.

8 Terms

1
New cards

Descriptive Statistics

Helps us summarize and describe data so we can understand what’s gong on before diving into more complex analysis. Think of them as the “first look” at your data!

2
New cards

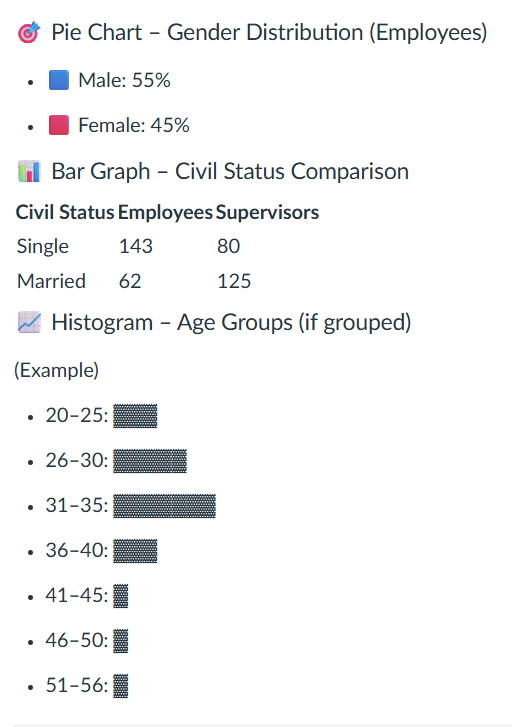
APA: A total of 205 Employees participated (55% male, 45% female). Most supervisors were male (n = 125, 60%)

Gender of Participants

  • Employees: 112 male (55%) | 93 female (45%)

  • Supervisors: 125 male (60%) | 80 female (40%)

3
New cards

APA: The mean age of participants was 32.00 years (SD = 5.80), while the mean age of their supervisors was 42.00 years (SD = 4.30)

Age of Participants

  • Employees: Average (mean) = 32 years | Range = 21 to 56

  • Supervisors: Average (mean) = 42 years | Range = 30 to 55

4
New cards

APA: A majority of participants were single (70%), while most supervisors were married (60%).

Civil Status

  • Employees: 70% single (n = 143), 30% married (n = 62)

  • Supervisors: 60% married (n = 125), 40% single (n = 80)

5
New cards

Visualizing the Data

You can make your findings more engaging by creating simple charts

<p>You can make your findings more engaging by creating simple charts</p>
6
New cards

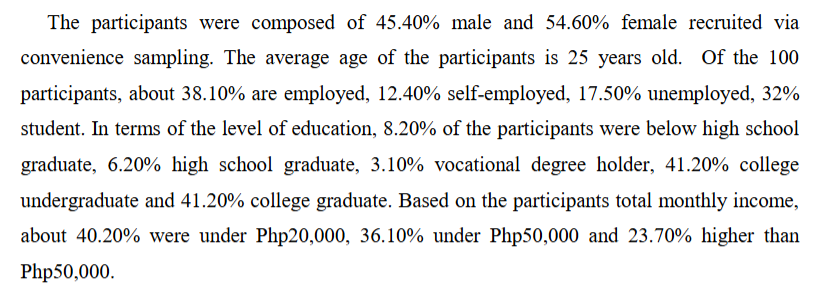
APA: Most Participants were female (54.6%) with an average age of 25 years. The majority were either employed (38.1%) or students (32%).

  • Gender

    45.4% Male, 54.6% Female (N = 100)

  • Average Age

    M = 25 years old

  • Employment Status

    38.1% employed, 32% student, 17.5% unemployed, 12.4% self-employed

  • Educational Attainment

    41.2% college graduates, 41.2% undergraduates, others less than 10%

  • Monthly Household Income

    40.2% earned below PHP 20,000

<ul><li><p><strong>Gender</strong></p><figure data-type="blockquoteFigure"><div><blockquote><p>45.4% Male, 54.6% Female (N = 100)</p></blockquote><figcaption></figcaption></div></figure></li><li><p><strong>Average Age</strong></p><figure data-type="blockquoteFigure"><div><blockquote><p>M = 25 years old</p></blockquote><figcaption></figcaption></div></figure></li><li><p><strong>Employment Status</strong></p><figure data-type="blockquoteFigure"><div><blockquote><p>38.1% employed, 32% student, 17.5% unemployed, 12.4% self-employed</p></blockquote><figcaption></figcaption></div></figure></li><li><p><strong>Educational Attainment</strong></p><figure data-type="blockquoteFigure"><div><blockquote><p>41.2% college graduates, 41.2% undergraduates, others less than 10%</p></blockquote><figcaption></figcaption></div></figure></li><li><p><strong>Monthly Household Income</strong></p><figure data-type="blockquoteFigure"><div><blockquote><p>40.2% earned below PHP 20,000</p></blockquote><figcaption></figcaption></div></figure></li></ul><p></p>
7
New cards

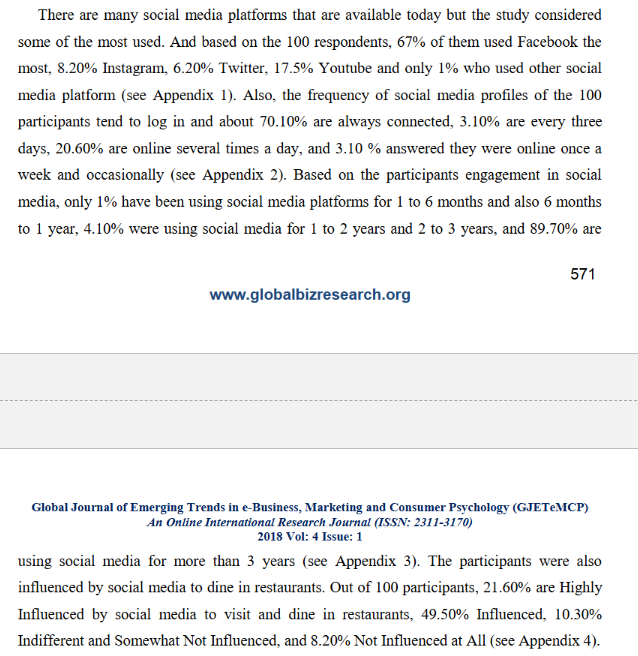
APA: The majority of participants (70.1%) reported being always connected online. and 89.7% had used social media for more than three years.

  • Most Used Platform:

    67% used Facebook, followed by YouTube (17.5%), Instagram (8.2%)

  • How Often They Go Online:

    70.1% were always connected, 20.6% were online several times a day

  • How Long They've Used Social Media:

    89.7% had used social media for more than 3 years

<ul><li><p><strong>Most Used Platform:</strong></p><figure data-type="blockquoteFigure"><div><blockquote><p>67% used Facebook, followed by YouTube (17.5%), Instagram (8.2%)</p></blockquote><figcaption></figcaption></div></figure></li><li><p><strong>How Often They Go Online:</strong></p><figure data-type="blockquoteFigure"><div><blockquote><p>70.1% were <em>always connected</em>, 20.6% were online <em>several times a day</em></p></blockquote><figcaption></figcaption></div></figure></li><li><p><strong>How Long They've Used Social Media:</strong></p><figure data-type="blockquoteFigure"><div><blockquote><p>89.7% had used social media for more than 3 years</p></blockquote><figcaption></figcaption></div></figure></li></ul><p></p>
8
New cards

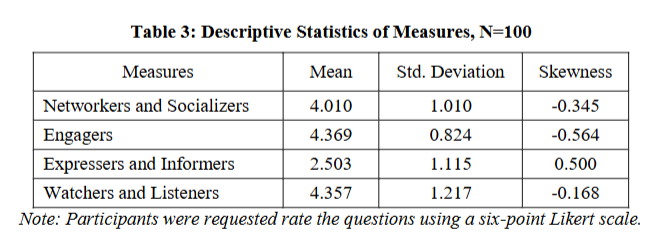
APA: Participants identified as “Engagers” had the highest mean score (M = 4.37, SD = 0.82), while “Expressers and Informers” had the lowest (M = 2.50, SD = 1.12).

Using mean (M) and standard deviation (SD), the researchers measured how strongly people scored in each type of online behavior:

<p><span>Using </span><strong>mean (M)</strong><span> and </span><strong>standard deviation (SD)</strong><span>, the researchers measured how strongly people scored in each type of online behavior:</span></p>