Geography year 7 summer
1/13
There's no tags or description
Looks like no tags are added yet.
Name | Mastery | Learn | Test | Matching | Spaced |
|---|
No study sessions yet.
14 Terms
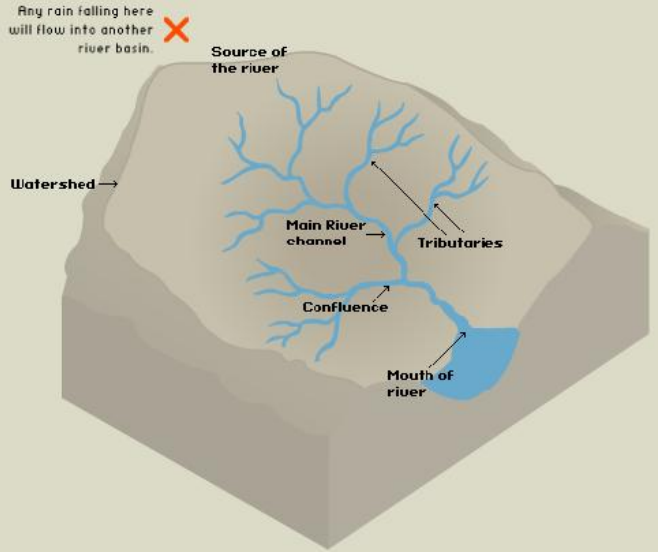
watershed, main river channel, tributaries, confluence, moth of river.
what are the features of a drainage basin
A diagram showing the upper, middle and the lower course, the upper course is steep. The middle course is less steep than the upper course and the water slows down. The lower course shows a gentle slope.
what is a river long profile
Erosion is the breaking down of rocks. Attrition, hydraulic action, solution and abration. Transportation is when the river picks up materials and carries it along the stream. Deposition is when the river slows down it will most likely happen after a flood
describe the 3 river processes
Heavy rainfall and rapid snowmelt
what are the physical causes of flooding
deforestation, building roads it reduces infiltration, humans farm and change the natural vegetation.
what are some human causes of flooding
it is chosen based on where the sources are. If they are close to a river. Flat land to grow crops and a steep hill to be able to easily defend.
explain why the site for a settlement is chosen
A settlement might change depending on the population of people and animals. How the river changes shape.
Describe how a settlement might change
A setlement will only grow over time if it has space. For setlements you would ned to make sure you have enough space to grow that is why your location is important. You need good functions to be able to increase the population otherwise no one will want to come to your setlement
expalin how location and function influance the growth of a setlement
Choropleth maps show geographical information by showing how many of something there are. For example the population of honey bees
how do choropleth maps show geographical information
contour lines show the hills and mountains. if the lines are close together than it is steep if they are far away from each other it shallow
what are contour lines
used to show continues changes over time
what is a line graph
it uses parentages. It uses labels so you know what it is.
what is a pie chart
used to compare different categories. It must always have one space between each bar
what is a bar chart
has both line and bar chart. You use this for similar things like temp and rainfall.
what is a combined chart