Ch 13: The Normal Distribution
1/16
There's no tags or description
Looks like no tags are added yet.
Name | Mastery | Learn | Test | Matching | Spaced | Call with Kai |
|---|
No analytics yet
Send a link to your students to track their progress
17 Terms
density curves
shows the frequency of observations at each point
shape of a normal density curve
single peak
bell shape
approximately symmetrical
central unit theorem
more observations w/ SRS → distribution looks “normal”
what’s the difference between histograms and density curves?
histograms show the shape of the sample, but the density curves “smooth” it out and create the more ideal shape that we would likely see in the population
what is variability represented by?
standard deviation
how can you identify standard deviation by looking at a graph?
by looking at the slope of the curve or the inflection point
what happens if we change the mean of the distribution?
the shape of the distribution will be unchanged; the curve will simply shift to the left or right
what happens if we change the standard deviation of the distribution?
smaller SD → less variability and more sharply peaked
larger SD → higher variability and less sharply peaked
68% rule
68% of observations fall within ±1 standard deviation on either said of the mean
95%
95% of observations fall within ±2 standard deviations on either side of the mean
99.7%
99.7% of observations fall within ±3 standard deviations on either side of the mean
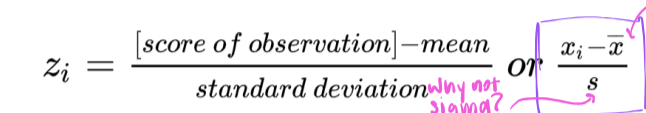
z-score
standard score/standard deviation units
positive z-score
the observations is above the mean
negative z-score
below the mean
how can we use standard score
to compare how well each individual score relative to the norms for their respective tests
the cth percentile
a value such that c% of the observations lie below it and the rest lie above it
each standard score has a specific percentile
this percentile will be the same no matter what the mean and standard deviation of the original distribution are