Measures of Variability
1/22
There's no tags or description
Looks like no tags are added yet.
Name | Mastery | Learn | Test | Matching | Spaced |
|---|
No study sessions yet.
23 Terms
Variability Def
a measure of how “close together” or “far apart” scores are in a data set
range def
the difference between the largest and smallest values in a data set
range formula
range = MAX-MIN
variance def
a measure of spread relative to the scatter of score values about their mean
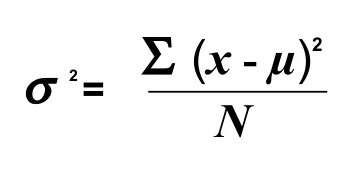
Population variance formula
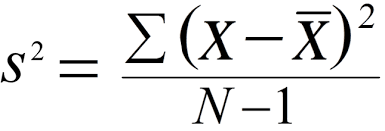
sample variance formula
Steps for calculating the same variance (5)
calculate the mean of the dataset
calculate the deviation of every score value from the mean
square all of the deviations
add all of the squared deviations
divide by n-1
Sample variance example
do iiiiittttt
standard deviation def
the square root of the variance
standard deviation example
you got it
first quartile formula
n +1/4
2nd quartile formula
2(n+1)/4
3rd quartile formula
3(n+1)/4
3 quartiles example
yep.. all three
box plot definition
a numerical summary of data consisting of the Min, max and all 3 quartiles
box plot example
do it
Innerquartile range def
the difference between the third and first quartile values
Innerquartile range formula
IQR = Q3- Q1
IQR example
yes ma’am you heard me
Advantage of the IQR
it is superior to the traditional range because it only looks at the variability of the middle 50% of the observations and is therefore less sensitive to extreme outliers
Outlier def
an observation whose value, X, either exceeds the value of the 3rd Quartile by a magnitude greater than 1.5IQR or is less than the value of the 1st quartile by a magnitude greater than 1.5IQR
Finding outlier example
yes, both high and low