Data Analysis and Modeling Distributions
 Call Kai
 Learn
Learn Practice Test
 Spaced Repetition
 Match
Match Flashcards
 Knowt Play
1/31

There's no tags or description
Looks like no tags are added yet.
Name | Mastery | Learn | Test | Matching | Spaced | Call with Kai | Chat |
|---|
No analytics yet
Send a link to your students to track their progress
32 Terms
What do we need to include in our graphs?
title
labeled axes
consistent scale
graphs MUST stand alone (they can be explained without background knowledge)
What are the three types of distribution shape?
roughly/fairly symmetrical
skewed to the right
skewed to the left
distribution with ONE bump
unimodal

distribution with TWO bumps
bimodal
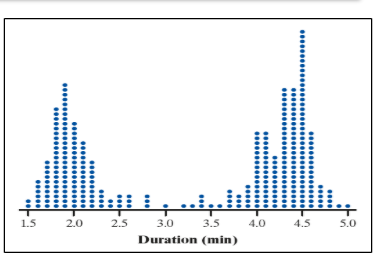
distribution with THREE bumps
trimodal
uniform distribution
where the frequency for all values is the same (aka approximately symmetric)

what are the three measures of center (averages)?
mean
median
mode
mode
the number that occurs the most
Ex. 4455558888888899
the mode is 8
median
value where 50% of the values are above it and 50% are below it
Ex. 55688 → the median is 6
Ex. 55567888 → add up the two middle numbers together and divide by two (get the average) to get the median → (6+7)/2 = 13/2 = median
mean
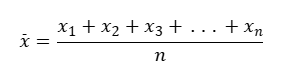
all the numbers added up divided by the total number of trials/categories there are
expressed as x̄ (x-bar)
what is the distribution of a variable?
the values taken by a variable and how many times those values occur
what do we need to describe the distribution of a variable?
context
variable name and units
complete sentences
NO BULLETED SENTENCES
SOCS
shape
outliers
center
spread
Dot plot

Stem plot
organize the data from least to greatest
ALWAYS CREATE A KEY (ex. 6|9 = 69,000 units, 7|1 = 71 apples)
ALWAYS do from least to greatest
you can also split between the upper half of a ten and the lower half
Ex. 1 | 589
1 | 014

Boxplots
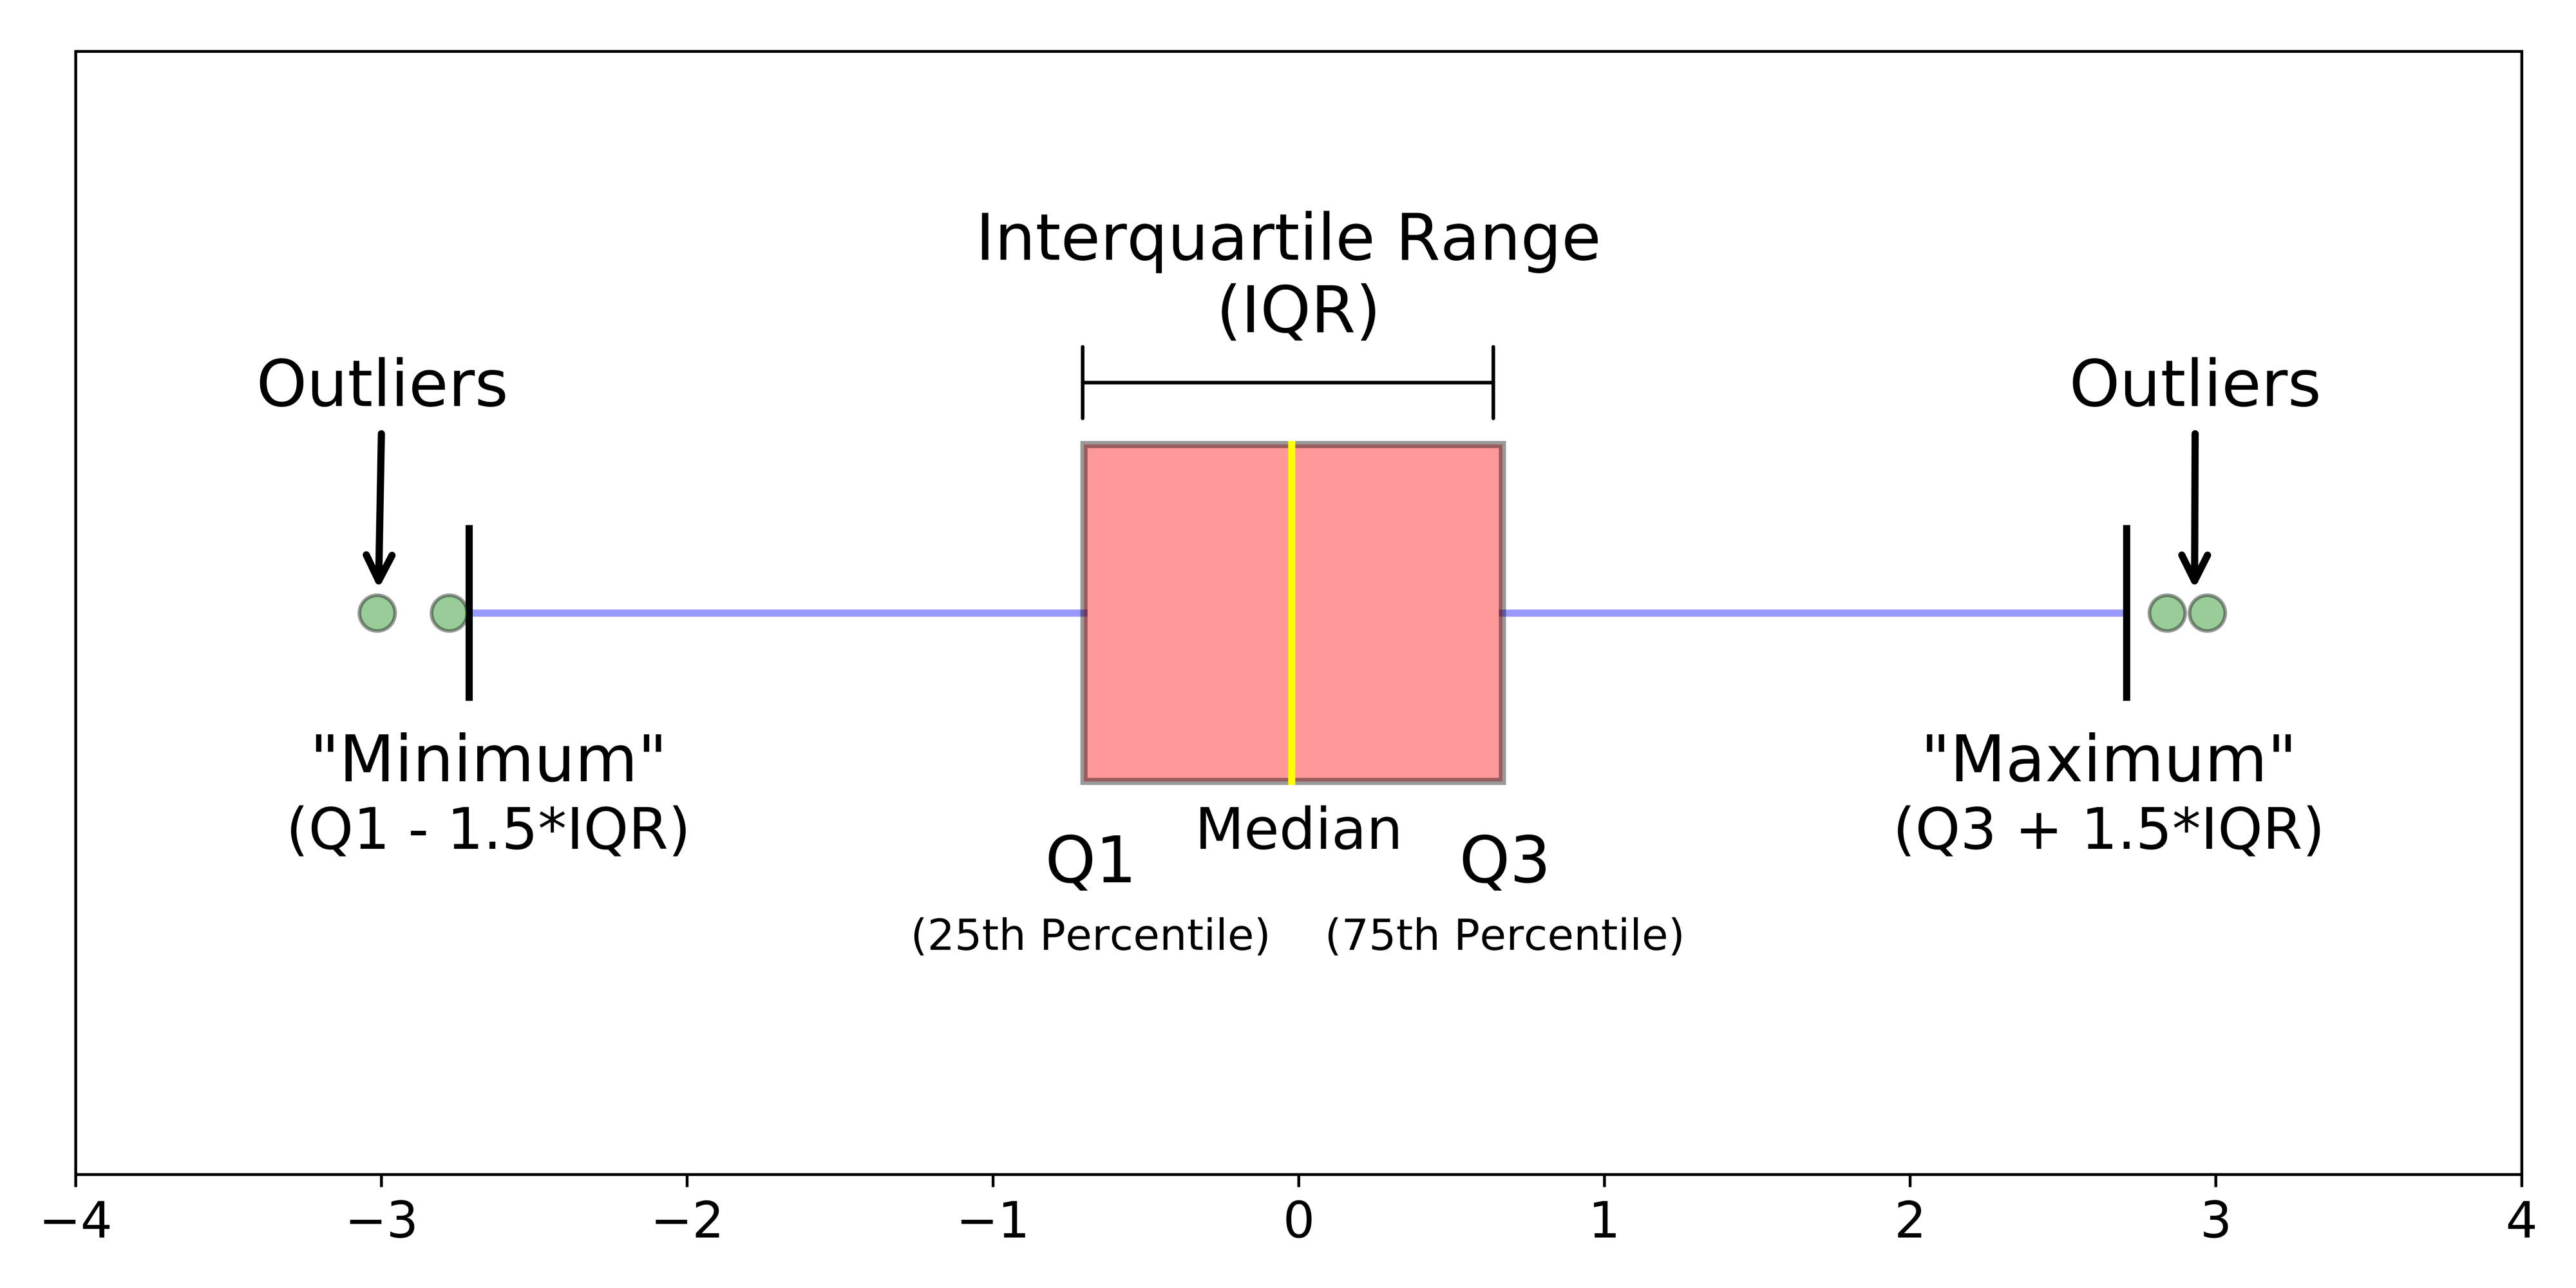
use the calculator to find the Min, Q1, Median, Q3, and the max by entering all the values into one column and using one variable statistics
statistical advantage
using a random process to select a sample and generalize
what do statistically significant results allow us to see?
a cause and effect relationship between the explanatory and response variables. this is only possible if we have a well designed experiment that contains Randomization, Replication, and Control
Bar graphs
we use proportions (decimals/fractions)
contains the bar graph, segment graph, and mosaic graph
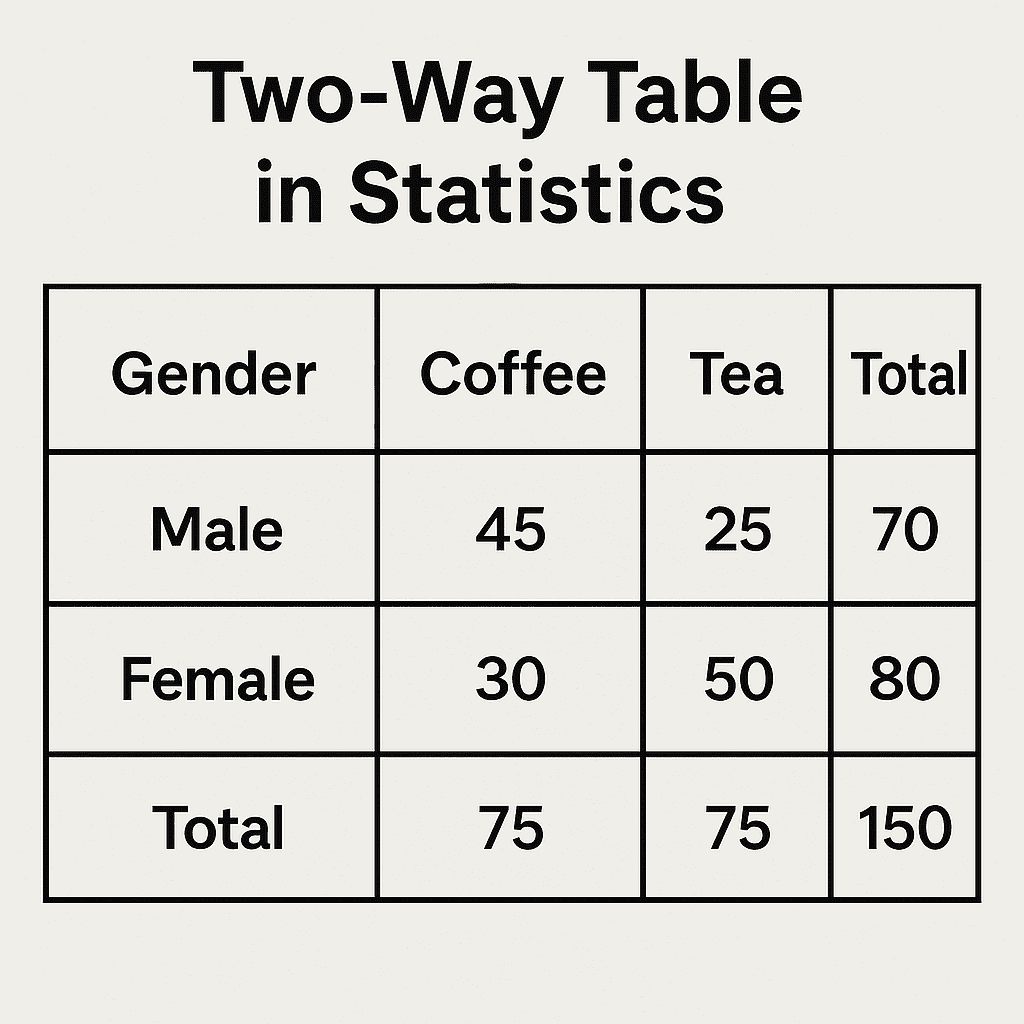
two way table
table of counts that summarizes data on the relationship of two categorical variables
marginal totals
the sums of rows and the sums of columns for two way tables
joint relative frequency
gives the proportion of individuals that have a specific value for one categorical value and another
answers questions involving both variables
cell total/grand total

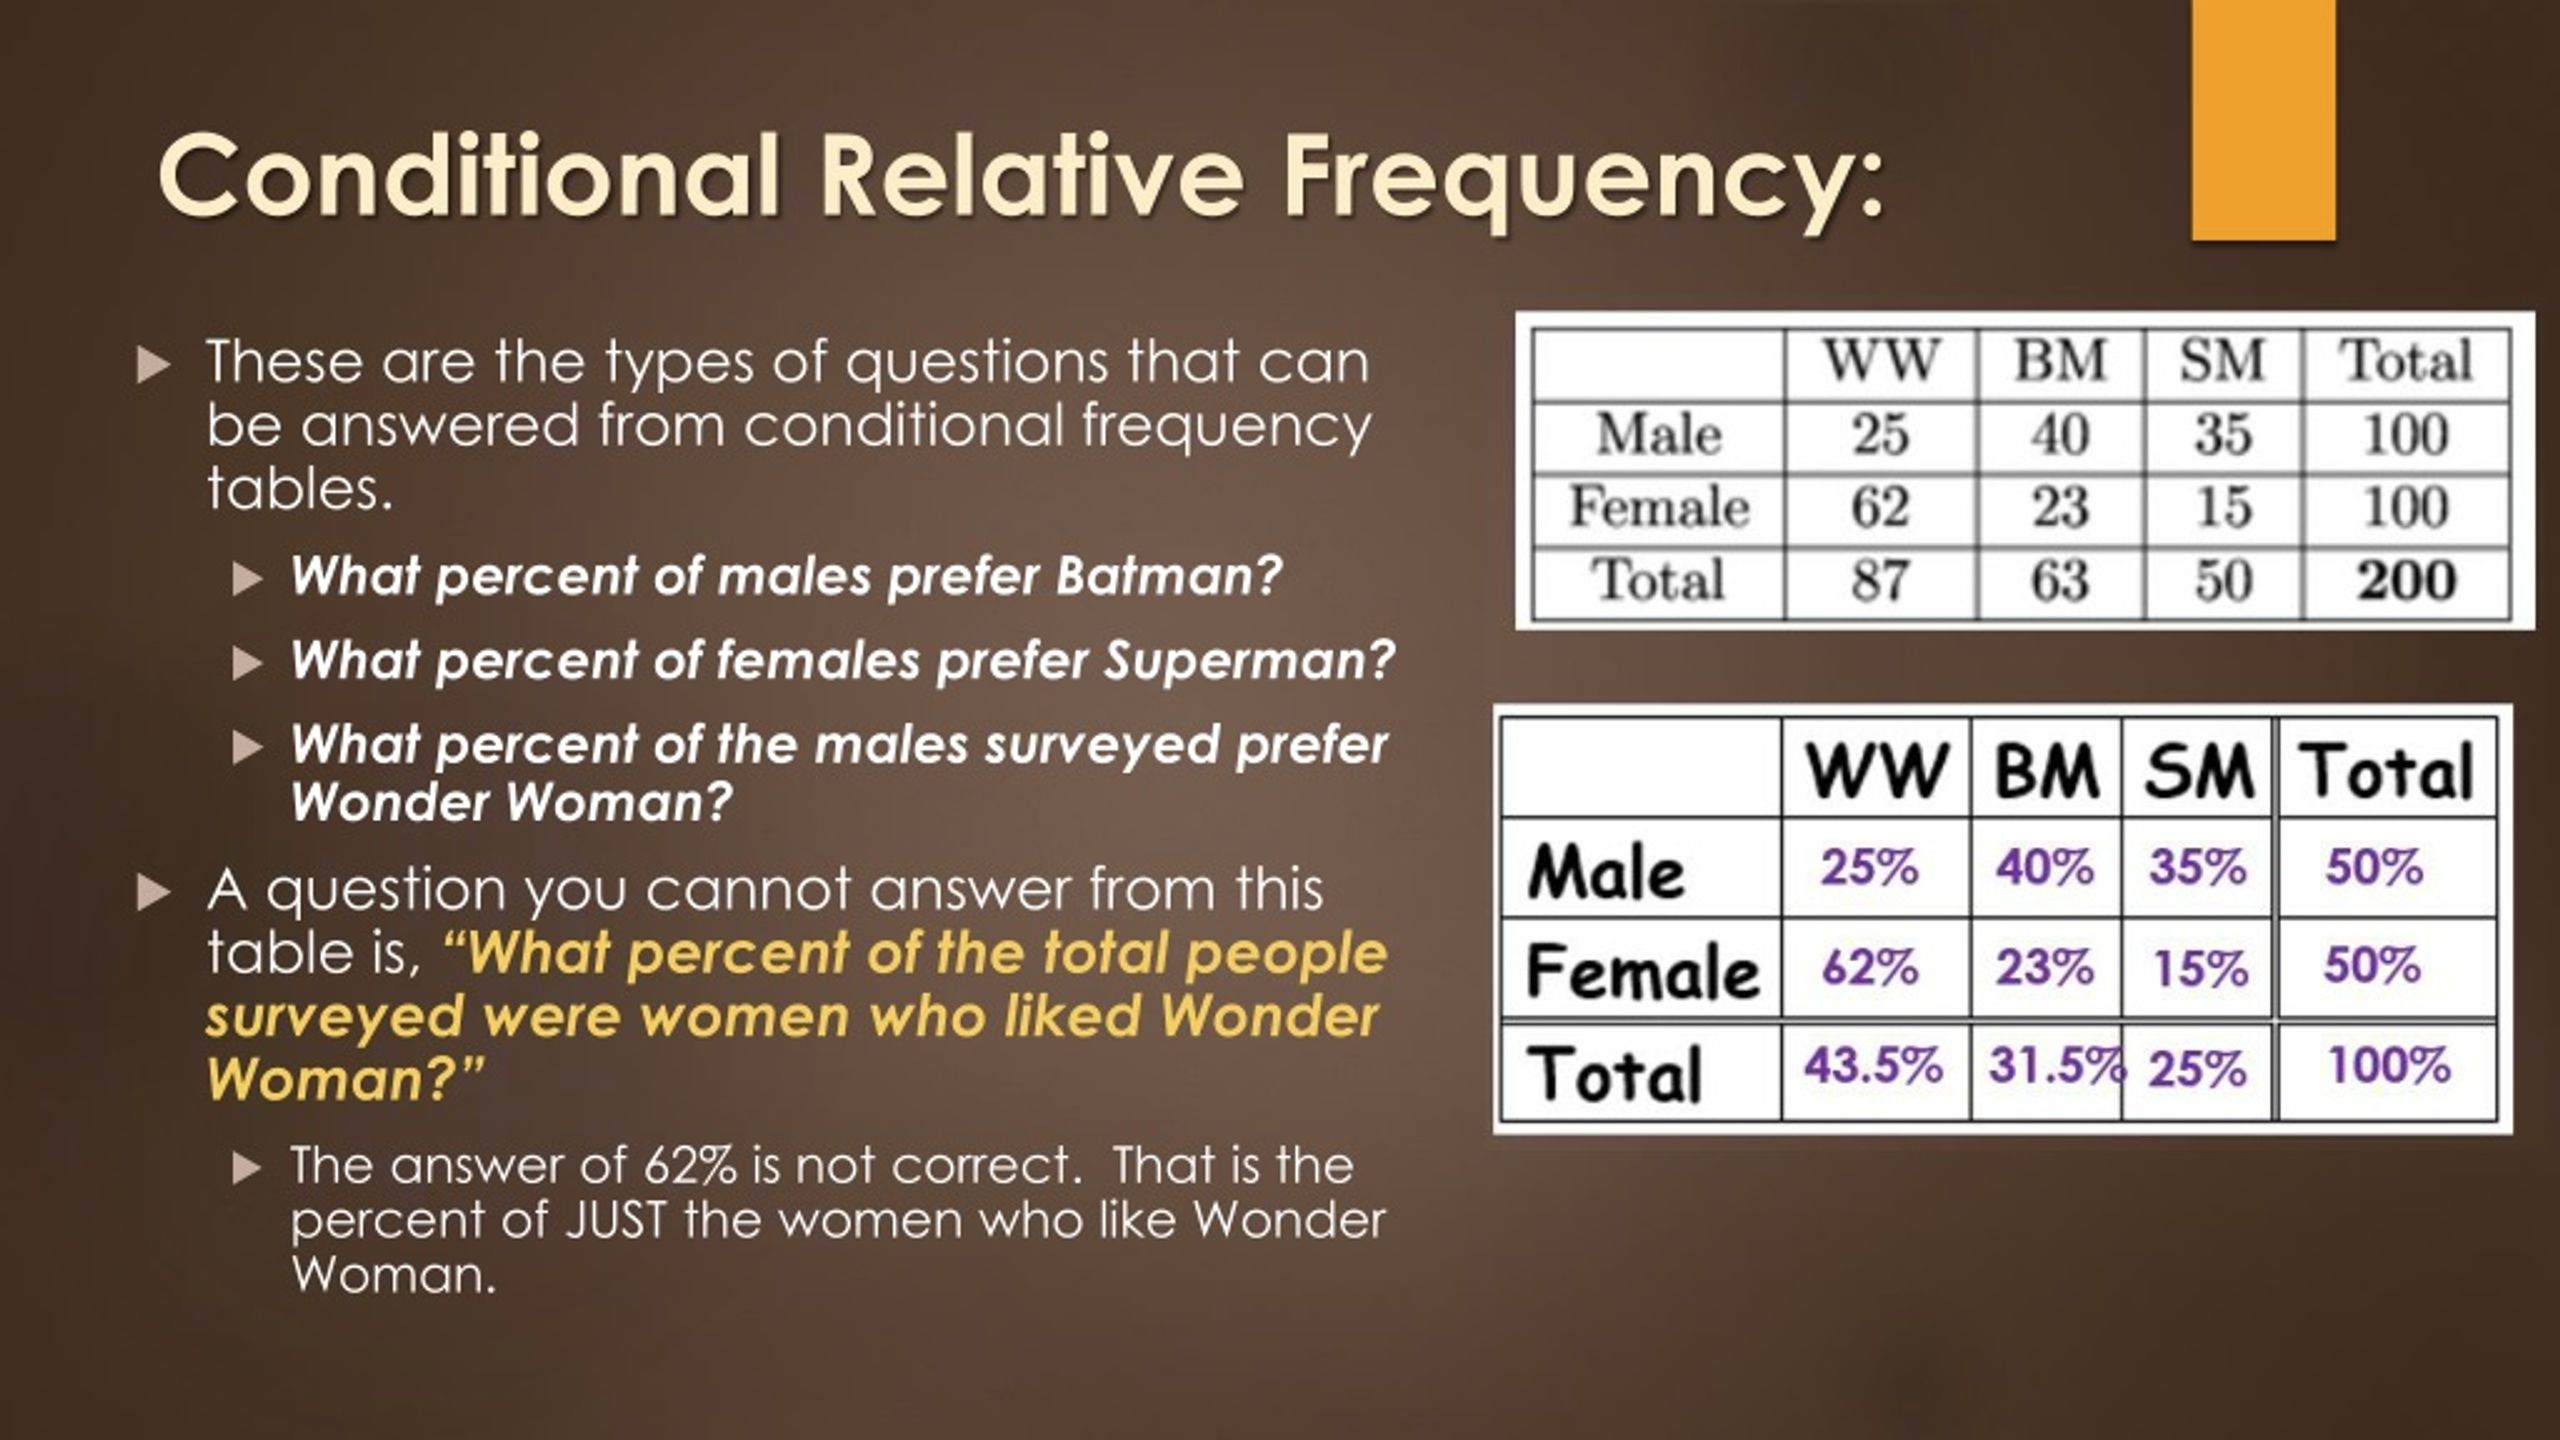
conditional relative frequency
proportion of indivs that have a specific value for one categorical variable among indivs who share the same value of another categorical variable
mosaic plot

what measure of center do you use when the shape of the distribution is skewed to the left or right? why?
use the median because it is resistant to extreme values
what measure of center do you use when the shape of the distribution is symmetrical?
the mean
what happens to the mean when the shape of the distribution is skewed to the left?
the mean becomes smaller
what happens to the mean when the shape of the distribution is skewed to the right?
the mean gets bigger
what happens when the shape of the distribution is symmetrical?
the mean equals the median
what type of spread do we use when the shape of the distribution is skewed to the left or right?
the IQR (interquartile range)
IQR
interquartile range, measures the spread of the middle ½ of data (Q3 - Q1)
what type of spread do we use if the shape of the distribution is roughly symmetrical?
standard deviation (mean is always accompanied with standard deviation)
standard deviation
quantifies the average distance from the mean (