W9 egalitarianism inc&sub effects z*
1/32
Earn XP
Description and Tags
Taxes and Redistribution
Name | Mastery | Learn | Test | Matching | Spaced | Call with Kai | Chat |
|---|
No analytics yet
Send a link to your students to track their progress
33 Terms
What are the two main reasons for government intervention in markets?
Improving efficiency (e.g. correcting market failures)
Reducing inequality via redistribution
Can the free market outcome cause inequality?
Even with no market failures, the free market outcome might generate substantial inequality
How can taxes/transfers be used for redistribution and what is the trade-off from this?
Governments can use taxes/transfers to redistribute between individuals with low vs. high marginal utility of consumption.
Generates efficiency vs. equity trade–off
How do we define an individual’s market income z? Define all terms.
z = wl + rk
w=wage or return on labour
l=labour supply
r=return on capital
k=capital or wealth
Inequalities in labour income are due to differences in what three factors?
Income-generating abilities (education, talent, physical ability)
Work effort (hours of work, effort on the job)
Luck (success of labour effort, chance of landing a better job)
Inequalities in capital income are due to differences in what three factors?
Wealth (past saving behaviour and inheritances received)
“Investment” effort (willingness to take risks, active management)
Luck (variation in rates of return across time and assets)
Is labour income or capital income a larger share of national income? What is the approximate percentages?
Labour income is more important
Labour income - 75%
Capital income - 25%
Is labour income or capital income more unequally distributed?
Capital income but generally upward sloping
What are the two primary measures of income inequality?
Top/bottom income shares (e.g., share of income accruing to the top 1%)
The Gini coefficient (twice the area between the 45° line and the Lorenz curve).
What does the Lorenz curve show?
Cumulative share of total income earned by the bottom p% of the population, plotted against p (percentile).
What does the Lorenz curve look like and how do we show/find the Gini coefficient?
Also 2 times area A
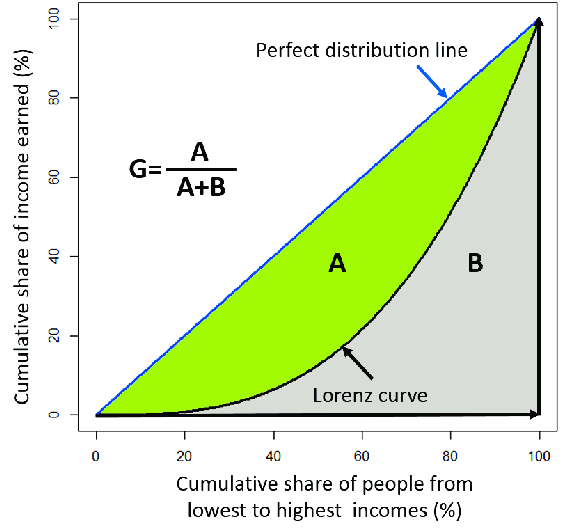
How do we show higher inequality on the Lorenz curve?
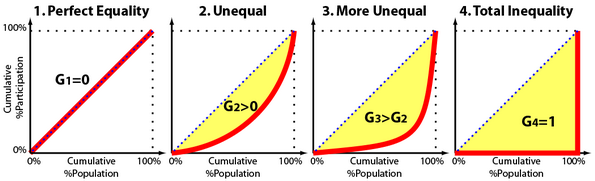
What Gini coefficient shows perfect equality and perfect inequality?
Perfect equality = 0
Perfect inequality = 1
What are the 4 main facts about income inequality in the UK?
Income inequality has increased substantially since the 1980s
Top income shares actually dropped dramatically from 1900-1970 before they started to increase again since 1980
Fall in top income shares from 1900-1970 happened in most OECD countries (L-shaped), but surge in top income shares afterward primarily in English-speaking OECD countries (U-shaped)
Top incomes used to be mostly capital income, now come from both labour income and capital income
What is a measure of intergenerational income mobility?
Average (pre-tax) income rank of children by rank of parents
Independent of any changes in the distribution of income between the two generations
What does evidence show about intergenerational income mobility?
If parent income rises then child income also rises (low intergenerational mobility)
Countries with more inequality have more correlation between parents and children’s incomes e.g. US has steeper slope than Denmark
What is intergenerational mobility?
The extent to which individuals' socioeconomic status changes across generations, essentially measuring how much movement there is between parents' and children's economic and social standing
If parents rich then you rich if low intergenerational mobility
What is disposable income defined as when there is a tax-transfer function?
c = z - T(z)
c=post-tax/disposable income
z=pre-tax income
T(z)= schedule of taxes and transfers
How do we define a redistributive/progressive or regressive tax and transfer system using the disposable income equation?
Redistributive: Inequality in c < Inequality in z (after taxes and transfers everyone in society becomes more similar)
Regressive: Inequality in c > Inequality in z (after taxes and transfers the rich got richer and poor got poorer)
If we have linear income tax system, c = z · (1 − t) + G, where G is a lump-sum grant, is this system progressive or regressive?
Progressive
Lower-income pay less in taxes (since their z will be lower and tax is a fraction of z) but get same transfer G
How has income inequality for the top 10% share and bottom 50% share in the UK changed?
Inequality in top 10% share has decreased due to progressive policy
Inequality in the bottom 50% share has increased
What is a transfer benefit with zero earnings equal to?
T(z) = -T(0) > 0
z=0 as zero earnings
> 0 means person gets money from the government instead of paying taxes
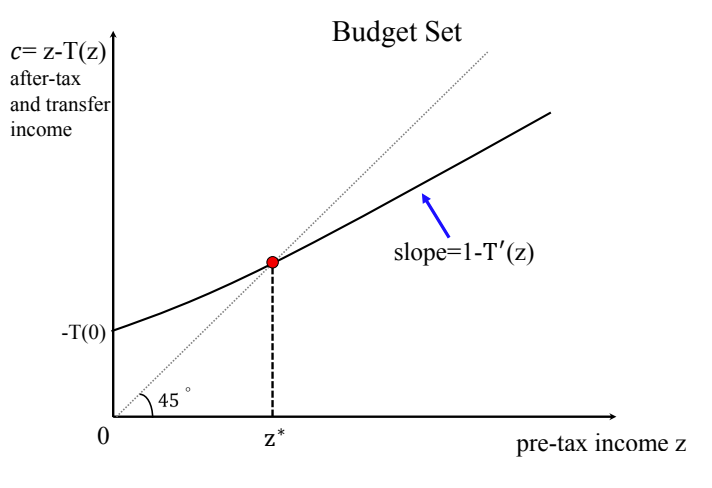
What is the marginal tax rate and why does it matter?
T′(z)
It is the fraction of an extra £1 earned that is taxed. Individual keeps 1 - T’(z)
It matters since it affects “intensive‐margin” (how much to work) work/leisure incentives.
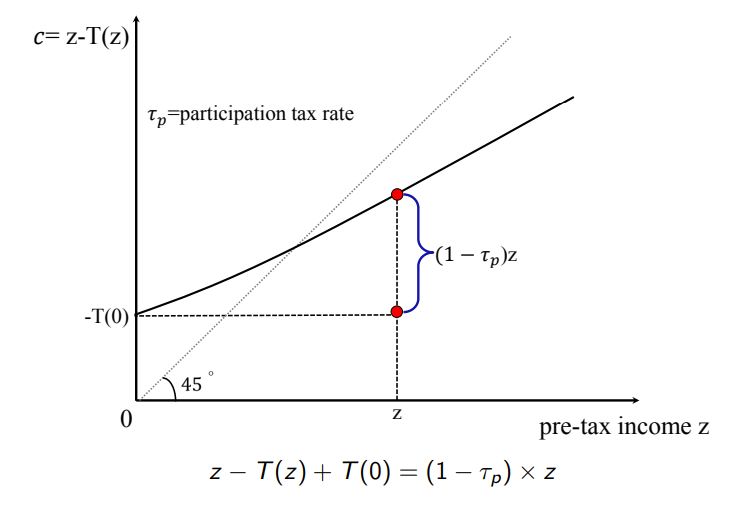
What is the participation tax rate τp? Why does this matter?
τp = [T(z) − T(0)]/z
Individual keeps fraction 1 − τp of earnings when moving from zero earnings to earnings
It matters since it affects “extensive‐margin” (whether to work) work/leisure incentives.
What is the break-even earnings point z*? At what point are individuals net recipients or contributors?
The income level where net tax paid is zero: T(z*)=0
Before z* = transfers > tax so net recipients
After z* = transfers < tax so net contributers
What does the budget set look like when plotting disposable income against pre-tax income? Explain the graph.
Before z* = c > z so net recipients and get richer after taxes/transfers
After z* =c < z so net contributors and get poorer after taxes/transfers
45 degree line is benchmark with no tax/transfer so c=z
How do we show participation tax rate on the graph?
Difference between red points: what you gain from work vs not working and getting benefits
Top red point: z - T(z)
Bottom red point: - T(0)
Difference: z - T(z) - - T(0) = z - T(z) + T(0)
^This is equivalent to (1-τp)*z
Under utilitarian social welfare (SWF), what would unconstrained optimal redistribution do (if no behavioural responses)?
It would fully equalize disposable incomes: 100% tax on all incomes and equal lump‐sum transfers G (perfect egalitarianism).
Rich pay more but poor get more - after tax incomes will be equal
Why is 100% redistribution infeasible in practice?
Because it destroys work incentives—people respond to high marginal rates by reducing labour supply.
Does the Social Welfare Function mean we can make Pareto Improvements?
No because we are not checking if everyone better off individually but rather just using the SWF to make interpersonal comparisons
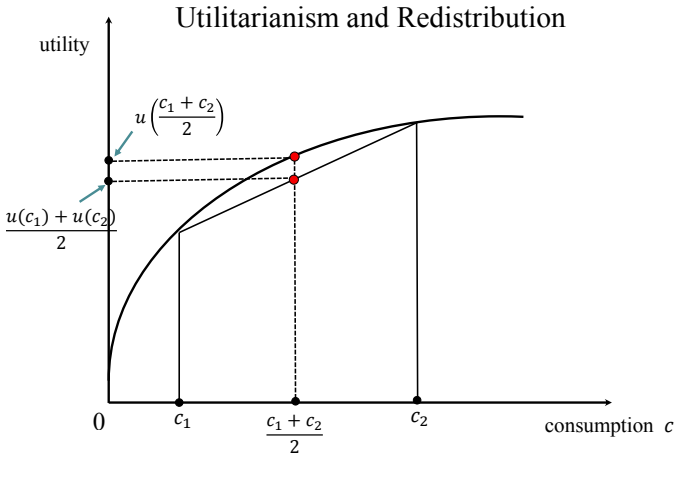
What does Utilitarianism with decreasing marginal utility lead to according to Edgeworth (1897)? What graph supports this?
Utilitarianism with decreasing marginal utility leads to perfect egalitarianism (100% tax and G for all)
Graph shows that u(c1 + c2/2) > u(c1) + u(c2)/2 or average income utility > average of individual utilities
What is utilitarianism?
It aims to maximise total welfare by summing individual utilities
What are the issues with utilitarianism and egalitarianism ?
Assume no behavioural responses: 100% redistribution would destroy incentives to work ⇒ Optimal income taxation theory incorporates behavioural responses and formalises tradeoff between equity and efficiency
Limitation of Utilitarianism: Many people would object to 100% redistribution ⇒ Citizens’ views on fairness can impose other limits on the amount of redistribution that a government can do