Macroeconomics - Chapter 5
1/20
Earn XP
Description and Tags
The Goods & Financial Markets The IS-LM Model
Name | Mastery | Learn | Test | Matching | Spaced | Call with Kai |
|---|
No study sessions yet.
21 Terms
Goods & Financial Markets (The IS relation)
WE now introduce the interest rate into our model and determine its effect on investment.
Investment now depends on production (Y) or sales and the interest rate (i). I = I(Y,i) → Y(+) & i (-)
Equilibrium in the goods market becomes:
Y = C(Y-T) + I(Y,i) + G -> IS RELATION
The IS relation
The demand (ZZ) curve is not linear as we cannot assume that the consumption and investment relations are linear. → The demand for goods is an increasing function of outputs
Equilibrium requires demand for goods = output
An increase in output → increase in income and → increase in disposable income → increase in consumption.
An increase in output also leads to an increase in investment
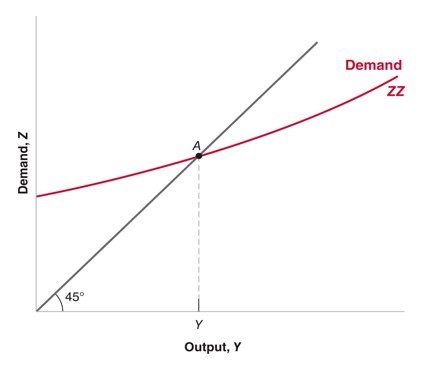
The IS Relation Graph
•Z Z is upward-sloping because, for a given value of the interest rate, an increase in output leads to an increase in the demand for goods through its effects on consumption and investment.
•Z Z is flatter than the 45-degree line because we have assumed that an increase in output leads to a less than one-for-one increase in demand.
•The intersection of Z Z and the 45-degree line (point A) is the equilibrium level of output.
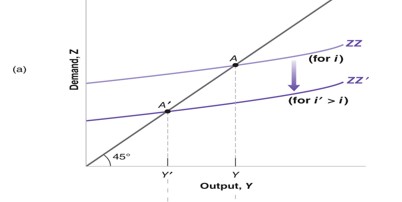
Demand Curve (Increase in interest rate)
(a) An increase in the interest rate decreases the demand for goods at any level of output, leading to a decrease in the equilibrium level of output.
→ An increase in the interest rate leads to a decrease in the demand and thus leads to a lower investment. The demand curve will shift down
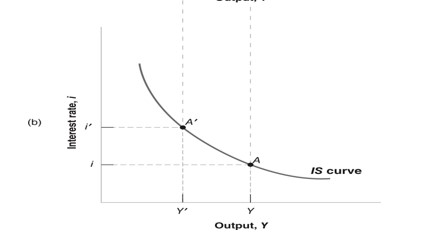
The IS Curve (Increase in the interest rate)
The IS curve gives the equilibrium output as a function of the interest rate.
(b) Equilibrium in the goods market implies that an increase in the interest rate leads to a decrease in output.
The IS curve is Downward-sloping: Equilibrium in the goods market implies that an increase in the interest rate leads to a decrease in output
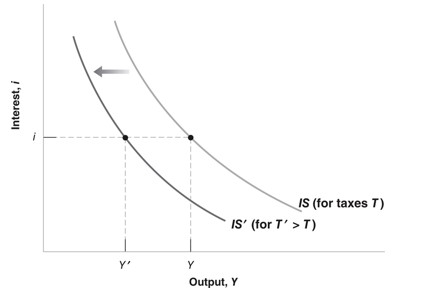
Shifts of the IS curve
An increase in taxes shifts the IS curve to the left.
Increase Tax→ decrease in disposable income→decrease in consmuption→decrease in demand for goods→decrease in equilibrium output
→ Changes in factors that decrease (or increase) the equilibrium level of output, for a given interest rate, shifts the IS curve to the left (or right).
→ Changes in factors that decrease the demand for goods given the interest rate shift the IS curve to the left.
Any factor that, for a given interest rate, decreases the equilibrium level of output causes the IS curve to shift to the left. We have looked at an increase in taxes. But the same would hold for a decrease in government spending or in consumer confidence (which decreases consumption given disposable income).
The LM Relation
Recall: M = $Y*L(i)
To get real values: M/P = Y*L(i)
• In equilibrium, real money supply equals the real money demand, which depends on real income Y, and the interest rate i.
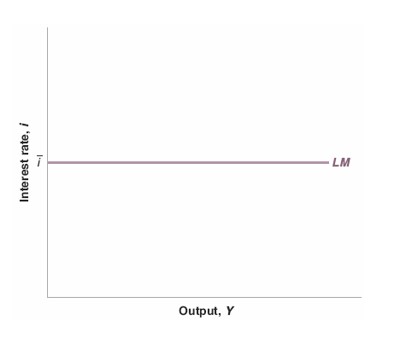
The LM Curve
The central Bank chooses the interest rate (i) and adjusts the money supply so as to achieve it.
→ This will make for a simple LM curve which is a horizontal line at the value of the chosen interest rate.
→ Any point on the LM curve corresponds to equilibrium in the financial markets.
The IS-LM Relation
IS relation: Y = C(Y-T) + I(Y,i) + G
LM relation: i = ¯i
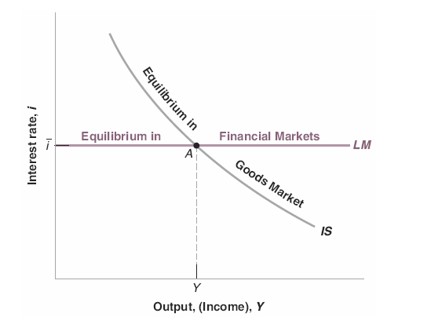
•The IS and LM relations together determine output.
•Any point on the downward-sloping IS curve corresponds to equilibrium in the goods market.
•Any point on the horizontal LM curve corresponds to equilibrium in financial markets.
•Only at their intersection (point A) are both equilibrium relations satisfied.
IS & LM Curve together
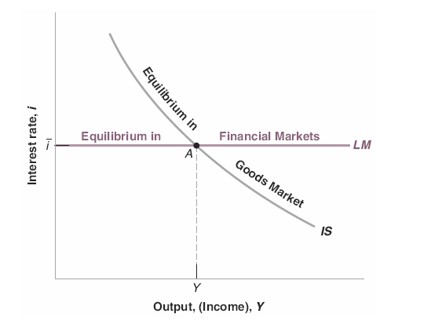
Equilibrium in the goods market implies that an increase in the interest rate leads to a decrease in output. This is represented by the IS curve.
Equilibrium in financial markets is represented by the horizontal LM curve.
Only at point A, which is on both curves, are both the goods and financial markets in equilibrium.
Fiscal Contraction & Fiscal Expansion
Fiscal Contraction: A reduction in the budget deficit, achieved either by increasing taxes, or by decreasing spending (Decrease in G-T)
Fiscal Expansion: an increase in the budget deficit, achieved either by decreasing taxes, or by increasing spending (Increase in G-T)
Each entities contribution:
Central Bank: change the interest rate
Government: Can increase or decrease taxes
Consumers: Can become more pessimistic
Steps for analyzing the effects of changes in policy (Fiscal)
1.Does it shift the IS curve and/or the LM curve?
2.What does this do to equilibrium output and the equilibrium interest rate?
3.Describe the effects in words.
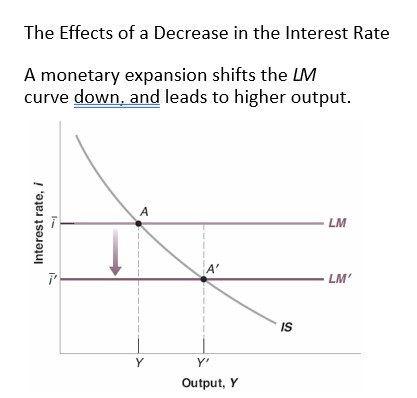
IS & LM Relation (Monetary Policy)
Recall: To reduce i, it increases the money supply
Monetary Policy:
Decrease in i ⇔ increase in M ⇔ monetary expansion
Increase in i ⇔ decrease in M ⇔ monetary contraction ⇔ monetary tightening
Using a Policy Mix
Monetary-Fiscal policy is a combination of the policies
Suppose the economy is in recession and output is low:
→ Both fiscal & Monetary policies can be used to increase output
Why we use a Policy Mix
If the economy is in recession and output is low, then:
•Already in a deficit, so monetary policy is better
•Already zero lower bound, so fiscal policy is better
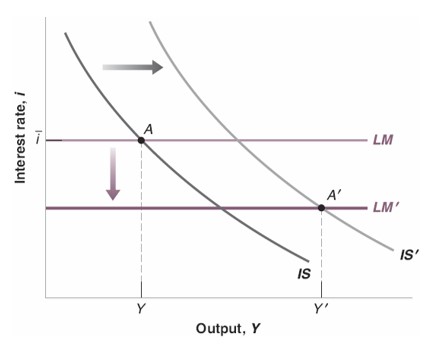
Policy Mix graphically
Fiscal expansion shifts the IS curve to the right
A monetary expansion shifts the LM curve down
→ Both lead to a higher output
Effects of Fiscal Contraction & Monetary Expansion
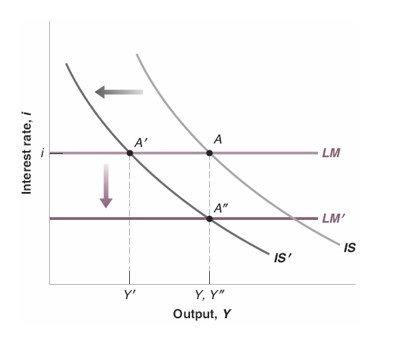
Fiscal Contraction & Monetary Expansion → Gov wants to reduce deficit without triggering a recession
Fiscal contraction shifts the IS curve to the left & Monetary expansion shifts the LM curve down
Result: Reduction in deficit without a recession
Is deficit reduction good or bad for investment?
Equilibrium in the goods market: I = S + (T-G)
Given a private savings (S), a lower gov deficit (G-T) means higher I
However, Fiscal contraction lowers output so S decreases more than T-G ~ I decreases
→ Implies there’s a need for monetary policy. The central Bank will decrease interest rate so as to keep output constant ~ I will increase