Week 6 - Non-parametric & measures of association and hierarchy of evidence
1/26
Earn XP
Description and Tags
Apart of Introduction to Evidence Based Practice and Research in Health Sciences at UniSA
Name | Mastery | Learn | Test | Matching | Spaced | Call with Kai |
|---|
No analytics yet
Send a link to your students to track their progress
27 Terms
What is the difference between correlation and correlation coefficient?
Correlation is a technique used to investigate the relationship between two numerical variables whereas correlation coefficient measures the relationship between two numerical measurements (which tells us the magnitude of relationship, direction of relationship, and bivariate distribution).
What is the difference between positive and negative correlation?
Positive is present when high values in one variable are associated with high values of another variable or vice versa and negative is present when one variable is associated with low values or other variables or vice versa.
How is correlation displayed and how can it be analysed (2 points)?
Scatterplots and can be analysed by looking if it’s linear or non-linear association and if the trend of association is positive or negative.
What are the two types of correlation coefficients?
Pearson correlation coefficient ®
Spearman correlation coefficient (rs)
Pearson correlation coefficient ®
A correlation coefficient which measures the strength of linear association between two quantitative variables.
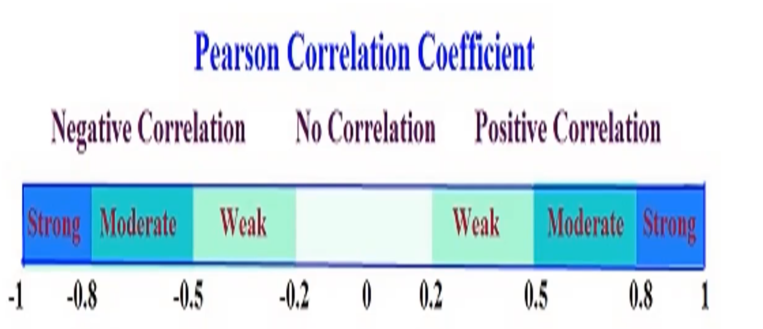
How is Pearson correlation coefficient interpreted?
On a scale from -1 to +1 with zero representing no correlation, more than 0 or closer to 1 is more positive, and less than 0 or closer to -1 is more negative.
Spearman correlation coefficient (rs)
A correlation coefficient which measures the strength of association between two ranked variables.
Why is Spearman correlation coefficient used over Pearson’s in some data sets (3 points)?
If the assumption is markedly violated
If there is a monotonic relationship between variables
If the sample is very small
Does correlation imply causation, true or false?
False (e.g. MMR vaccination does not imply/cause autism)
Regression analysis
A common way of estimating the relationship among the variables (e.g. Given the age of an individual, can we estimate/predict their income levels)
Linear regression
The most basic and common type of predictive analysis where at the centre of the regression analysis, is the task of fitting a single straight line through a scatter plot (known as a regression line).
What is the difference between parametric and non-parametric data?
Parametric assumes normal distribution, homogenous variance, and data sets are typically ratio or intervals whereas non-parametric is where there are no assumptions on distribution or variance relationships and data sets are typically ordinal or nominal.
What are the advantages of using parametric and non-parametric data?
Parametric data can draw more conclusions from the sample to the population whereas non-parametric data is more simple and less affected by outliers.
In non-parametric statistics, is population median or population mean is used?
Population median.
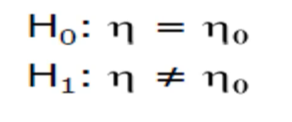
Sign test
A type of non-parametric test which tests the hypothesis concerning the median where if the null hypothesis is true, there is approx. an equal number of observations greater and less than the median.
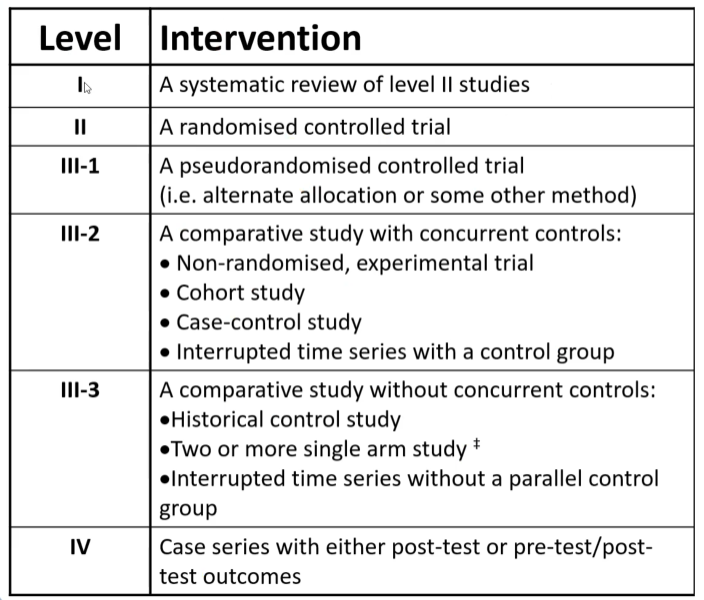
Hierarchy of evidence
Ranking systems of various study designs based off how biased it is (the highest has the least amount of bias while the lowest has the most amount of bias).
What is hierarchy of evidence important in health care?
It provides information on a chosen research design of a study regarding how it can influence the believability of the results of the study (relating back to internal and external validity).
How to deal with chance?
Having an adequate and relevant sample size using appropriate calculations either prior or during the data analysis stage which minimises chance since it cannot be completely removed.
What is the difference between reporting and methodological bias?
Reporting bias relates to the process of accessing research evidence whereas methodological bias relates to bias inherent in the conduct of research.
What are the three types of reporting bias?
Publication (e.g. only looking at academic)
Location (e.g. only looking at journals)
Language (e.g. only selecting articles in English)
How to deal with eight methdological biases?
Sampling through using appropriate sampling methods like convenience, consecutive, systematic, or random.
Allocation through random allocation.
Maturation through having a “true” control group.
Recall through using objective measures and careful questioning.
Attrition through having an adequate and relevant sample size + taking loss into account from the get-go.
Measurement through training and achieving standardisation in the data collection process and having a blind measurer/assessor.
Placebo through participant blinding however, not always possible in allied health.
Hawthrone through participant blinding.
How to deal with confounders?
Having clear and explicit inclusion and exclusion criteria and randomly allocating participants to spread confounders randomly and evenly.
How is hierarchy of evidence selected (5 points)?
Intervention, diagnosis, prognosis, aetiology, and screening intervention.
What is the hierarchy of evidence used in Australia?
NH&MRC Hierarchy of Evidence (which can be further split into prognostic, aetiological, and screening intervention).
What is the main deficieny/disadvantage of the NH&MRC Hierarchy of Evidence?
It does not recognise opinions of respected authorities as evidence levels such as editorials, opinion pieces, points of view, and consensus statements where if there is an absence of published evidence, then there is NO evidence.
What are four other types of hierarchy of evidence used around the world?
Lloyd-Smith
Harbour & Miller
Oxford Centre for Evidence-based Medicine Levels of Evidence
Alternative-evidence rating scale
Why isn’t hierarchy of evidence applied to qualitative research?
Due to its subjective nature however, there is ongoing debate on its use and there have been attempts to apply hierarchy of evidence to qualitative research.