The Phillips Curve
1/3
There's no tags or description
Looks like no tags are added yet.
Name | Mastery | Learn | Test | Matching | Spaced | Call with Kai |
|---|
No analytics yet
Send a link to your students to track their progress
4 Terms
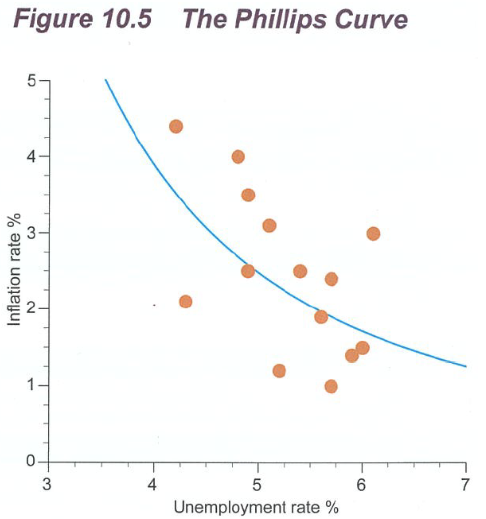
The Philips curve
The Phillips curve illustrates an inverse relationship between inflation and unemployment:
Decrease in unemployment → Increase in inflation
Decrease in inflation → Significant increase in unemployment
Definite negative or inverse relationship which confirms the important macro principle that as economic activity increases, the unemployment rate will fall and inflation will rise.
Short run dynamics
In a recession, unemployment is high. Policymakers may respond with expansionary measures (e.g. increasing government spending, cutting taxes) to increase money supply and stimulate demand. As aggregate demand rises, firms increase output and hire more workers, reducing unemployment. This shifts the economy to a new macroeconomic equilibrium with higher prices and output.
However, this comes at the cost of higher prices, causing inflation. This results in an upward movement along the short-run Phillips Curve (SRPC), with unemployment falling but inflation rising.
Conversely, contractionary policies aimed at lowering inflation (e.g. reducing demand) can reduce price growth but cause firms to cut employment. This shifts the economy to a new macroeconomic equilibrium with lower prices and output. This results in a downward movement along the SRPC, with inflation falling but unemployment rising.
Therefore, in the short run, policymakers face a trade-off: reducing unemployment tends to raise inflation, while reducing inflation tends to increase unemployment.
Phillips curve
at the natural rate of unemployment: attempts to change unemployment only affect inflation. Any measure taken to change unemployment only results in an up-and-down movement of the economy along the line.
Falling unemployment → rising inflation (cost push and demand pull) → rising unemployment (laying off workers) → falling inflation→ falling unemployment.
NAIRU
NAIRU is the unemployment rate consistent with a stable inflation rate. If unemployment falls below the NAIRU, inflation tends to rise. If unemployment rises above the NAIRU, inflation tends to fall.
Below NAIRU → Labour market is “too tight” (too few unemployed workers) → wages rise quickly → costs increase → inflation accelerates.
Above NAIRU → Labour market slack (too many unemployed) → wage growth slows → inflation decelerates.
NAIRU corresponds to the long-run Phillips curve, which is vertical at this natural rate of unemployment.
In the long run, unemployment cannot be permanently pushed below NAIRU without causing accelerating inflation.